[REPOST][Psychology of Trends Cycle] - Crypto Academy / S6W4- Homework Post for @reminiscence01

Hello prof @reminiscence01, here is my second repost to this assignment with link:

QUESTION 1
Explain your understanding of the Dow Jones Theory. Do you think Dow Jones Theory is important in technical analysis?
As found in its name, this theory was found by Charles Dow in 1897 where he understood that most of the time the market is usually in an uptrend or in a downtrend. In his belief, every activity existing in the market depends on factors such as supply and demand, news based on the economy, political activities, amongst others. This all play a great deal in technically analyzing the prediction of the market on a specific asset.
In the theory, the movement of price is categorized into the major, medium and minor trends.
- The major trend involves the movement on a grand scale.
- The medium trend lasting only for a couple of months.
- The minor trend lasting only for a couple of days.
In addition to this, the Dow’s theory talks on the way the market reacts to new information and reflecting this on the chart of an asset. Depending on the news and the information of the asset, the asset experiences a change in its movement which is either positive or negative depending on the type of orders run by the trader. Finally, the theory talks on the relationship that exists between volume and price of an asset. It states that the agreement between the volume and order reflects the market at that point.
Technical analysis using the Dow’s theory
YES, I think the Dow Jones theory is important in technical analysis because of how it helps traders understand on market feelings, market phases, the play between supply and demand, relationship of price and volumes. This knowledge is gold-like to traders as a good mastery of this will see a greater success rate over failure.
I would love to use for example the concept of demand and supply here.
- If the demand of a particular asset exceeds its supply at a given time, the price begins to trend upwards and thus the price increases. *In the condition where the supply of the asset is greater than its demand, a downward trend is experienced thus a downtrend of that asset.
- If for example, the demand and supply of the asset are in a possible equilibrium, the market is in no visibly direction and thus is termed in a state of consolidation.
These are some of the understandings that traders are supposed to comprehend in the study of the market of an asset. Many a times, big hands tend to lure small-scale traders into taking positions that only tend to serve the big hands greater profits. This is vital as a good knowledge of how a market trends (whether or not it is strong) helps traders work on their profits.

QUESTION 2
In your own words, explain the psychology behind the Accumulation and Distribution phases of the market. (Screenshots required)
In the market, most at times that of cryptocurrencies, prices are likely to be inclining upwards or downwards. These cyclic market trends are thus either uptrends or downtrends. A price can be dipping for a while, decides to bounce back to the top. For novices, it can be summarized thus; the period of momentary consolidation of a price before an uptrend can be referred to as accumulation. Conversely, the consolidation phase before a downtrend is the distribution of the market.
ACCUMULATION PHASE
The way price acts in a market is mostly influenced by whales whereas common traders just follow the trend already established. What they do in summary is this;
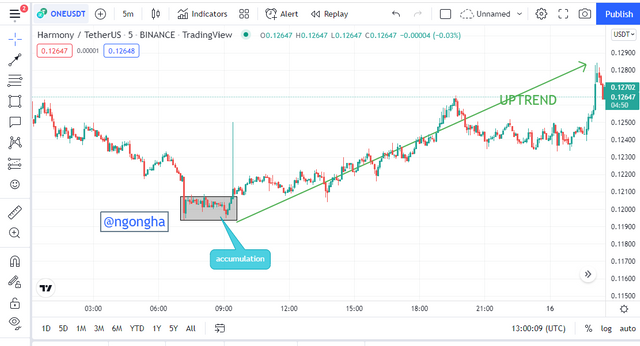
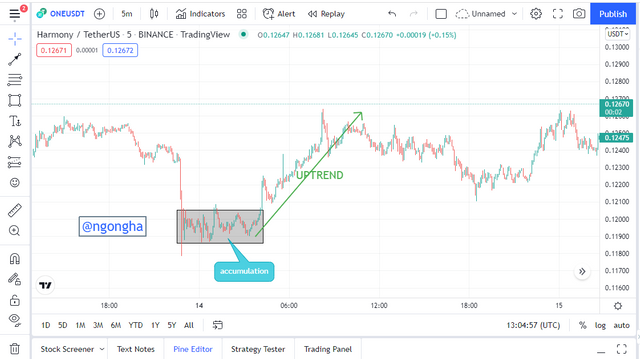
When a price is experiencing a high selling pressure, (a downtrend), most retail traders also tend to participate in the downtrend by taking sell orders as well in the fear of missing out. At this instant, these whales (big hands) decide to start reaping off their profits by closing their sell positions. As a result of the magnitude of the positions opened by these whales, the price begins to relent as they prepare to open buy orders. Now the market tends to be bullish.
Due to the sudden change of nature of the market from bearish to bullish, the retail traders fear again and decide to close their sell orders as they believe they are about to be liquidated (for those who trade without a stop loss). Now, the volume in bullish market increases, a price reversal and breakout of the uptrend is experienced. Below is an example of this;
Now, as the price breaks this accumulation phase, it surges upwards for a period of time as the buy orders are increased. There exist points now where some whales who had executed their buy orders earlier decide to take their profits thus reducing the pace of the orders and in so doing creating a little retracement. This “trap” point is referred to as the re-accumulation phase where orders are lower prices can be executed. I call this point a “trap” because most traders may confuse it for an actual reversal and start placing sell orders. This is shown as such;
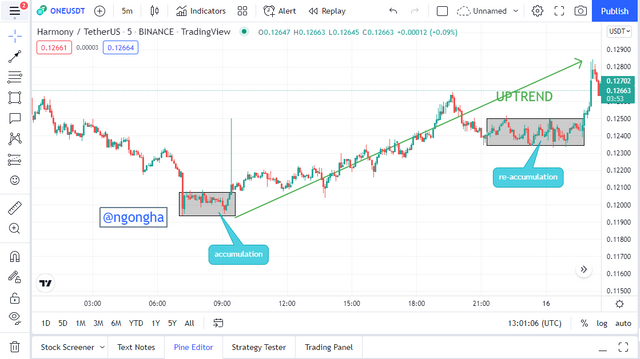
To be certain on whether or not it is an actual reversal, note should be taken on whether or not the price breaks below the low zone defined by the re-accumulation phase.
DISTRIBUTION PHASE
It can be considered as an almost mirror explanation of the accumulation phase. Here, the whales (big hands) who had earlier bought assets when it was the accumulation phase start to close their orders. As such, the price is slowing down because of their position volumes. As usual, common traders fear as well and start closing their positions creating a sideways movement before many more sellers enter the market and increase the number of sell orders as seen below;
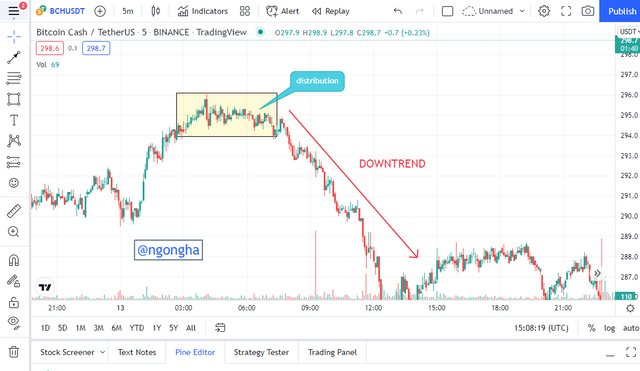
At times, the price of the asset retraces to a certain high point in a phase known as re-distribution. More selling orders are added and the trend of price continues.
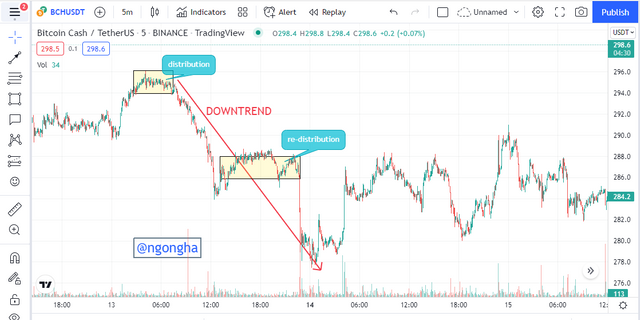
It is vital not to confuse this re-distribution phase to a reversal in trend or the accumulation phase as this serves as a trap for common traders into thinking the bearish trend is weak. To confirm this, it is important to wait to see if the price breaks above the high of the phase where it is re-distributed.
QUESTION 3
Explain the 3 phases of the market and how they can be identified on the chart.
Market Phases
There exist mainly 3 phases of the market as iterated below;
- Bullish market
- Sideways market
- Bearish market
The nature of a trend can be identified using techniques such as trend lines, indicators and market structure. But it is generally not advisable to use indicators as they tend to lag in the identification of a possible trend. The market structure is the best tool we can use to identify the phase of the market while using indicators only to confirm it.
BULLISH MARKET
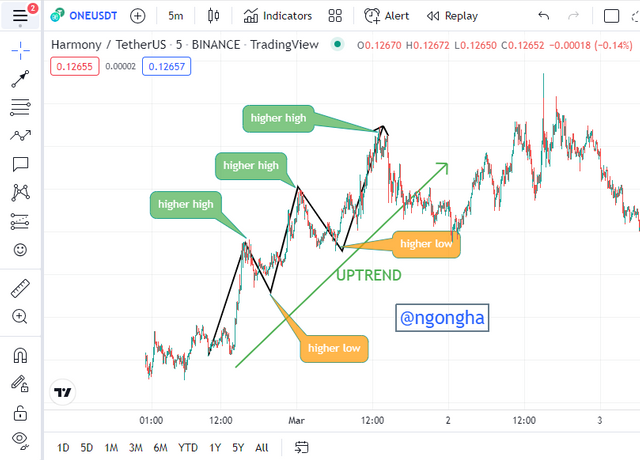
If the market is in an uptrend, it indicates that the demand of the asset is greater its supply and thus the candlesticks are having higher highs and higher lows.
The progression of higher highs should be taken into consideration as the newer higher high has to be greater than the previous high and as well, the newer low has to be greater than the low it precedes. This is done in order to prevent traders from taking false signals seriously and taking the orders.
An example which shows buyers are in control is shown thus;
BEARISH MARKET
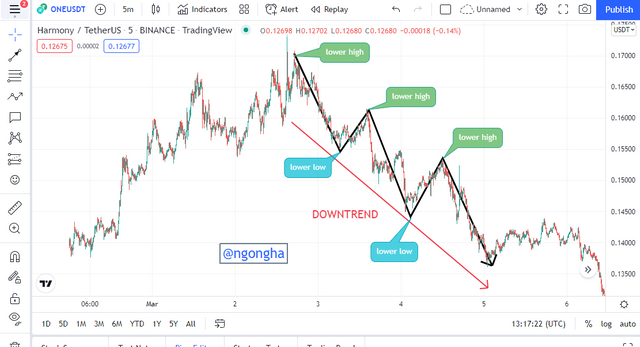
In the case of a downtrend, which shows that the supply of the asset is actually less than its demand, is represented by the appearance of candlesticks of lower highs and lower lows as compared to the ones they precede.
Again, the new low has to be visibly and significantly lower than that of the previous ones. Same applies for the highs.
An example which shows sellers are in control is shown thus;
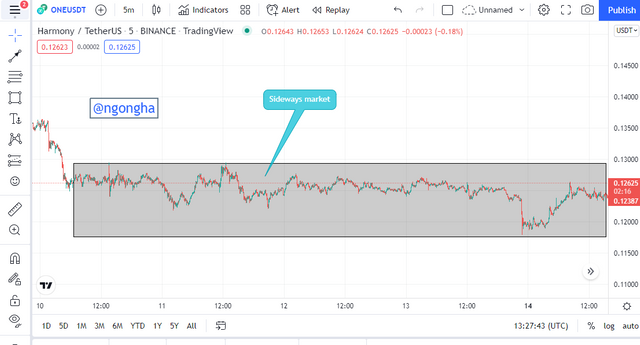
When the market is in a state where it appears to bounce off certain specified support and resistance levels, in indicates that the supply and demand of the asset is in an equilibrium. This state of consolidation is in preparation for the price to run a new trend – uptrend or downtrend. This sideways movement can occur either at the middle of the trend or at its end. Upon breakout, the direction suggests whether the price is reversing or it is continuing its initial trend.
SIDEWAYS MARKET
This is shown evident by the equilibrium nature of demand and supply of a particular asset. This sideways phase for example can be found both in the accumulation and distribution phases as support and resistance zones are seen on the chart. It is usually at indicated at the start or end of a trend within a restricted price range. An example of this is shown as such;
QUESTION 4
Explain the importance of the Volume indicator. How does volume confirm a trend? Do this for the 3 phases of the market (Screenshots required).
Price movement and volume
If the aspect of demand and supply of an asset is understood, it will be but normal to notice the agreement that volume has with it. This is evident as it aims to show the ratio of income influx and out flux from the market at a given period.
The Volume indicator is then used to identify the presence of whales at the moment. Based on different phases experienced in a market, the following is demonstrated.
Uptrend Phases Volume
Whenever the price of an asset decides to moving agitatedly, the Volume indicator shows a secondary support by an increase in income inflow to illustrate the bullish trend.
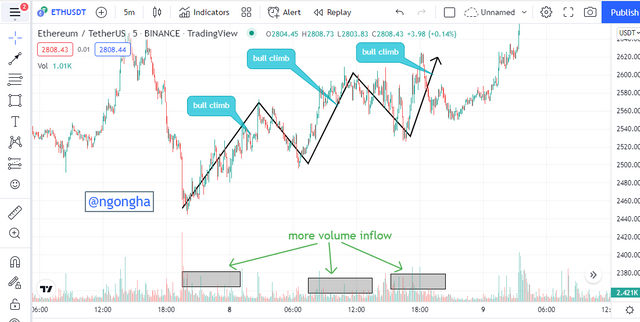
As seen above, the upward trend has a proportional increase to the volume distinctively shown by the Volume indicator. This increase doesn’t happen by coincidence, as it occurs in areas of bullish modes.
Downtrend Phases Volume
In the case where the price moves downward impulsively, the Volume indicator agrees to this chant by also increasing the volume of income that is being removed from the market.
The screenshot below is an example to this;
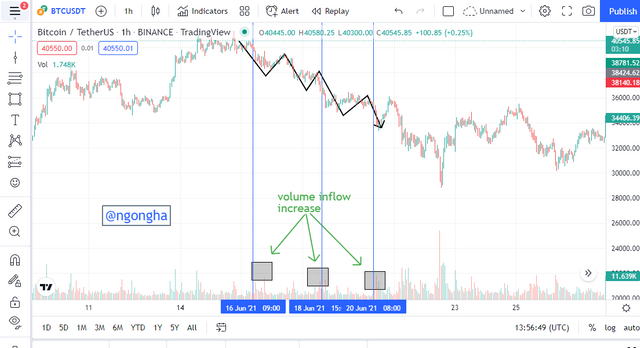
As seen above, the downward trend has a proportional increase to the volume distinctively shown by the Volume indicator as seen.
Sideways Phases Volume
As earlier seen, it occurs when the price is within a price range usually within a region of supports/resistance. Here, with little or no decision as to whether the price is to move up or down, the Volume indicator indicates the absence of volume since it is only ranging.
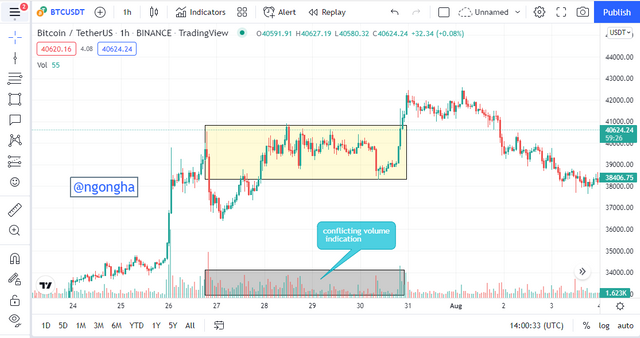
On the chart, the areas of minimal volume are connected with zones of uncertainty (sideways runs) as inconsistent volume indications are noticed because there is an equilibrium of buying and selling pressure.
QUESTION 5
Explain the trade criteria for the 3 phases of the market (Show screenshots).
There are explicit rules which are supposed to be respected so as not to endanger a trade which are seen as shown;
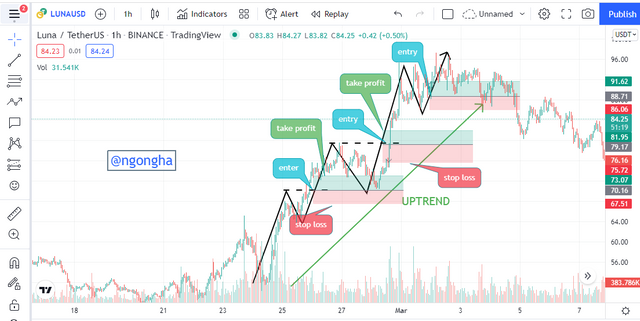
Uptrend Trade methods
In order to place a buy order, the following should be respected.
- The trend should be visibly seen as being bullish with consistent higher highs and lows. The volume should also be increased as shown by the volume indicator.
- Once a pullback to form a higher low point, the now new support is confirmed with bullish candlesticks appear. A buy order should be run upon sight of a valid bullish reversal candle network.
- As a norm, the stop loss should be placed. The position now is below the recent higher low. The take profit is placed targeting previous established highs.
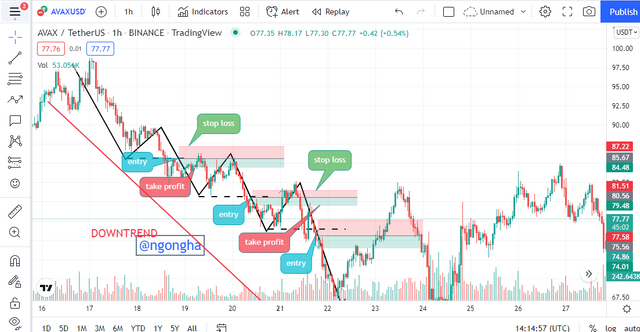
Downtrends Trade methods
In order to place a sell order, the following should be respected.
- The trend should be visibly seen as being bearish with consistent lower highs and lows. The volume should also be increased as shown by the volume indicator.
- Once a pullback to form a lower high point, the now new resistance is confirmed with bearish candlesticks appear. A sell order should be run upon sight of a valid bearish reversal candle network or break.
- As a norm, the stop loss should be placed. The position is below the recent lower high. The take profit is placed targeting previous established lows.
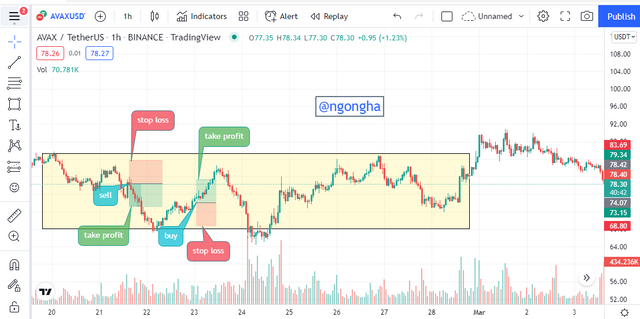
Sideways Trade methods
This is not a very ideal market for trading by beginners as it requires an extra set of skills of trading. The most important tool here is to identify potential support and resistance zones so as to target the entries.
Identify a proper support and resistance level. At the resistance, it is rejected by visibly allocating the formation of bearish reversal candlesticks, indicating an excess of selling pressure of the asset in the market. Conversely, at the support, it is rejected by visibly allocating the formation of bullish reversal candlesticks, indicating an excess of buying pressure of the asset in the market.
QUESTION 6
With the trade criteria discussed in the previous question, open a demo trade for both buy/sell positions.
SELL ORDER OF THE XRPUSDT PAIR
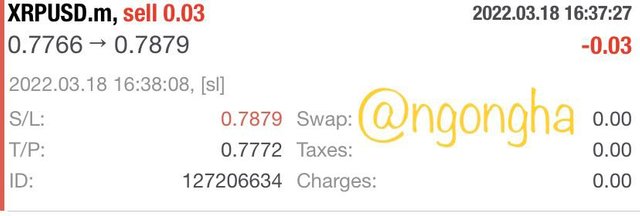
Using the 5 minute timeframe for this chart, I noticed that the trend at the moment was a downtrend characterized by the appearance of lower highs and lower lows. A lower low has a point which is lower than that of the preceding low and this is same for the lower highs. With proper risk management in the method of placing a stop loss and take profit, I executed the trade with screenshot below.
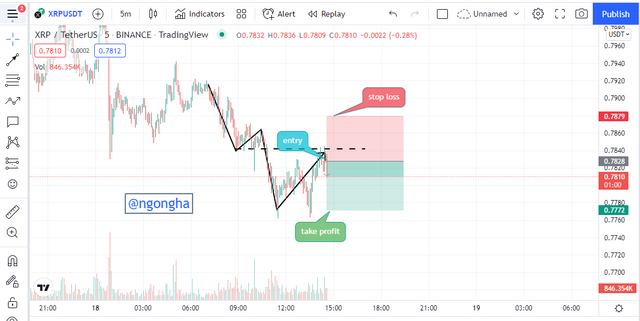
As seen above, the trend line was drawn with the intended direction of price movement. This led it to hit my stop loss which is inscribed in squared brackets as [sl] as seen below;
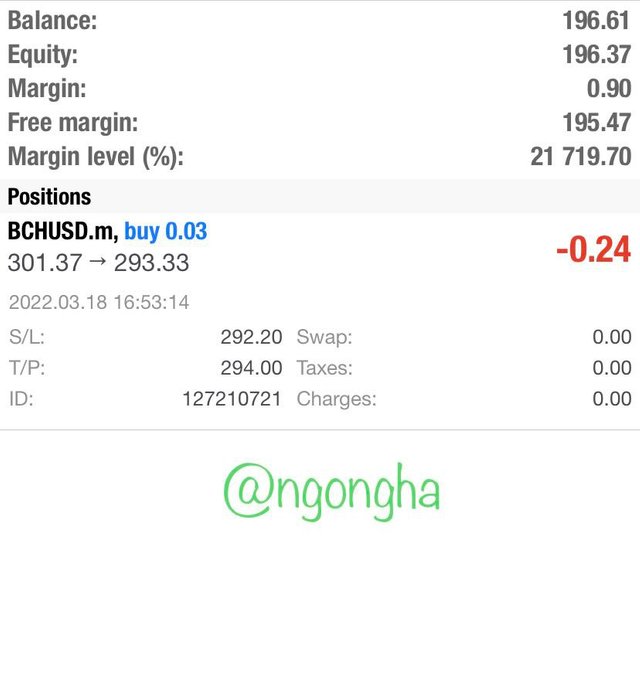
BUY ORDER OF THE BCHUSDT PAIR
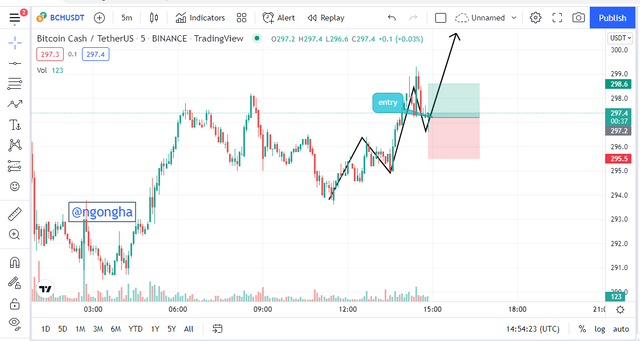
As seen above, the formation of uptrend with the appearance of higher highs and higher lows with each higher high or low higher than that which it precedes. I waited for a pull back to take place below finally executing an order . After setting my stop loss at $292.2 and the take profit at 294.0, the screenshot below adds weight to it.
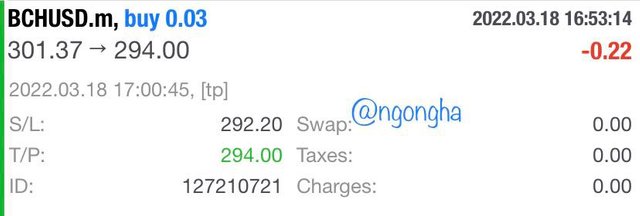
Below is the final screenshot at the end of the trade after it has taken profit which is visualized by the inscription [tp] seen in square brackets.
CONCLUSION
The concept of the Dow’s theory is the understanding of the aspects that matter in the determination of the nature of an asset based on market trends, technical analysis amongst others. Another idea that makes the concept given by the professor is the highlight on the accumulation and distribution phases of the market.
Using the Volume indicator too in regions to indicate to traders where there is high pressure – either being selling or buying has also been mentioned.
THE IMAGES USED HERE WITHOUT REFERENCE ARE ALL SCREENSHOT FROM tradingview.com
I wish to heartily thank @reminiscence01 for this intriguing work.