Fibonacci Tools - Steemit Crypto Academy |S6W4| - Homework Post for Professor @pelon53


QUESTION 1
Explain in your own words what you mean by Fibonacci retracement. Show an example with screenshot.
The Fibonacci retracement is one of the most widely used indicators for the trading of assets in the market space originating from the Italian which was considered by most as the most talented western mathematician in the 1170s called Leonardo Fibonacci.
In a market that is trending, that is, either it is following an uptrend or a downtrend, the price does not move in an exact straight line as one would wish to, instead, it moves in forms of pullbacks and retracements before continuing the price in its intended direction. The occurrence of these points result because some traders are taking off their profits and a chance to open orders too as well.
A trader basically not know whether or not to execute a trade with all these dips and climbs as it is not very easy identifying with the eye. For this particular reason, the Fibonacci retracement tool is needed to identify important support and resistance levels. In its set up, it is made of horizontal levels which act as support and resistance points especially for price reversals.
The functionality of this indicator is based on the mathematical principles of golden ratios which say that each number is supposedly 1.618 greater than the number it follows. This tool is drawn from the recent lows and highs which represent 0% and 100% respectively in uptrend and from recent highs to lows which represent 0% and 100% respectively in a downtrend.
The most important percentages found here 23.6%, 38.2%, 61.8%. Even though, the 50% and 78.6% are plastered into it and widely used, it should be noted that the 50% is not a Fibonacci number, but is a line the market has come to respect it becoming a suitable market correction.
The other intermediary prices serve as levels or zones of support and resistance where a trader is likely to experience a price reversal in a retracement. In so doing, entry and exit positions are vividly seen by the traders. Below is an example of the Fibonacci retracement tool;
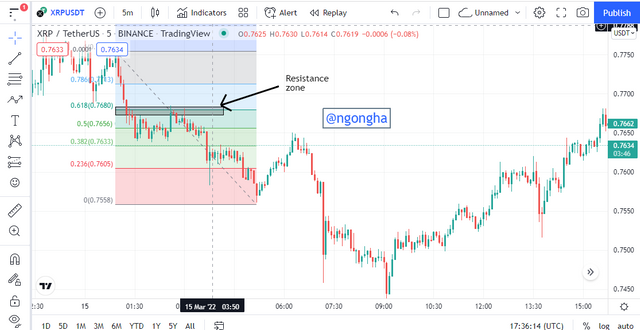
As rightly seen above, the most important thing to do here is to identify the highest and lowest points on the chart and draw the Fibonacci line linking these two. The direction depends on whether the market is bullish or bearish. We notice the 61.8% served as a suitable resistance to price action at that moment.
QUESTION 2
Explain in your own words what you mean by Fibonacci extension. Show an example with screenshot.
The Fibonacci extension refers to trading tool that is used to established targets of profits and estimating the depth to which a price travels before a pullback finishes.
As a reversal point in a trend has been identified by the Fibonacci Retracement level, this level acts as an entry. The Fibonacci extension tool is then used by traders in a way as to target profits for their orders.
Similar to the retracement levels, the Fibonacci extension includes ratio levels which act as support and resistance levels. The revelation of suitable possible price distance that travels after retracing is one of the roles of this extension tool serving as a way to anticipate profits.
In order to setup this, it is quite simple. The primary act is to identify and click on a known swing low. Next, the most recent swing high is identified and clicked. To end this, the cursor is dragged and clicked on any of the levels of retracement.
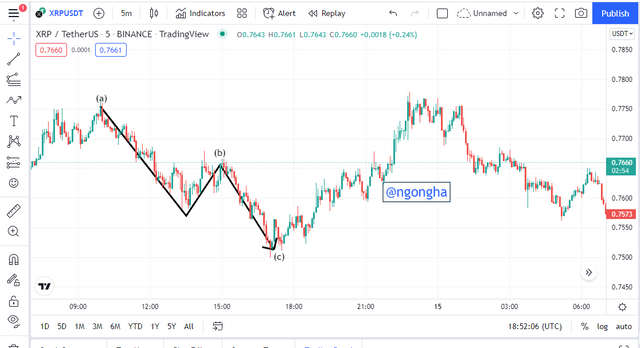
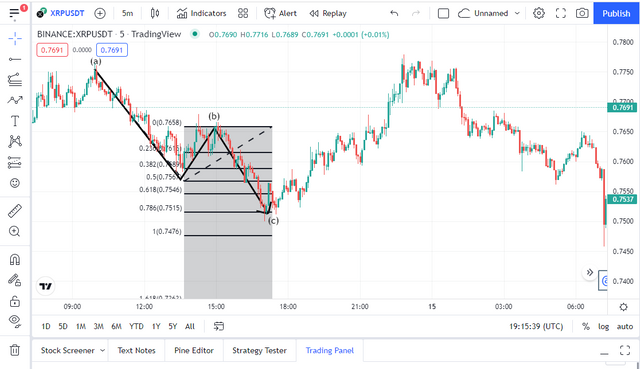
As seen above, the direction on having the Fibonacci extension tool is designated. The start of the trend has to be identified and has been called the point (a) as seen above. The end of that particular trend is designated (b) and then the end of the pullback is called the point (c). It is evident after this the levels on this tool where a pullbacks are liable to happen.
QUESTION 3
Perform the calculation of the Fibonacci retracement, for the levels of: 0.618 and 0.236. Pick a crypto pair of your choice. Show a screenshot and explain the calculation you made.
How to Calculate Fibonacci Retracement
As earlier said, drawing the retracement tool is linking the recent high and low points on the chart which are used when calculating this retracement. To calculate this, the following is taken into consideration:
RX = (X) + [(1 - (% Retrace1)/ 100) * (Y-X)]
These different parameters are expressed as follows;
X = The previous price in which the Fibonacci retracement tool starts. Also may signify the beginning of a trend.
Y = The maximum price touched before a pullback.
The major % resistances are listed below:
% Retrace 1 = 23.6%
% Retrace 2 = 38.2%
% Retrace 3 = 50%
% Retrace 4 = 61.8%
% Retrace 5 = 78.6%
Let's calculate the Fibonacci retracement for levels 0.618 and 0.236 on the BNBUSDT chart.
For the 0.618 Fibonacci level
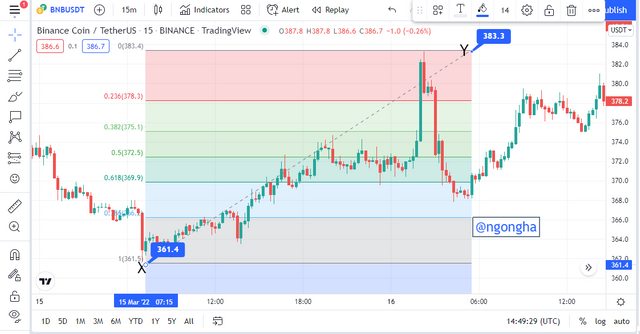
The data above will be used as such;
RX = (X) + [(1 - (% Retrace1)/ 100) * (Y-X)]
X = 361.4 USDT
Y = 383.3 USDT
RX = 361.4 + [(1-0.618) * (383.3-361.4)]
RX = 361.4 + (0.382) *(21.9)
RX = 361.4 + 8.3658
RX = 369.7658
The confirmation to this is seen below;
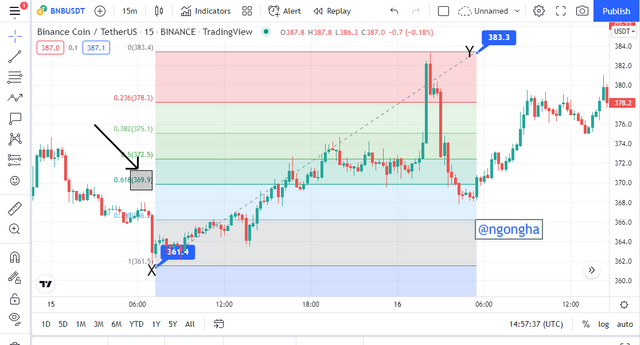
Looking at the chart above, the Fibonacci retracement at 0.618 had a price of 369.8 USDT which agrees with the calculation shown above.
For the 0.236 Fibonacci level
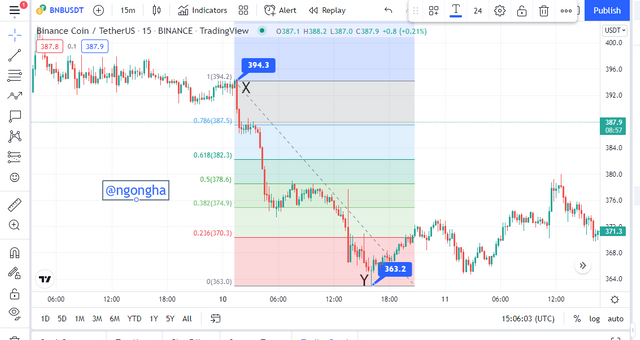
RX = (X) + [(1 - (% Retrace1)/ 100) * (Y-X)]
X = 394.3 USDT
Y = 363.2 USDT
RX = 394.3 + [(1-0.236) * (363.2-394.3)]
RX = 394.3 + (0.764) *(-31.1)
RX = 394.3 – 23.7604
RX = 370.5396
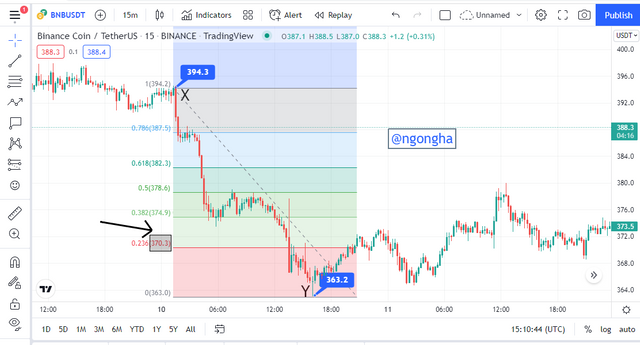
Again, looking at the chart above, the Fibonacci retracement at 0.236 had a price of 370.5 USDT which agrees with the calculation shown above.
QUESTION 4
On a Live account, trade using the Fibonacci retracement, screenshots are required
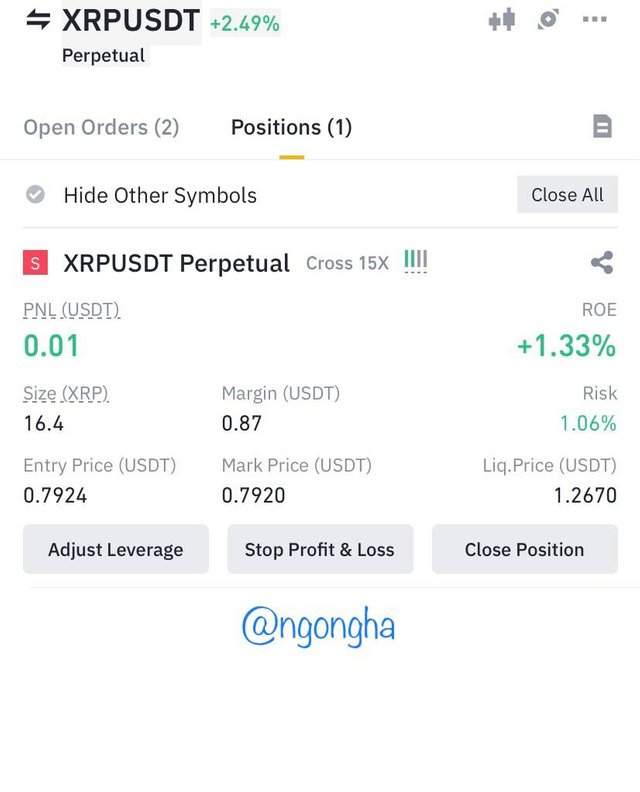
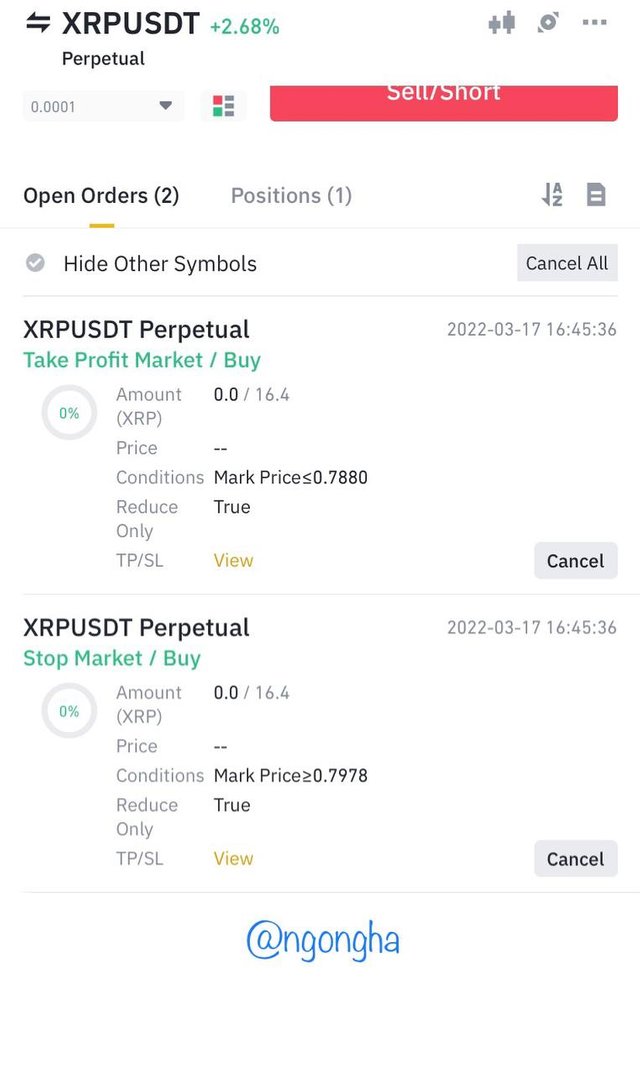
Using my verified binance account, I execute a trade using the tradingview platform for analysis.

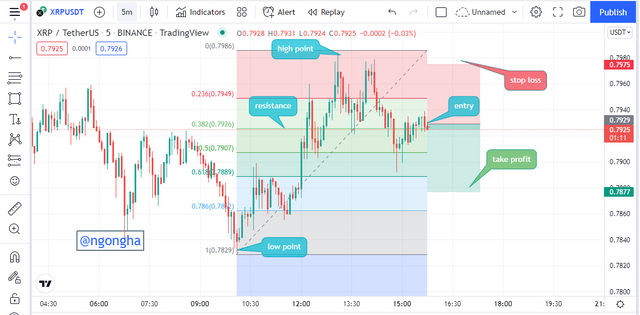
After noticing the obvious low and high points on the chart, I decided to insert the Fibonacci retracement tool which indicated the different levels of the Fibs chart which possible support and resistance levels indicated by each Fib level. To concretize this, it can be noticed that the 0.236 Fib level acts as a resistance if the chart is minimized to other smaller timeframes and looked as such.
I then waited for the prices to bounce off this level before I place my sell order as I anticipated a momentary downtrend after that. The screenshot to support this is shown below;
binance
Of course, I used the concept of stop loss and take profits setting them at $0.7975 and $0.7877 respectively, a leverage of 15x with the standard risk to reward ratio of at least 1:1.
QUESTION 5
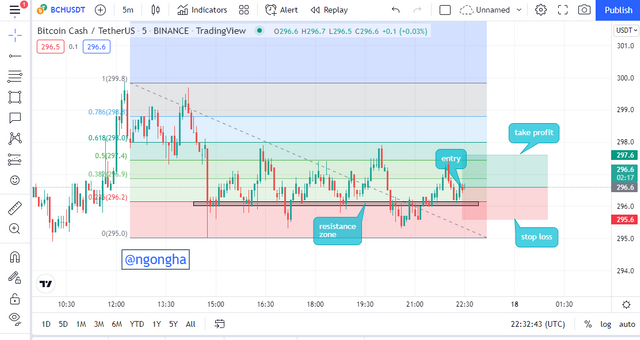
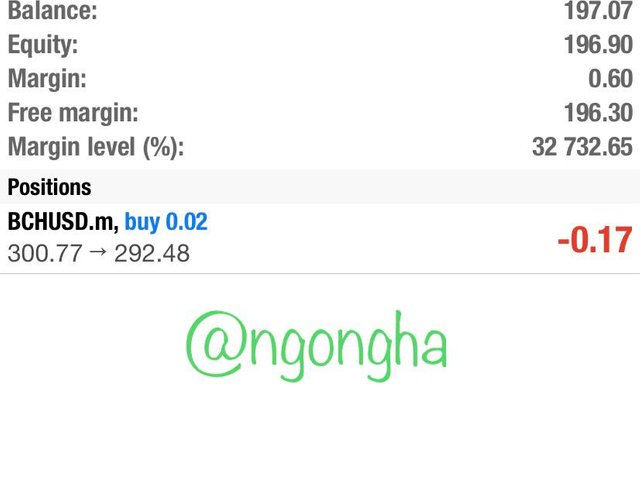
On a Demo account, make a trade operation using the Fibonacci extension. Screenshots are required.
The trade analysis is done using the tradingview platform and the trade will be run on the MT4 application.
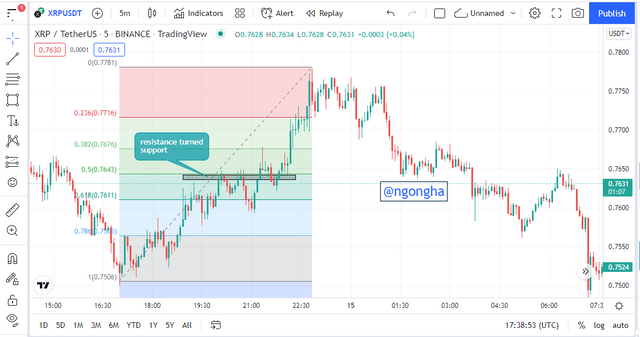
Using the BCHUSDT pair, analysis was done using the Fibonacci retracement tool to notice that the 0.236 level serves as a support. This is taken in agreement with the fact that this level, when squeezed, is noticed to act as a broken resistance or a resistance-turned-support with results indicated above.
CONCLUSION
The use of the Fibonacci in markets especially those that are trending is a very important asset for traders. This is seen as its retracement tool that identifies support and resistance levels, which is used to find suitable entry and exit positions.
Another interesting point is the use of its extension tool under Fibs which mostly generates profits under a pullback. In the market, as is the case, prices reverse at any given time. Care should be taken before entries.
THE IMAGES USED HERE WITHOUT REFERENCE ARE ALL SCREENSHOT FROM tradingview.com
I want to heartily thank Professor @pelon for this intriguing work.
CC:
@pelon