Trading using Fibonacci Retracement Levels

Trading is an art that requires possession of skills and knowledge. There are two basic analysis skills which a trader needs to possess to be able to be successful in trading. These skills they should possess are skills in technical analysis and fundamental analysis.
Acquisition of these two skills can help a person become a seasoned trader.
In this week's engagement contest, we will be discussing more about tools that will help us become experts in technical analysis. One of these tools is the indicator Fibonacci Retracement Levels. What is this indicator and how can it be useful on trading?
Join me as I use the contest tips to explore more in this subject.
Explain the concept of Fibonacci retracement as a technical analysis tool and how it is applied in crypto markets.
Fibonacci retracement is a type of technical analysis which makes use of Fibonacci number sequence used for determining resistance and support.
The ratios of this number sequence provides a basis for determining the levels at which the market retraces after a move before it continues in the direction of the original trend.
To be able to use this tool in forecasting price, the two extreme points of price on a chart is taken and used in dividing the vertical distances of the ratios.
The ratio 0% is the begining or the start of the retracement while ratio 100% is the complete retracement to where the price moved from.
There are horizontal lines usually drawn on the chart to identify ratio or price levels which indicates resistances and supports. The known levels are the 23.6%, 38.2%, 50% and 61.8% percent level. These price levels are very significant with respect to the price of an asset.
Applying this indicator in crypto markets, a trader can use it to identify important levels of the markets, places where traders can have a good price entry into the market, where to take profit and where to set their stop loss. It helps to determine resistances and supports, price area where breaks and price bounce up can occur.
Utilize Tradingview to illustrate Fibonacci retracement levels on the BTC/USDT, ETH/USDT, and STEEM/USDT pairs. (Include screenshots to showcase retracement levels during both uptrends and downtrends).
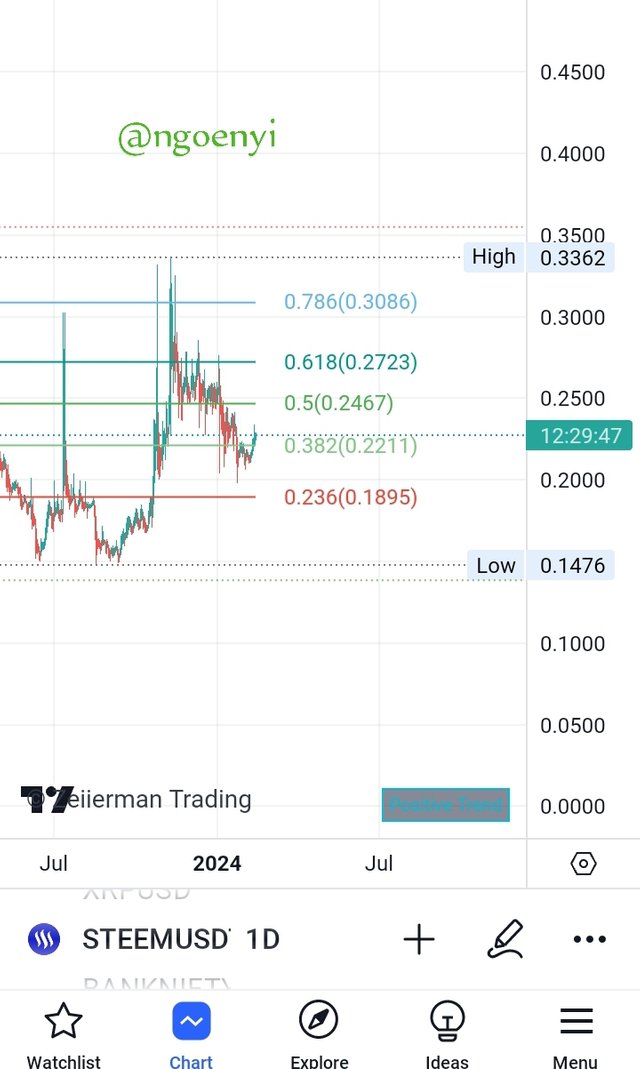
Using the steem/usdt pair to illustrate this indicator during an up trend, the following chart show thus.
From the chart above, we can see that the lowest point in price was $0.1476. the high price on the chart was $0.3362.
We can also see the different levels of fib ratio from 0.236% to 0.787%, the 100%(1%) is the high.
We can see that the price is in an uptrend. It dropped to the 0.236% region which was just above the lowest price and it is trying to buy back to the high of 0.3362.
Presently, it has crossed a significant resistance of 0.382% and is moving towards the 0.5% region. If I should take this trade, I will open a long position from here and take profit first at 0.5% region and secondly at 0.618% region before a massive pull back. These are the two major resistances for this pair.
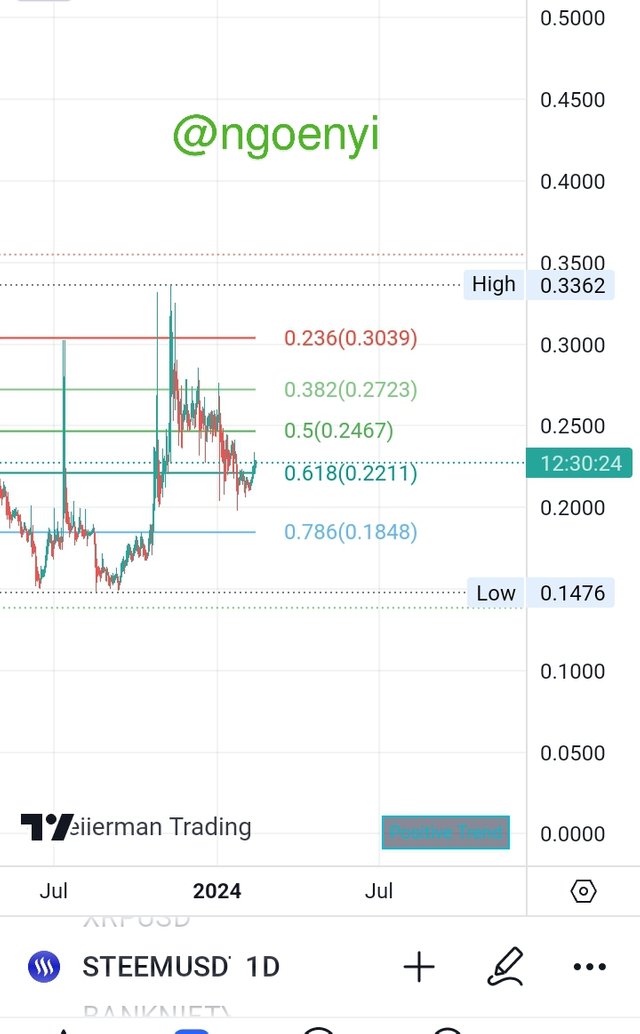
Steem/usdt Downtrend
After hitting the high at $0.3362, it came down and met the first significant support line at 0.236% Fib ratio. At this point that the 0.236% support line could not hold, is the time to enter a short trade. The first tp should be at 0.382% fib level and second tp at 0.618% fib ratio level with stop loss at slightly above the 0.236% fib level.
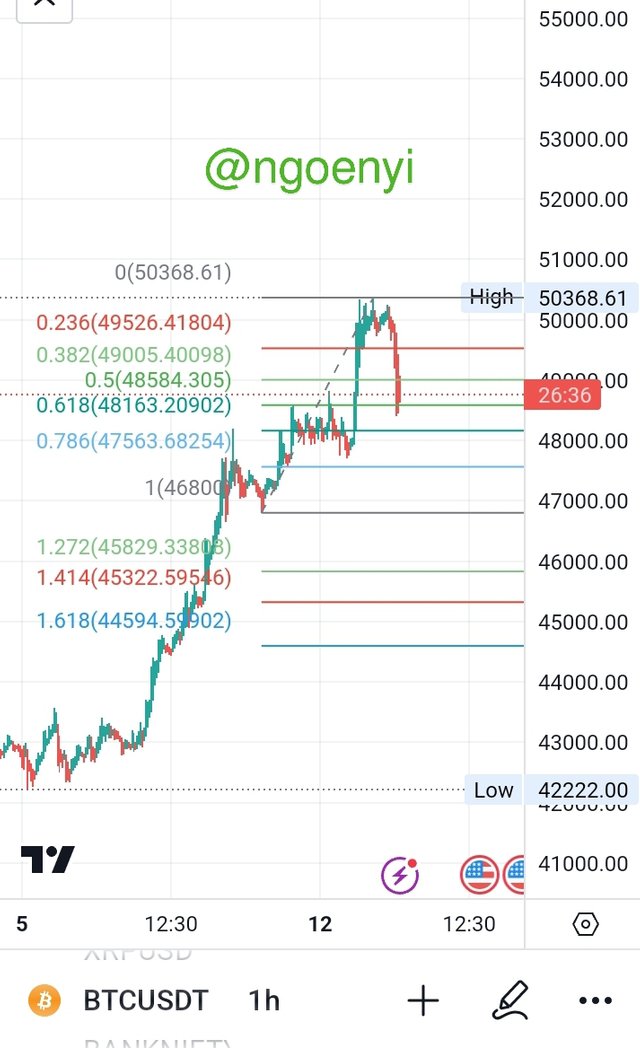
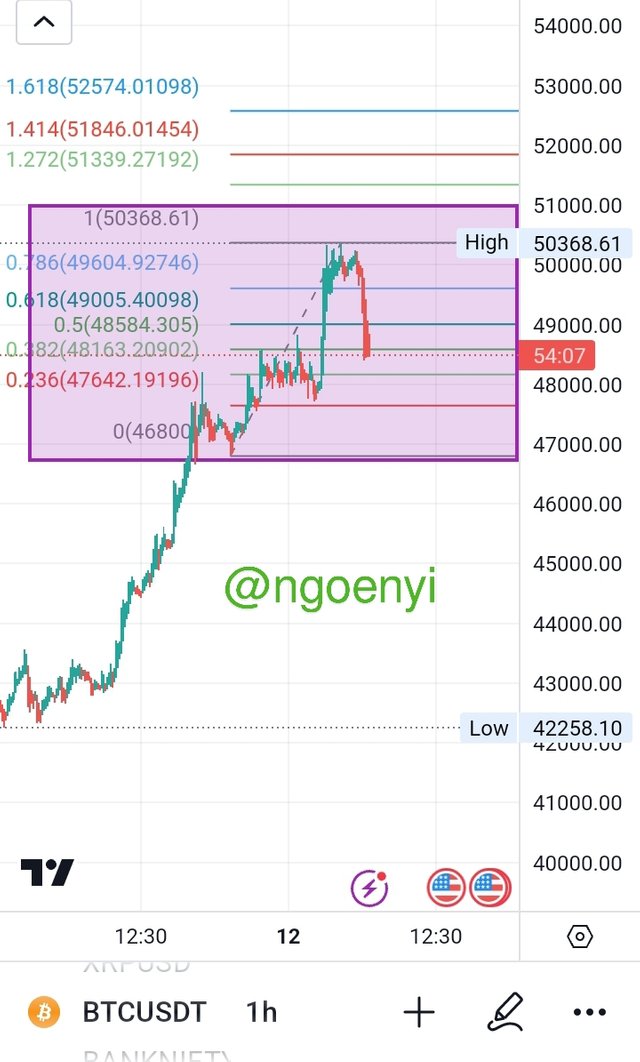
BTC/USDT 1hr Chart retracement downward
This is a chart showing retracement levels of BTC after hitting the high of $50368.61, it started retracing. The retracement was massive that it broke all the support lines and is now at $0.618 Fib ratio, which is a major support area. When it gets to 1, It means that it has achieved 100% percent retracement.
BTC/USDT 1hr Chart retracement upward
Looking at the chart, at the coloured areas, we will see that the price before it moved was at 0% level and that is $46700. It also did a double bottom to further confirm the Fib retracement indicator.
The first line of resistance was the red Fib line of 0.236%. it could not hold the upward movement, broke through and tested the 0.382% fib resistance line. We can see the accumulation that took place at that point before it finally broke the resistance and moved further up.
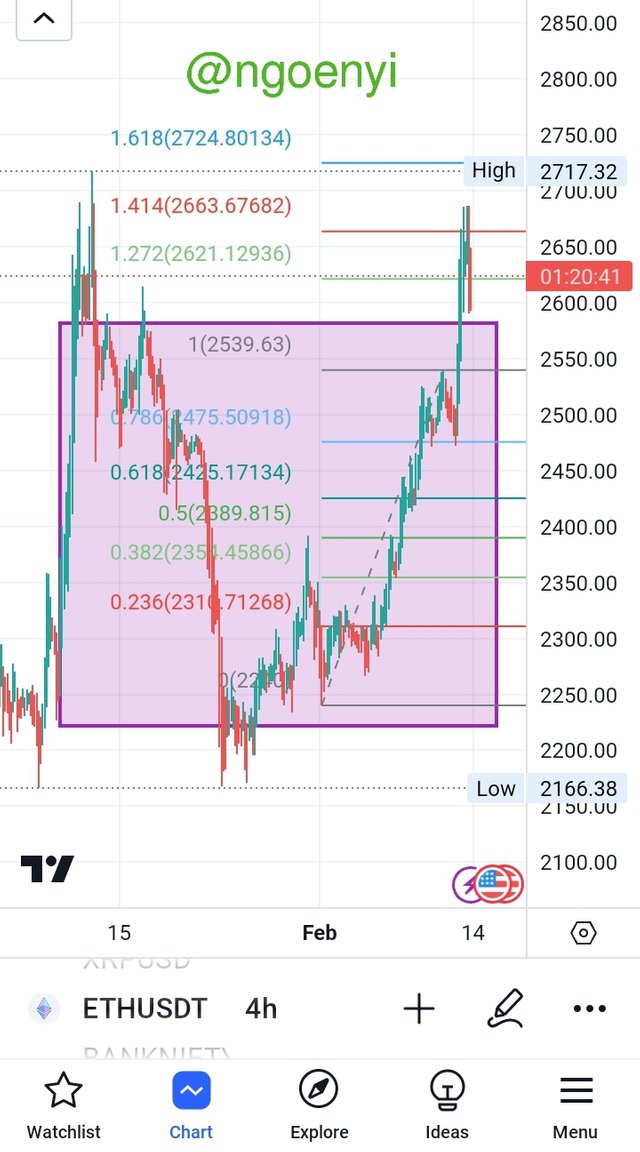
Eth/usdt uptrend retracement.
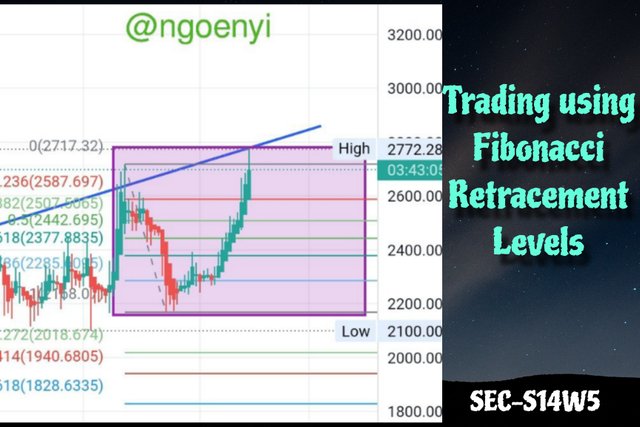
Looking at the shaded area of the chart, the price was at $2166.38 when it started moving up. It crossed the 0.236% Fibonacci line, which was the first resistance, retested the line before going up to 0.618% Fibonacci resistance line. We can see that at any Fib line that was a resistance, after crossing it, it retested it as a support line before continuing it's move up.
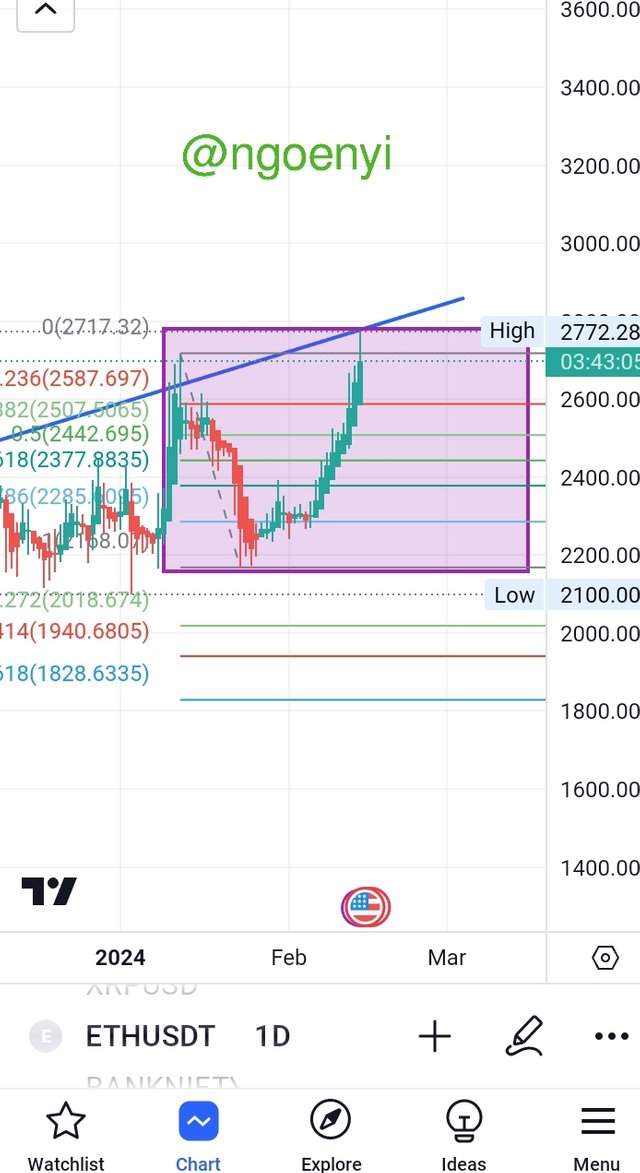
Eth/usdt downward retracement.
Looking at the shaded area from the chart above, the price is already on the high side, above 0% Fib ratio, so we are expecting downward retracement. First point of retracement will be to the 0.236% Fib ratio, which serves as the first support, if it breaks down, will be heading to the next pivotal support line, at 0.382% level. If the upward trend should continue. It should be from that level. But once it breaks below 0.382% fib ratio level, we may be targeting a complete retracement.
Break down the significance of key Fibonacci levels (e.g., 0.382, 0.500, 0.618) and explain how traders interpret these levels for potential support and resistance areas.
The Fibonacci strategy makes use of mathematical relationships between successive Fib numbers to determine potential support and resistance levels.
The levels mentioned above (0.382, 0.5, 0.618) are key significant levels in any chart. It simply means that price has moved either backwards (reversed) or forward (bounced) to that level of percentage, considering where it is coming from. It means that price will retrace or bounce to this predictable levels before continuing on its original trend.
For the traders, when a price is moving up and it touches a particular level, lets say 0.382% level. That point is a strong resistance. A trader will look out for candles using price action strategy to confirm the validity of the resistance, whether it will hold or not. Once they confirm it as a strong resistance using candle stick patterns, they will go for a short trade. An entry point have been decided.
When price breaks through the fibs ratios mentioned above, it implies that major resistances and support have been broken and that the price is ready to retrace or bounce up completely by 100%
Explore the synergy of Fibonacci retracement with other technical indicators (e.g., Moving Averages, RSI). Discuss how a combination of tools can provide a more robust analysis.
Like I have always said when it comes to indicator, they are never perfect and can be lagging sometimes. So it is always best to combine them with other tools to make them perfect.
Some other indicators like the RSI and moving averages can help in getting an accurate signal together with the Fibonacci tool.
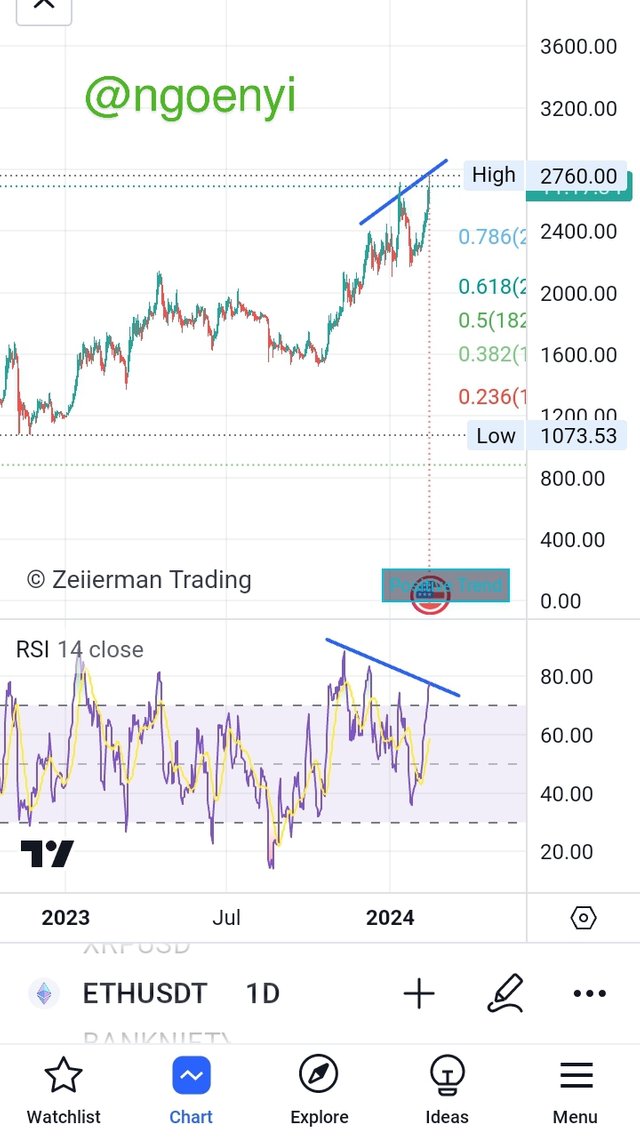
Let's look at the screenshot below
The market is in an uptrend. It seems like it has reached its limit at 100% level. Now it wants to retrace.
To further confirm the validity of the supposed retracement, I added the RSI indicator to my chart.
Using the RSI, you will notice that even though on the chart, price is still moving up, on the RSI, we are begining to see a bearish divergence. Indicating that soon, the price of this asset pair will start dropping.
Combining this, a trader can take a trade now using the support fib line of 0.78 as first take profit. Already as at the time of writing, it has started selling.
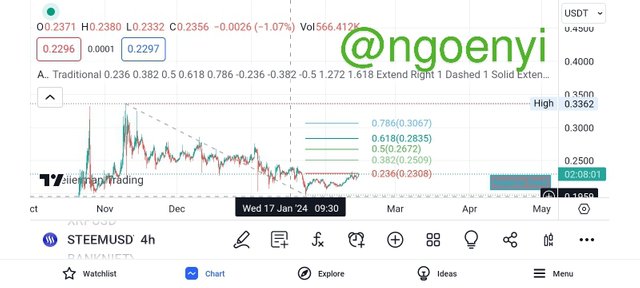
Specifically analyze the recent price action of STEEM/USDT using Fibonacci retracement.
We can observe from the chart that the pair have been on a down trend. And got to as low as $0.1940. it bounces from there and it is at 0.236% fib level. This is a strong resistance.
However, I expect the price to break through the Fib resistance level and move up to 0.618% resistance at the price of $0.2835.
So, I expect steem/usdt pair price to bounce back to $0.28 in the coming days.
Conclusion
The Fibonacci entrancement level is an interesting tool for trading. Most times, the market obeys these Fib ratios to the later, making it a tool traders can trust.
However, it is always best to combine it's usage with other indicators to validate it's claims or signal
Thank you all for reading through. @sahmie, @drqamu, @shahid2030 @yancar, please come and take part in this contest. Success in advance to you all!
Note that all screenshots where taken from tradingview.com
This is my introductory post here
Fibonacci retracement levels can be useful tools for identifying potential support and resistance levels in trading, aiding in decision-making and risk management. Traders can enhance their technical analysis stretegies. Best wishes for you in Future.
Fib retracement is a very useful tool if a trader masters it well. It can actually help with risk management during trading.
You have provided a clear and concise overview of the Fibonacci strategy in trading. Understanding key Fibonacci ratios like 0.382, 0.5, and 0.618 can be really instrumental in identifying support and resistance levels. Your overall analysis on this topic was top-notch!
Thank you for making out time to go through my post. It is really inspiring to see you comment wonderfully. Really appreciated.
Learning both technical and fundamental analysis skills is like having two useful tools for trading. It's key to becoming a skilled trader. Fundamental analysis makes one a good investor while technical analyse makes a good trader.
I understood it as when we want to predict prices using the Fibonacci tool, you pick the highest and lowest points on a chart. It helps to figure out different levels and make better forecasts. That's perfect and simple explanation of it .
The Fibonacci retracement tool is pretty cool for trading. Usually, the market follows the Fibonacci ratios well, so traders find it reliable. But it's smart to use it along with other tools for the best results because there is no single fool proof tool in the market . As small hands in the market , we have to follow , we cannot manipulate the market unlike institutions.
Thanks and good luck .
Thanks for going through my post. Just like you sis, there is no tool that is fool proof. Best to work together with other indicators.
Hello dear, greetings to you. I hope you are enjoying the sweet moments of your life.
You said Trading is an art that requires possession of skills and knowledge. Yes very true. Even this requires a too much experience and expertise. Fibonacci retracement is a type of technical analysis which makes use of Fibonacci number sequence used for determining resistance and support. Yeah that perfect about Fibonacci. It shows us the support and resistance levels with the golden ratio; 0.38, 0.5, 0.61.
The graphs shows the perfect data for all the three pairs. You have shown beautifully how to use Fibonacci retracement for our analysis. Yes that's true too we should use technical analysis tools in combination. It makes our trade more correct and accurate if we have more confirmation.
By the way thank you so much for your precious invitation dear friend.
Wish you best of luck in the contest, keep blessing.
Dear friend
Great to see you commenting on my article. For sure this FIB tool is good to work with. But its best comes from using it along with other tools.
Thanks for.yoir kind wishes.
Saludos hermosa amiga, gracias por la invitación, ahorita estoy un poco alejado, mis responsabilidades no me permitieron participar esta semana.
Magistral tu participación, me encanto, una clase maestra sobre los retrocesos de fibonnachi.
Éxitos y muchas bendiciones.
Dear friend
Thank you for your compliments and insightful comment.
I will really miss your work this week.
Thank you, friend!


I'm @steem.history, who is steem witness.
Thank you for witnessvoting for me.
please click it!
(Go to https://steemit.com/~witnesses and type fbslo at the bottom of the page)
The weight is reduced because of the lack of Voting Power. If you vote for me as a witness, you can get my little vote.
https://twitter.com/Celina58042963/status/1757953703204528184?t=DfOEgfDol2sJTsJEYnBd2w&s=19
TEAM 1
Congratulations! This post has been upvoted through steemcurator04. We support quality posts , good comments anywhere and any tags.Upvoted. Thank You for sending some of your rewards to @null. It will make Steem stronger.