Trading Crypto with On-Balance Volume Indicator - Crypto Academy / S5W4 - Homework Post for @fredquantum.

Hello my good friends, hope we are having a wonderful week and welcome back to another week of steemit crypto academy. I will be writing on the homework task of @fredquantum who thrilled us on the topic Trading Crypto with On-Balance Volume Indicator

In your own words, explain your understanding of On-Balance Volume (OBV) Indicator.
The On-Balance Volume Indicato(OBV) is one of the indicator used in trading. It was originated or founded by Joseph Granville in the year 1963. It is a momentum indicator engaged in techincal analysis and precisely used for determining the price direction of an asset which is caused by the volume added to it whether it be buying or selling.
Mr Joseph postulated that when volume of any asset is increased or decreased in the market, this have a direct effect on the price direction of the asset.
When the purchase volume of the asset is high in the market, this shows that there many traders buying the asset which will in turn cause the price to shoot upwards. This will be shown on the charts as a group of successive higher highs and higher low.
Similarly, there are many sell off volume for that particular asset by traders, the price of the asset will move downwards, clearly shown on the chart by consecutive lower highs and lower lows.
Thus we can say that volume is directly proportional to price. So using the OBV indicator, traders can be able to discern the next direction of the price, pick out possible breakouts in the market and identify divergences on the charts which is an indication of a possible reversal in trend.
Using any charting platform of choice, add On-Balance Volume on the crypto chart. (Screenshots required).
To add the On-Balance Volume to my trading chart, we need to follow the following procedure.
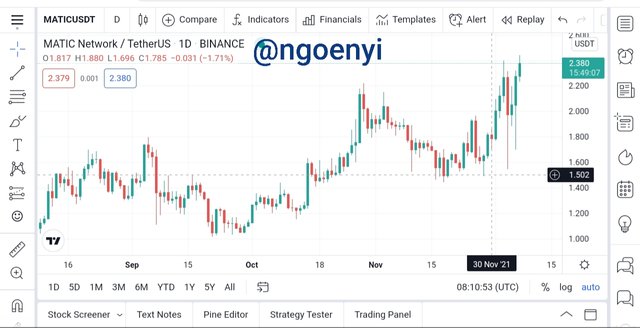
● Open the trading platform you want to use, for the purpose of this home work, I am using the tradingview platform and have selected the chart of MATICUSDT.
● click on fx menu on the menu bar which is the indicator menu icon.
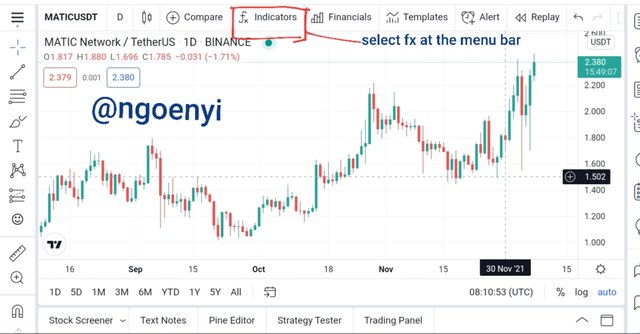
Adding indicator to the chart
● When the dialogue box opens, type OBV on the search bar and select the one marked or highlighted.
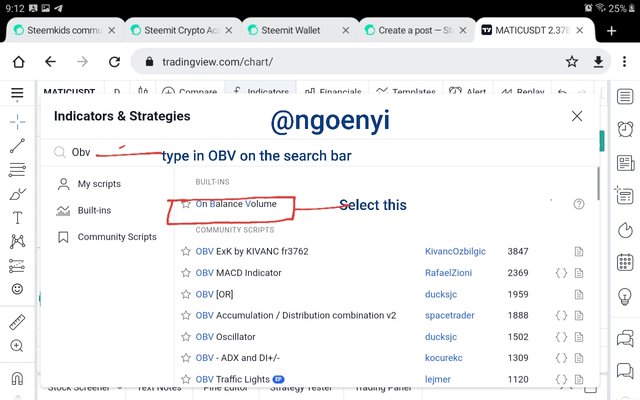
Selecting OBV for adding to the chart
● It will then show on your chart as seen below.
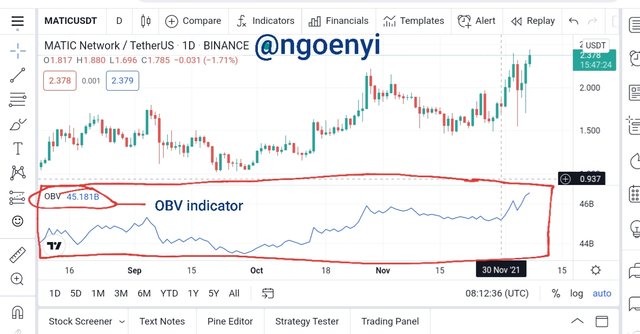
OBV indicator added to the chart
This is how to add the OBV indicator on the chart.
What are the Formulas and Rules for calculating On-Balance Indicator? Give an illustrative example.
There are three possible ways of calculating the OBV. Whichever method we choose is dependent on the closing price of the asset that is being traded.
■ Formula 1 = OBV = previous OBV + Current volume
This formula is used when the closing price of the asset is higher than the previous days closing price of the asset.
■ Formula 2 = OBV = previous OBV + 0
This is used when the closing price of the asset is the same with the previous days closing price.
■ Formula 3 = OBV = previous OBV - Current Volume
This is used when the closing price of the asset is lower than the previous days closing price of the asset.
To illustrate this, I am going to use the table below
| Days | closing price $ | daily volume | formula used | OBV |
|---|---|---|---|---|
| Monday | 80 | 20000 | ----- | 20000 |
| Tuesday | 100 | 16000 | formula 1(add) | 36000 |
| Wednesday | 96 | 12000 | formula 3(subtract) | 24000 |
| Thursday | 96 | 10000 | formula 2 | 24000 |
For Tuesday, the previous OBV is = 20000,
The closing price was = $100.
Since the present closing price is higher than the previous closing of $80, we will use the formula
Formula 1 = OBV = previous OBV + Current volume
Applying the figures
OBV = 20000 + 16000
OBV = 36000.
For Wednesday,
The precious OBV is = 36000
Current volume = 12000
Closing price is = 96
Since the current closing price is lower than the previous days closing price, we will use the third formula
Formula 3 = OBV = previous OBV - Current Volume
OBV = 36000 - 12000
OBV = 24000
For Thursday, the previous OBV = 24000
Closing price = 96
Current volume = 10000
Since the closing price is the as the previous days closing price, we will use formula 2
Formula 2 = OBV = previous OBV + 0
OBV = 24000 + 0
OBV = 24000
What is Trend Confirmation using On-Balance Volume Indicator? Show it on the crypto charts in both bullish and bearish directions. (Screenshots required).
OBV indicator can be used to confirm a trend. As I have earlier mentioned, the movement of the OBV line which is caused as a result of the volume added or removed in the asset determines the price direction of the asset.
For a bullish trend, the OBV confirms it with a series of higher highs and higher lows. Thus indicating a strong upward trend. This can be seen from the chart below.
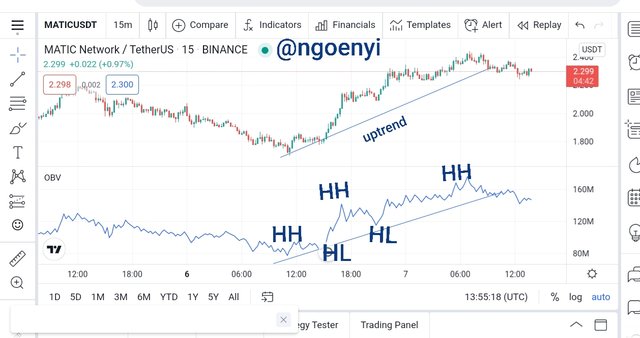
bullish trend confirmation
From the chart above, we can observe that after forming the swing high, we started seeing consecut8ve higher h8ghs and higher lows. This is a confirmation of the uptrend by the OBV indicator
For a bearish trend, we can also use the OBV indicator to confirm it. There will be in obvious sight a series of lower lows and lower highs to confirm the downtrend.
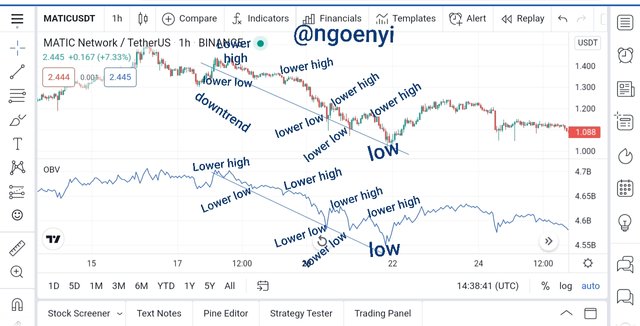
bearish trend confirmation
,You can also observe from the chart that the downtrend was confirmed by the OBV with consecutive lower highs and lower lows.
It is confirmed that the OBV indicator can be used to confirm trend movements.
What's your understanding of Breakout Confirmation with On-Balance Volume Indicator? Show it on crypto charts, both bullish and bearish breakouts (Screenshots required).
The OBV indicator can also be used to confirm a breakout in a ranging market. When there is a ranging msrket price moves within a resistance and support range for some time. At that point there is no confirmed trend in the market.
However, when there is a breakout, in either direction it is accompanied by increased volume of trade that is identifiable in the OBV indicator. This helps a trader to know whether to enter the trade or exit from his position.
Let us look at the chart below.
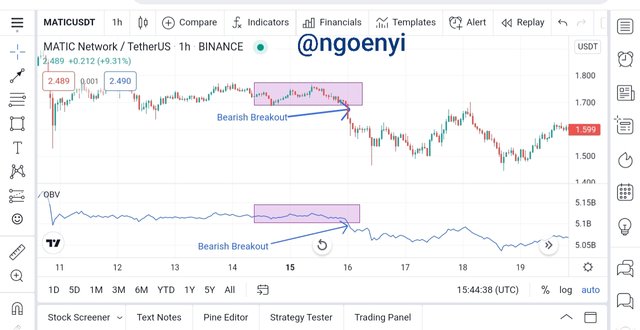
bearish breakout
From the chart above, we can observe that the market is in a ranging state, the price have been locked in with a particular support and resistance level. This ranging or consolidation was also confirmed by the OBV indicator.
However when the breakout occurred, undermining the support , which is an indication of a heavy sell off volume, the asset price went down leading to a downtrend. This bearish breakout was also confirmed by the OBV indicator as show in the chart above. This validates the breakout, Which created an opportunity for traders to take their own decision.
For a bullish breakout and such validation by the OBV indicator, let us look at the chart below.
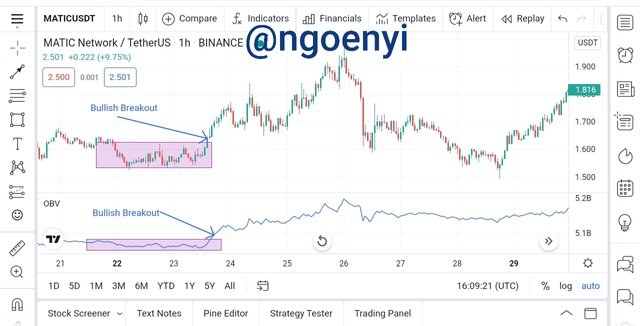
bullish breakout
From the chart above, we noticed that for some time, the market was in a consolidation phase. This was also confirmed by the OBV indicator. However, as the price broke the resistance and started an uptrend, we also saw the validation by the OBV which is due to increase in volume as a result of purchase of the asset.
Thus, the OBV indicator can be used for Breakout Confirmation.
Explain Advanced Breakout with On-Balance Volume Indicator. Show it on crypto charts for both bullish and bearish. (Screenshots required).
Advanced breakout occurs when price have not be able to go beyond a previous high or low, but on the OBV indicator, price have already broken through the previous high or low. This happens before the actual price crosses those previous high or low. This advance breakout enables the trader to take his position before price gets to that point.
For bullish advanced breakout.
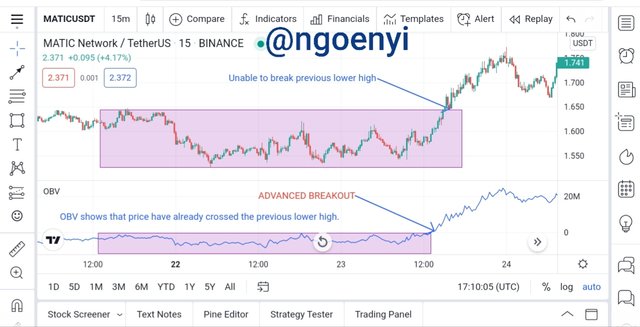
bullish advanced breakout
We can see the points marked in the chart for both the price and the OBV indicator. On the price chart, the price have not been able to cross the previous lower high, but when checked correspondingly at the same point on the OBV indicator, we can observe that previous lower high have been broken and crossed. This indicate an advanced breakout, a signal that the price of the asset would still push up further. Thus the trader can enter a buy position early and take advantage of the price upward move.
For Bearish advanced breakout, see the chart below.
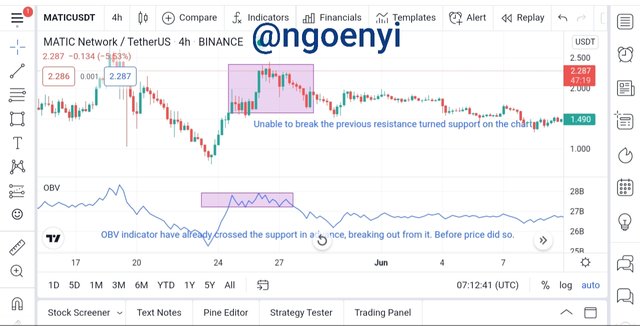
bearish advanced breakout
From the chart above, we will observe the boxed areas on the chart and the OBV indicator. On the price chart, price have not crossed that support, but have already done so on the OBV indicator. Telling the traders ahead of time that the price will breach that support and still go downwards.
So advanced breakout signaled by the OBV indicator can be very useful and advantageous to the trader.
Explain Bullish Divergence and Bearish Divergence with On-Balance Volume Indicator. Show both on charts. (Screenshots required).
A divergence is a condition that occurs in the market where the market would be going in a particular direction whereas, the indicator would be pointing in an opposite direction.
A bearish divergence occurs during an uptrend when the price producing series of higher highs , but on the OBV indicator volume, it is producing a series of lower highs. So both are not in the same upward movement. Once this is observed, it is an indication that the uptrend is weakening and a reversal will soon take place.
This can seen in the chart below.
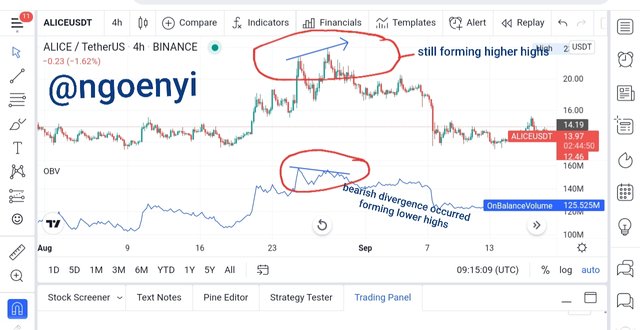
bearish divergence
From the chart above, we will notice that as the asset price was still moving upwards, the OBV indicator was pointing downwards. This signifies a weakness in the uptrend thus signaling that the trend is about to change.
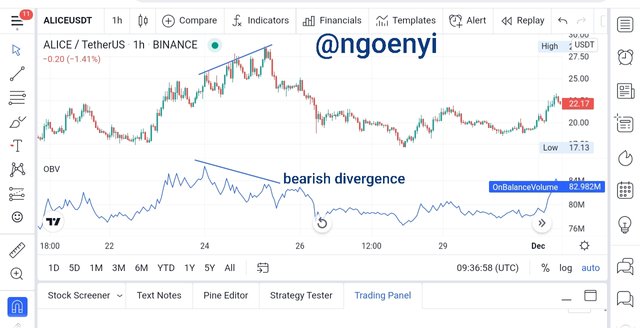
For a bullish divergence, the asset price is already on a downtrend. However as the price forms lower highs on the chart, OBV indicator is moving the opposite direction forming swing highs.
Let us look at the chart below.
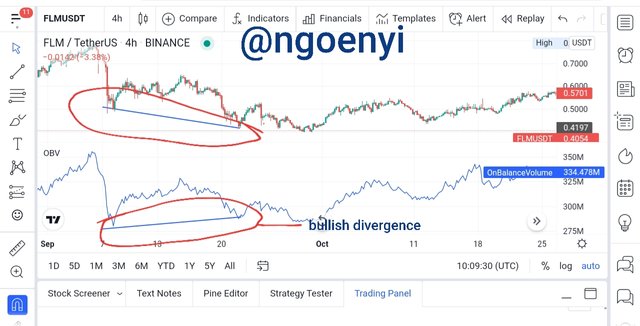
bullish divergence
From the chart, we can notice that as the pric3 was moving downwards, the OBV indicator is pointing upwards. This is an indication of a weakness in the downtrend. This implies that soonest, the will be a trend reversal, thus trader needs to be ready to take advantage early.
Confirm a clear trend using the OBV indicator and combine another indicator of choice with it. Use the market structure to place at least two trades (one buy and one sell) through a demo account with proper trade management. (Screenshots required).
I am going to demonstrate an entry both for a buy and sell position. To help me enter the market profitably, I am using the OBV indicator along with the Alligator indicator.
For a sell entry position setup, kind see the chart below.
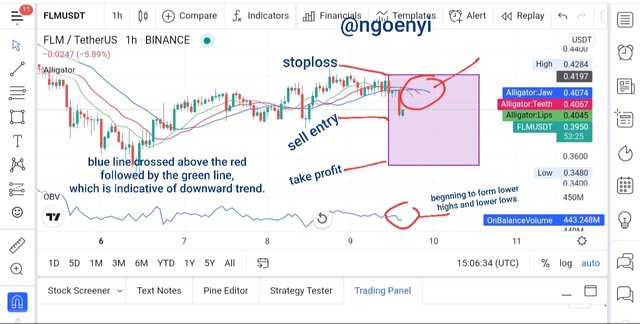
Sell entry trade setup with OBV and Alligator Indicator
From the chart above and the sell entry setup, we will observe that the OBV is starting to form a series of lower highs and lower lows. This is confirmed by the Alligator indicator. The Jaw(blue line) is on top of the red line and then the green line. This shows that the Alligator has opened its mouth to eat massively.
Limit sell Entry: 0.3901
Take profit: 0.3520
Stoploss: 0.4208
This trade was taken on a risk to reward ratio of at least 1:1
For a buy entry position, both indicators where also combined get the setup. Let us look the chart below.
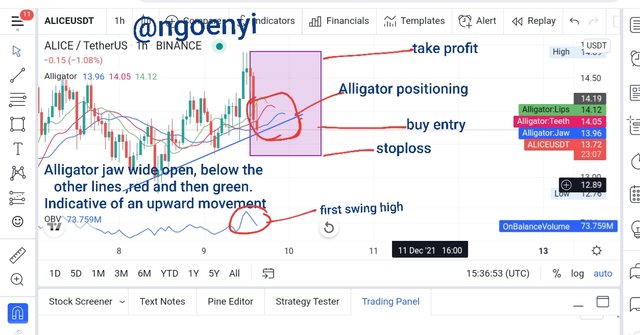
Buy entry trade setup with OBV and Alligator Indicator
From the chart above, we will observe that there was a swing high shown by the OBV indicator, this was further confirmed by the Alligator, which had its jaws open to eat massively. Additionally, we can also see the trendline, thus confirming the upward movement.
The buy limit entry is set at: 13.70
Take profit: 14.39
Stoploss: 13.35.
Exit points were put in place for effective trade management. The trade was set at a risk to reward ratio of at least 1:2.
What are the advantages and disadvantages of On-Balance Volume Indicator?
Advantages
● On-Balance Volume indicator is very easy to use.
● It provides a signal for potential breakout i either side of the chart, whether upwards or downward. It also helps identify when the market is ranging.
● The OBV indicator can be used to identify and confirm trend directions
● It provides traders with an opportunity to identify divergences and trade profitably with it.
Disadvantages
■ A quick paced movement like a spike can lead the OBV to also spike. This might be caused by a news or announcement from the asset company and not necessarily because of volume.
■ The OBV indicator does not indicate the degree of price movement.
■ The Indicator only takes into cognisance the volume in its price action analysis. This is not good as there are all other factors that affect price action.
■ The OBV indicator does not work well in smaller time frame due to high price volatility. So it might give misleading signals.
■ It works best when used together with other indicators.
■ It is susceptible to price manipulation.
Conclusion
It has been a great week learning from @fredqauntum about the On-balance Volume indicator. This is another great knowledge of an indicator added to my pool of knowledge.
I have learned how to use this indicator to pick trading signals which I will use for more profitability. This indicator can be used to identify potential trend, breakouts form either side of the price chart and confirm trends too.
OBV can be used too with other indicator which brings out the best in it.
Once more, I will say thank you for such wonderful lecture.