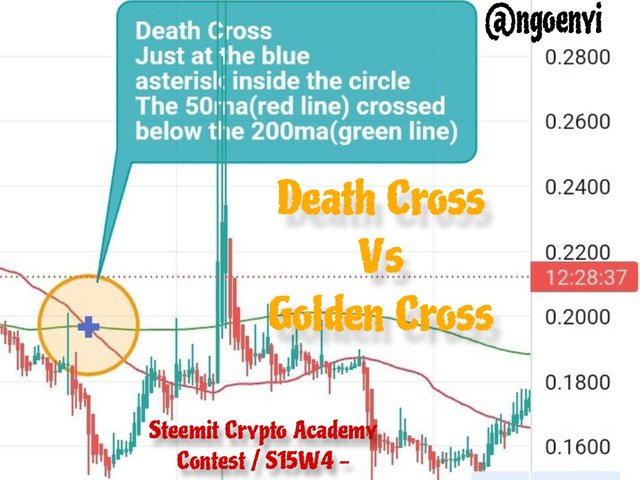
Steemit Crypto Academy Contest / S15W4 - Death Cross Vs Golden Cross.

It is another beautiful day in steemit crypto engagement contest. This week we are writing about indicators. With specific reference to how it is combined as a pattern to read through charts.
The two chart patterns we will be discussing are the Golden Cross and the Death Cross.
What are these and how do we set it up on the chart?
This will be explained using the contest tips outlined for it.
Explain in your own words, what is the golden crossing and what is the crossing of death?
Death Cross
I will start first with the death cross. This is a technical indicator that occurs whenever a short moving average crosses below a long moving average (MA). For example, in a chart, I added two moving averages, 50MaA and 200MA, giving the lines two different colours. The point at which the 50MA line crosses and stays below the 200MA line, it is said that a Death Cross has occurred.
When this happens it signals a shift from a bullish trend to a bearish trend. For many traders, once this pattern is seen, it is a time to short the asset or sell it off.
The death cross happens in 3 phases. First, the asset price reaches its peak or high. Secondly, the price retraces and starts coming down, this is where the actual death cross occurs. Then the last stage is the continuous decline in price of the asset.
Golden Cross
The other one is the Golden Cross.
This is simply the opposite of the death cross. Just like the death cross happens in relation to a reversal to a bearish trend, the Golden Cross has to do with a reversal to a bullish trend.
This occurs when the short moving average 50MA crosses and stays above the long moving average 200MA on the chart. When that is seen, a golden cross has occured.
Whenever asset traders see this Golden Cross pattern on the chart, it signals that a strong bullish market is coming.
In the next question, I will show us a sample of both the golden cross and the death cross.
Use the BTC/USDT pair to show the golden crossover and the crossover of death, in tradingview. Also use the STEEM/USDT pair to show the golden cross and the death cross. Screenshots are required
I will be using the chart of BTC/USDT to illustrate both chart patterns.
DEATH CROSS
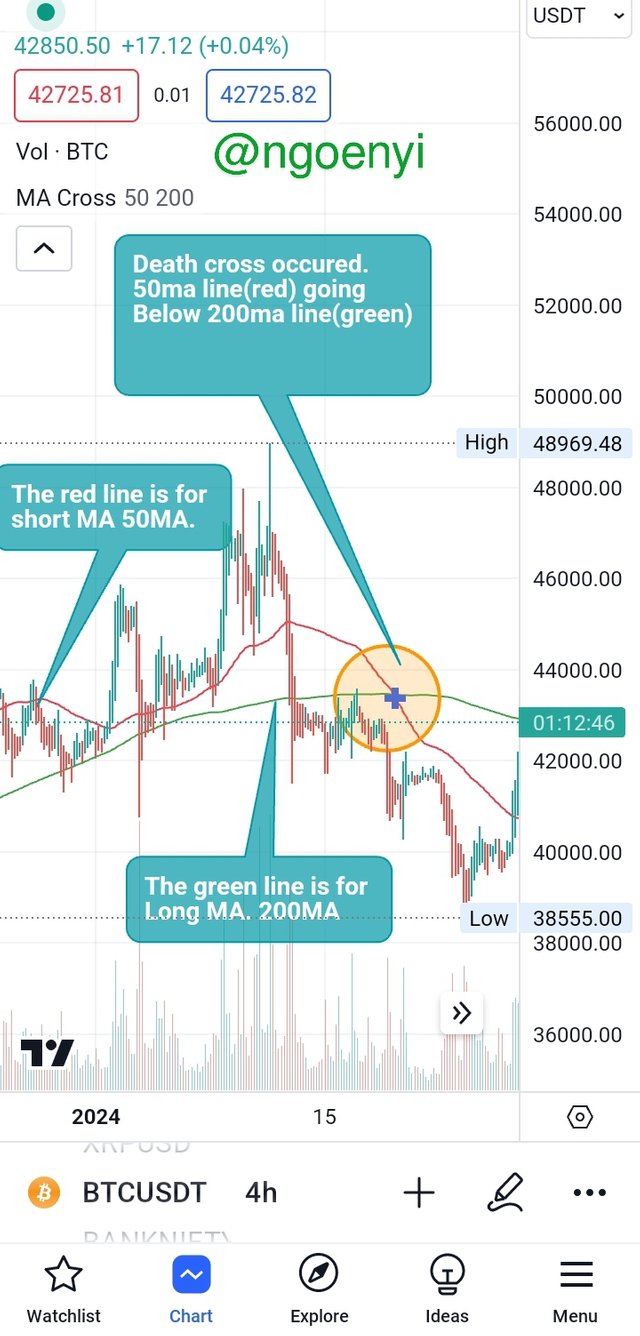
The chart above shows an example of the Death Cross using BTC/USDT on 4 hour timeframe. The short moving average, 50ma is the red line on the chart while the long moving average, 200ma is the green line. The Death Cross occured at the area that was circled, you can see the blue asterisks shown on the circle. That was where the death cross occurred.
Hence we can observe that after that cross, this asset pair sold off heavily confirming the bearish signal of the death cross.
GOLDEN CROSS
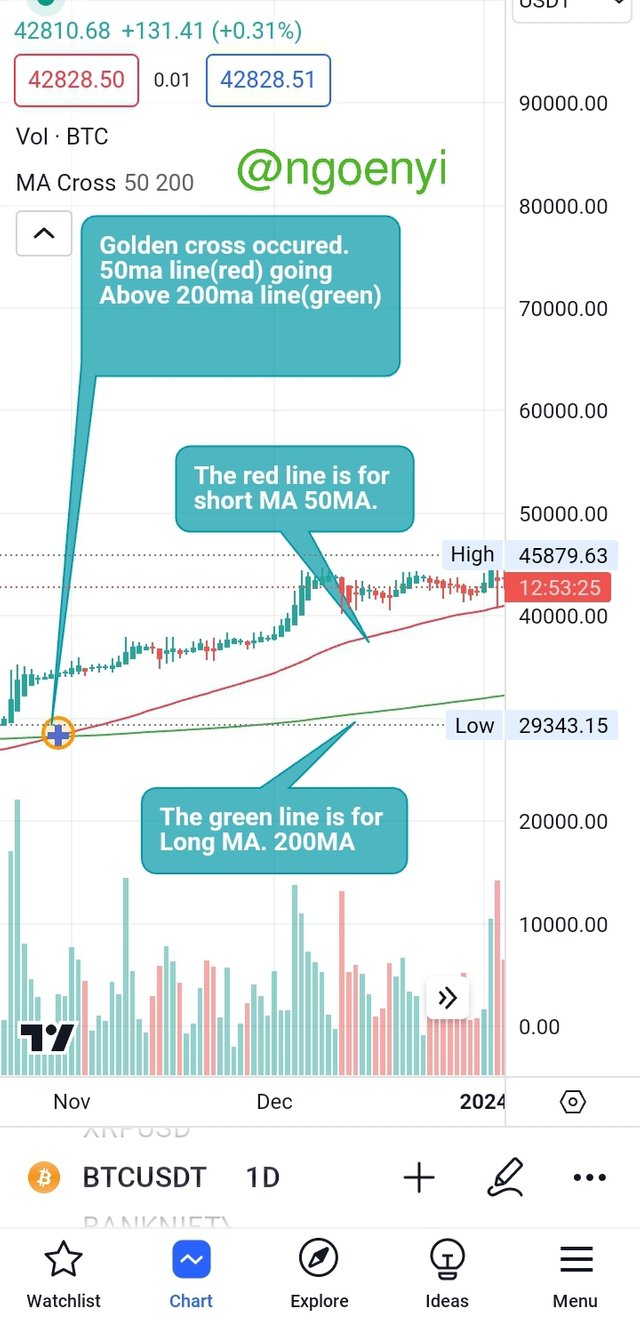
From the screenshot above, we noticed the circled area with the blue asterisk. That was the place the Golden Cross took place, when the short Ma (50ma) crossed above the long MA 200ma. Since then this asset pair have been bullish. Such crossing above the long MA is an indication of a bullish momentum.
Using the STEEM/USDT chart to show the Golden and death cross.
Golden Cross*
I am using the chart of STEEM/USDT 1 day timeframe to show a Golden Cross.
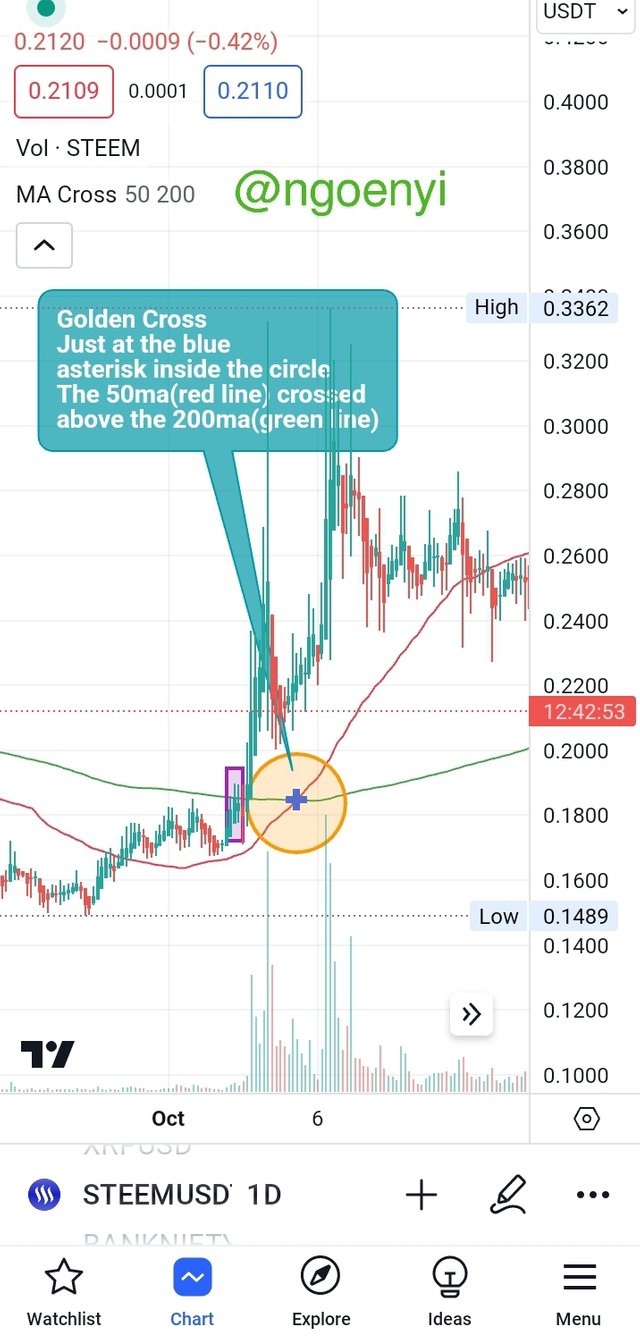
The arrow shows where the golden cross took place and the red line of the short moving average crossed the long moving average, indicative of a bullish momentum or signal.
Death Cross
Using the same 1 day timeframe of STEEMUSDT chart, the Death Cross is shown below.
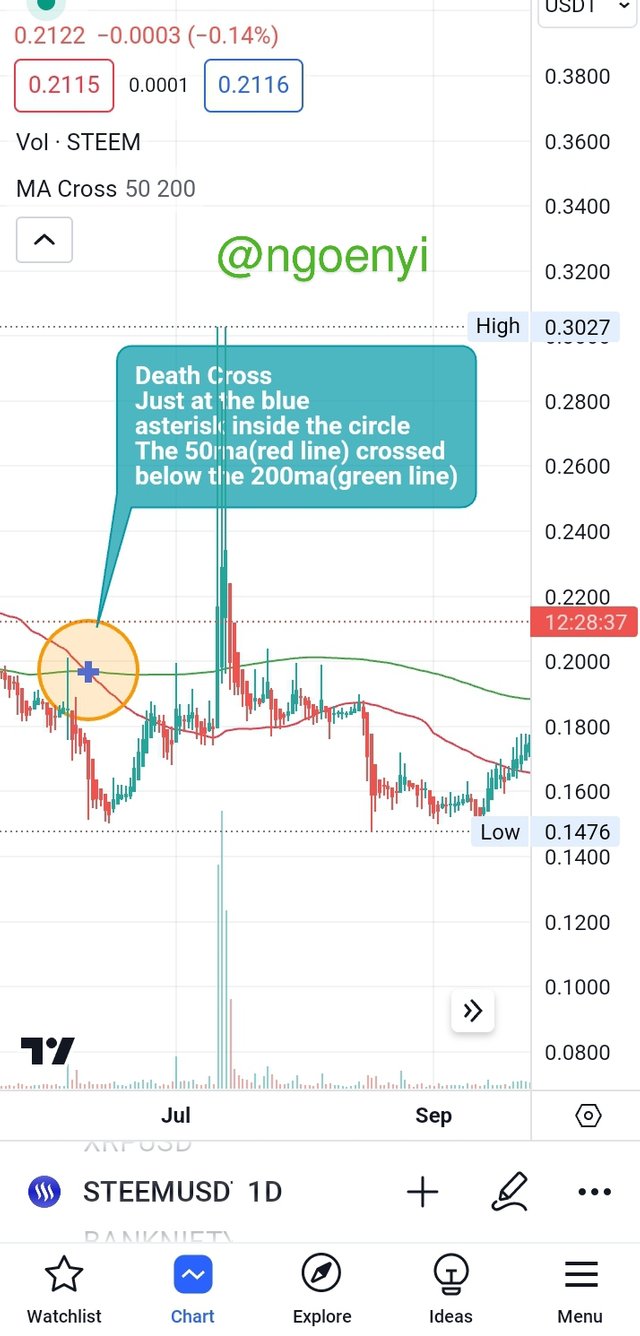
From the chart above, we can see where the Death cross took place. The 50ma line crossed and went below the 200ma line. Hence a sell off continued for quite some days.
What is the difference between the golden crossover and the death crossover?
| Golden Cross | Death Cross |
|---|---|
| The Golden Cross is indicative of a bullish signal or momentum | The Death Cross is indicative of a bearish momentum or bearish signal. |
| The short moving average will cross above the long moving average when it occurs and maintains that tempo | the short moving averages crosses below the long moving averages and stays below it. |
| This causes the prices of the asset to go up much higher | it causes the price of the asset to decline. |
| When the golden Cross occurs, the long moving averages line serves as a strong support | When the death cross occurs, the long moving average line serves as a strong resistance. |
In addition to these two chartist patterns, what other indicator would you add to make the technical analysis more effective at the moment of making a decision.
Just like most indicators, the chart patterns of death cross and golden cross are lagging indicators. The market would have been in that direction for some time before the crosses occurs.
To help out on this, there are other indicators that could be used to make its signal more accurate.
One of these indicators is the Relative Strength Index. This is a momentum oscillator which measures the speed and rate of change in price of an asset pair.
It usually moves between the range of zero and 100. If the RSI gets to 70 and above, it simply means that the asset is overbought but when it is 30 and below, it means that the asset is oversold. With RSI, a trader can lookout for divergences to spot an early trade or signal.
So when used in conjunction with the death cross and golden cross, it helps to create a signal faster than using only them.
Now let us see an example of how the Rsi can enable a trader make early profits even before the golden and death cross occurs.
This example is for golden cross. Let us look at the chart below.
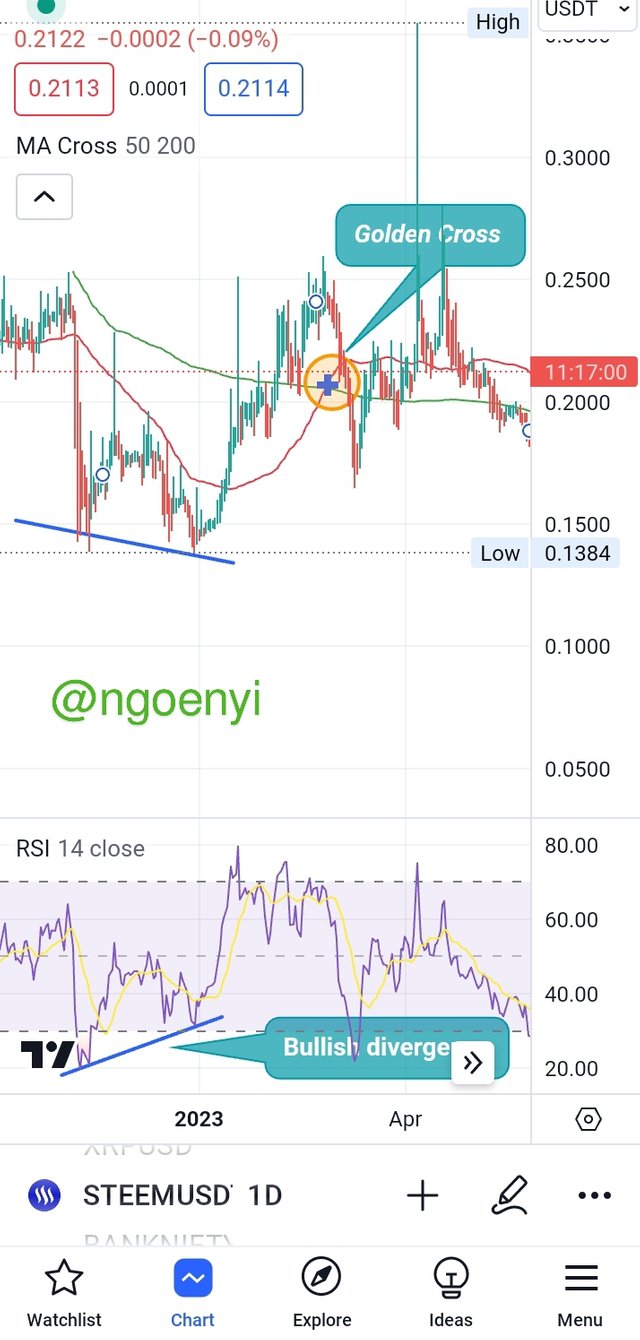
From the chart above, we will notice where the golden cross occured. But the Rsi have long shown that bullish momentum or signal with its bullish divergence.
A trader aware of this rsi divergence would have entered the trade from there long before the golden Cross occured. He would now be expecting the golden cross to occur while already in profit from the signal generated by the Rsi.
So using the rsi indicator would be a big boost to any who trade with the golden cross and death cross. The trader will be able to spot signals faster.
Conclusion
The death cross and golden cross are chart patterns that can be used by traders. When used appropriately, it can enhance a traders profitability. However, to get the best out of it, it must be used in conjunction with other indicators like rsi.
Thank you all for reading through. @starchris, @steemdoctor1, @sahmie @yancar, please come and take part in this contest. Success in advance to you all!
This is my introductory post here
Greetings friend,
I wanted to let you know that your explanations of the golden cross and death cross are absolutely fantastic. They're concise and super easy to understand, which is awesome. I really appreciate how you included screenshots from TradingView to illustrate both the golden and death crosses for the BTC/USDT and STEEM/USDT pairs. It really helps to visualize the concepts and enhances the clarity of your explanations.
And I must say, bringing in the Relative Strength Index (RSI) as an additional indicator shows your deep understanding of the importance of using complementary tools in technical analysis. It's great to see how RSI can work hand in hand with the golden and death crosses to provide even more insights.
Overall, your explanation is top-notch, it's clear, informative, and really showcases your knowledge in technical analysis. Keep up the amazing work, my friend.
Very happy to see that you took out time to go through my post. Your good commendation is a motivation to do more. Thanks for stopping by.
Upvoted. Thank You for sending some of your rewards to @null. It will make Steem stronger.
Saludos cordiales hermosa amiga ngoenyi, muchas gracias por la invitación a este reto. Encantado siempre de leer tu buena participación.
Dos señales que son usadas para vender y comprar por muchos traders, pues brinda mucha buena información de una señal de cambio de tendencia, su efectividad aumenta si es combinada con otros indicadores.
Suerte amiga, feliz tarde.
Thank you for your quick response. In deed, when combined with other indicators, they yield better results. I really appreciate your wonderful comment, it means a lot.
Cheers and good evening from my end dear friend. Do enjoy the rest of your day
Thank you, friend!


I'm @steem.history, who is steem witness.
Thank you for witnessvoting for me.
please click it!
(Go to https://steemit.com/~witnesses and type fbslo at the bottom of the page)
The weight is reduced because of the lack of Voting Power. If you vote for me as a witness, you can get my little vote.
TEAM 5
Congratulations! Your comment has been upvoted through steemcurator08.I really appreciate the support dear @josepha. It means a lot
https://twitter.com/Celina58042963/status/1754950505913110536?t=DUz-YpVVY3hROyN9oNQA9A&s=19
Is always very informative and in very simple language which is easy to understand for all of us and their explanation is so much in detail.
The last question you have answerd very well and the graph you have explained makes it more clear for understanding and your process always in very simple language and I always inspired from your post so much to the point keywords and easy to understand best of luck you have better and it's understanding of the topic
The topic was a great one and you reading through it made more beautiful. Your kind words are an encouragement to me.
Thanks for stopping by.
❤️❤️❤️❤️❤️
Hello dear, greetings to you. I hope you are enjoying the sweet moments of your life.
These are actually technical indicator that we use to find golden crossover and Death Crossover. We use moving averages in it. Two moving averages, of 50MA and 200MA is used here. Golden crossover happen when 50MA cross 200MA in upward direction and the opposite is for the death crossover. 50 MA give us the data of 50 days and 200MA give us the data of 200 Days.
We can easily understand the golden crossover and Death Crossover from your screenshots here. You have beautifully find out it for both BTC and STEEM Coin. The difference made are also very authentic too. The main difference is that golden crossover shows a bulish trend while death crossover shows a bearish trend.
You are using RSI indicator additionally too. Many steemians I have seen here talk about RSI. This is too good indicator, very easy to use and give us too much accurate signals. It works on overbought and over sold machenisms.
Wish you best of luck in the contest, keep blessing.
Dear friend.
The Gc and Dc are perfect chart patterns to trade with especially on high time frames to get the most out of it.
An additional indicator can help spot trades faster in combination with it
Really appreciated your making out time to read through.
Thanks a lot.
By reading your post, I can confidently place a buy or sell order using your strategies. Knowing which levels is support and that which is resistance is every important in trading. Nice post from you. Success to you.
Yeah sis,
With the explanations above,, You can confidently enter a winning trade. Your comments shows you benefitted a lot from my post. I am so happy about that.
Thanks for stopping by.