Crypto Academy Contest / S14W5 -Exploring STEEM/USDT Trading

There are tools that helps STEEM/USDT pair traders to analyze their trades for better results. These are the focus of this week's engagement challenge contest in this wonderful community. Using the contest tips, I will explain my understanding of those tools. Please follow along.
Using the MACD, how can you identify a buy or sell signal for the STEEM/USDT pair? And what do the upper band and lower band in the Bollinger Bands for the STEEM/USDT pair indicate?
MACD is one of the tools used for technical analysis. We can use it to identify a buy or sell signal in STEEM/USDT pair.
It is momentum indicator following the trend, which indicates the relationship between 2 EMAs and the MA 9 which is the signal line.
The EMA 12 is used to know the short term price movement of the asset, this is faster, while the 26 EMA is used to know the long term price movement of the asset.
So the MACD is then generated by subtracting the slow EMA 26 from the EMA 12. What results from this subtraction is a line that moves up and down the zero line.
So the EMA 9 line and the MACD line is now used to generate either a buying or selling signal.
Whenever the MACD line is above the signal line, it is a signal for bullish trend. When the MACD line is below the signal line, it is an indication of selling signal or trend
Let us now go to the chart.
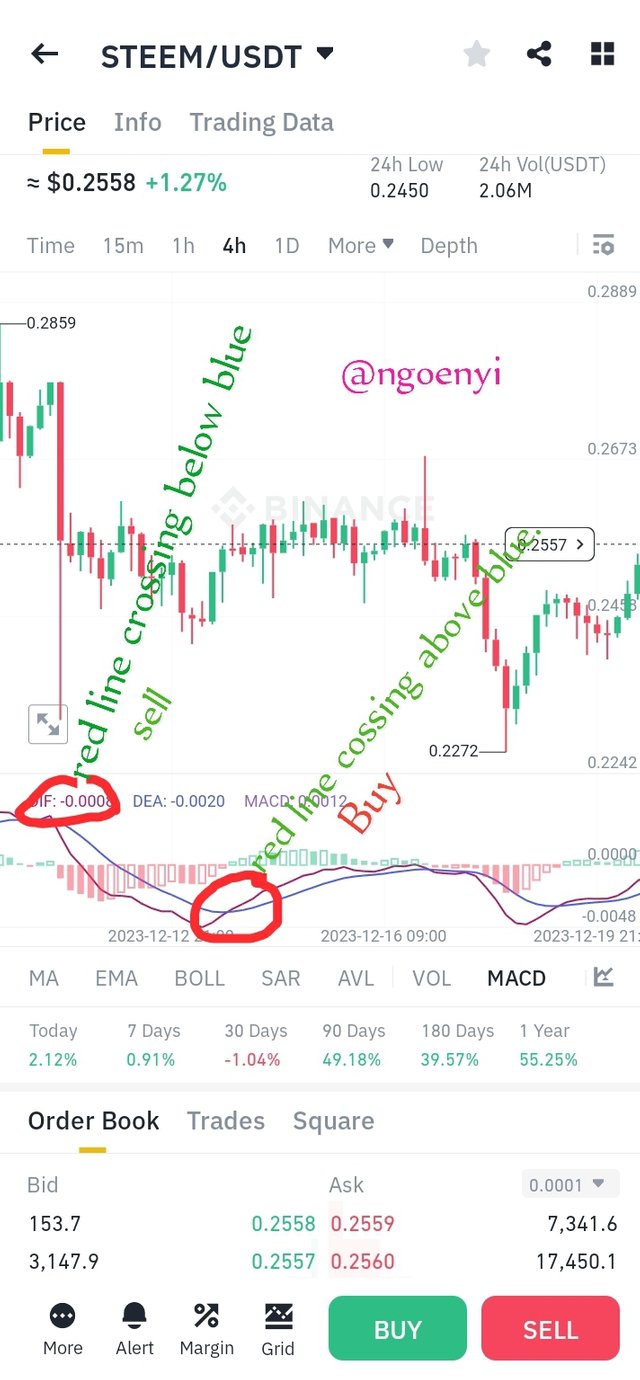
From the chart above, the MACD is the red line while the signal line is the blue line. Once the red line goes below the blue line, it shows a sell signal. At this point, a trader can sell the steem token and we confirmed the heavy dump at that crossing point. On the other hand, when the MACD line (red) is on top of the blue signal line, it is a strong indication of a buy signal. Thus, we can see the strong buy retracement of the STEEM/USDT pair.
The histograms will be above the zero line (green histogram) if the MACD is positive while if below the zero line, it is negative (red histogram)
Using the red and blue line, we can easily identify areas to buy or sell.
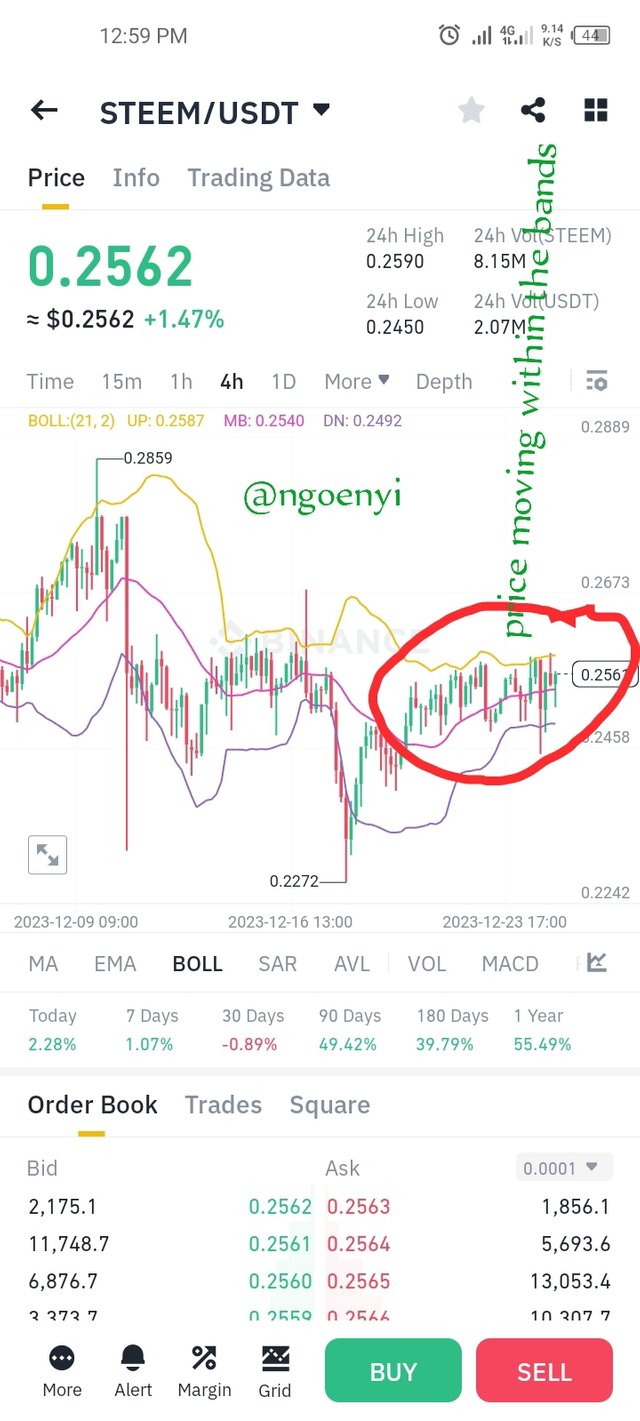
The upper and lower bands in the Bollinger Bands indicator shows the resistances and supports of the steem/usdt pair. When it breaks the lower band, it simply means that price have broken the support and is going down to test another support, while if prices breaks upward, it means it have broken through the present resistance and wants to test the higher one or create a new high (Ath).
 [Binance](Binance.com]
From the chart above, we will notice that the price having been moving in range for quite some days, as price have been trading within the upper and lower bands. Hence, we are awaiting a real breakout of price either to the downside or upside. The same reason why MACD line and Signal line are intertwined.
How can the combination of RSI and moving average help determine entry and exit points for STEEM/USDT? And how could a trader use the Stochastic Oscillator to confirm bullish or bearish trends in the STEEM/USDT pair?
RSI is an indicator that is used to determine whether an asset pair is overbought or oversold. It usually have levels of between 0 to 100. However. The levels to pay attention to mostly are levels 70 and 30. When it is at 70, the pair is over bought, even though it may still climb higher and stay for several days before reversing. When the level is at 30, it indicates the asset pair is oversold but may take some time in that oversold zone before reversing. The level 50 is a neutral point at which price can go any direction.
Moving averages can be used to determine resistance and supports of an asset pair. Areas where price movement are usually rejected whether up or down. It is used to determine the markets present condition. Bear in mind that it is a lagging indicator, hence it makes uses of past prices to show the lines. The higher the MA, the more lagging it will be and the lower the MA, the more closer it will be to the current price.
Combining both indicators can help to identify entry and exit points.
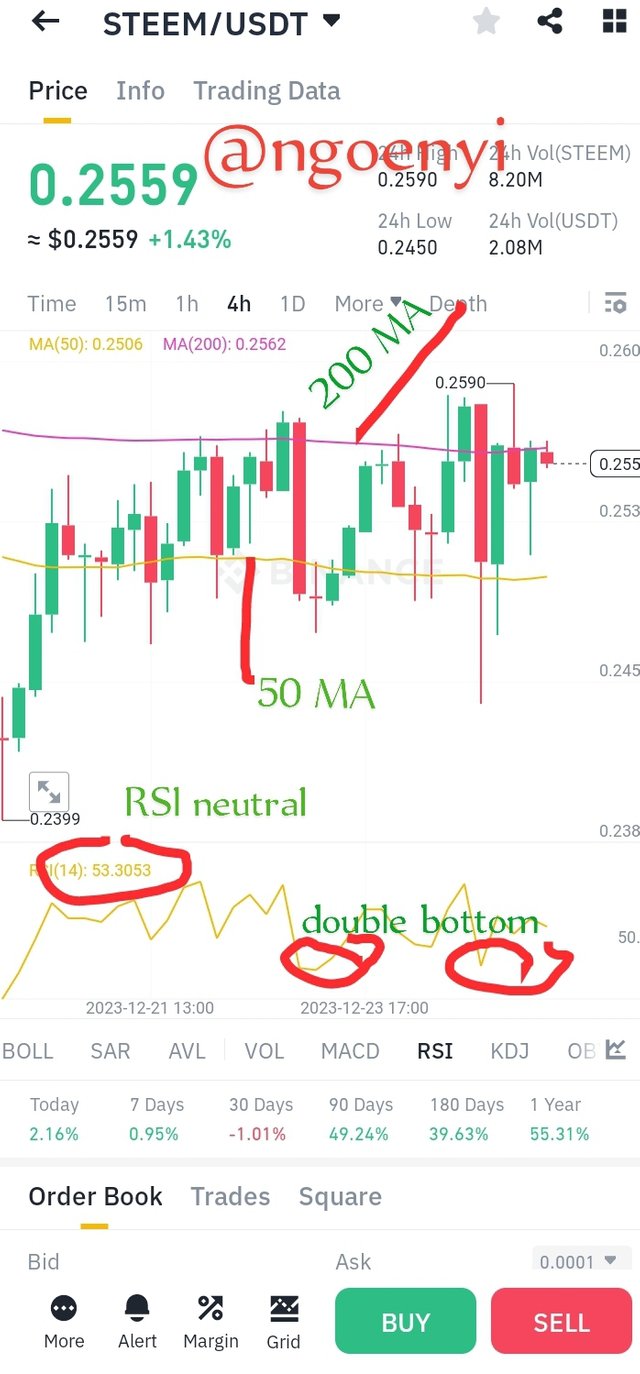
From the chart above, we can see the two bottoms of the RSI, which was below 25, price was rejected at that point. This was also shown on the MA 50,and we can see price pulling back. The price went back to RSI 70 and above, which tallies with MA 200, at which point price was rejected from going higher.
The buy entry points for both would be when it did double bottom on the RSI which tallies with 50 MA and exit point at 200 MA. A trader can look for a sell entry at this point of 200 MA using a lower time frame with a tight stop loss.
However, right now. The market is in a ranging mode, and would not be advisable to enter a buy position right now. The seller is only trading the ranging market.
A stochastic indicator is used to identity oversold or overbought asset pair. It calculates the distance between an assets pair's closing price with its highs and lows over a specific period of time.
First, the trader needs to identify whether the asset pair is in overbought or oversold levels. For a stochastic Oscillator, when it is above 80, it is overbought and when it is below 20, it is oversold. Once this condition is identified, the trader will now search for likely reversal signs in order to enter a buy or sell as the case may be. These are usually done with the help of candle stick patterns for reversal.
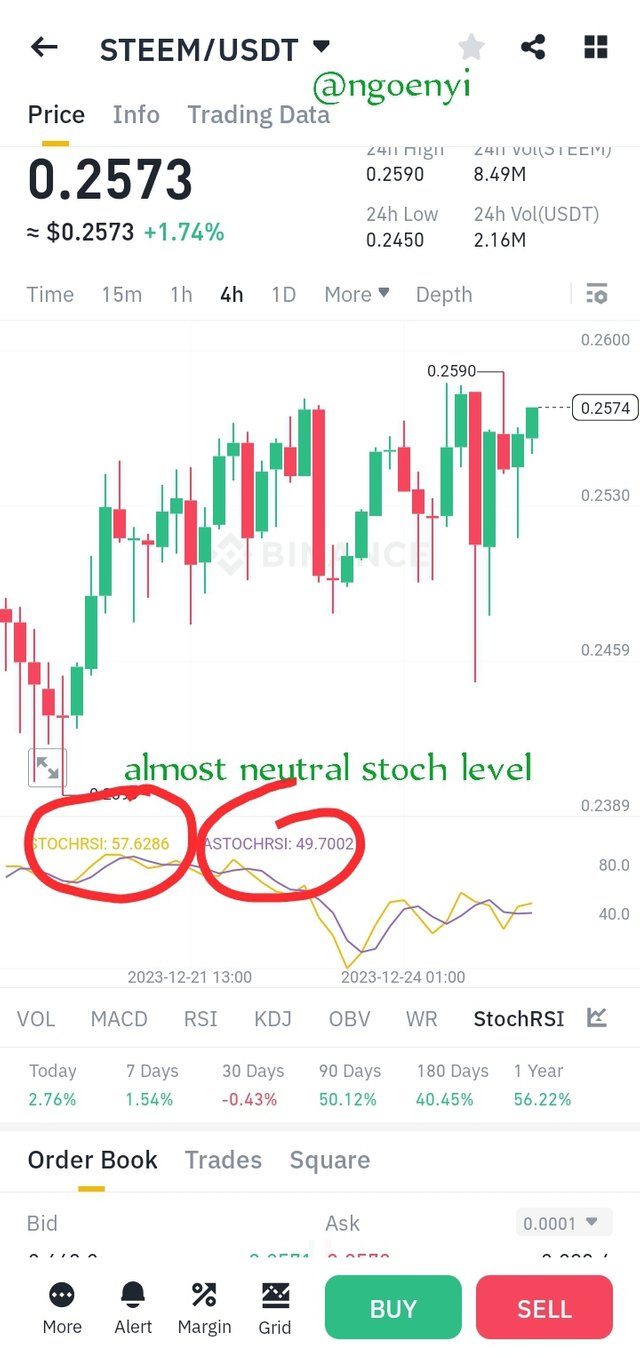
From the chart above, the Stochastic level is at 56, indicating a neutral bias in the market. The best thing is to wait until the pair is either oversold or overbought.
How important is a stop-loss when trading STEEM/USDT, and how can it be set based on technical analysis? Why is it essential to diversify positions when trading the STEEM/USDT pair?
Stop Loss is an important part of trading. In fact, I would say that it is the most important. This is because, no matter how good you are as a trader, at some point in time, the market will definitely go against you. It is a major form of risk management, protecting the capital of the trader. Still making him relevant in the market. Without stop loss, a trader can lose all his trading funds just within a flick of a finger. So when trading STEEM/USDT, it limits our losses when the trades is not in our favour, giving us the opportunity to trade once more.
In determining how to set our stop loss, we need to determine the level of capital we can risk in a trade.
Using the pair of STEEM/USDT as an example, it is always good to set our stoploss at the next resistance or support depending on which side of a trade you want to enter. Another determining factor on where to set our stoploss is the timeframe we are using to trade.
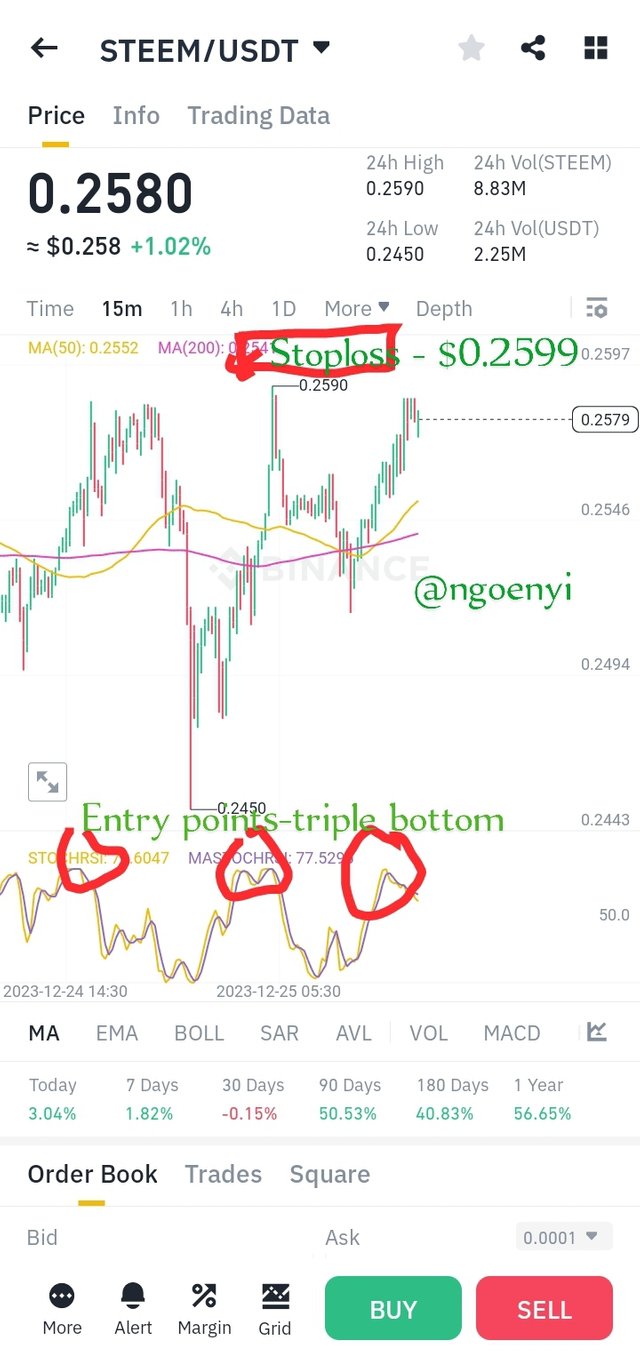
From the 15mins Tf chart, Steem/Usdt did a triple top. For a scalper, he can easily take a sell trade at $0.2586 and put his stoploss at $0.2599, just slightly above the high on 1hr timeframe (TF). His TP will be at $0.2547, just slightly above the 50 MA support line.
Diversifying positions in a trade is good as it helps to ensure the trader is still in the game and at reduced cost of entry point .
We call it DOLLAR COST AVERAGING Method (DCA). This is a practice whereby you enter a trade with less funds and add more funds as the price goes down. It ensures that the trader gets a good pricing for the asset pair and still ensures that he holds the asset pair.
It protects the trader from FOMO (Fear of missing out), which always leads most traders to buy an asset pair at a higher price. It also helps the trader to be more protable in the case of the price shooting upwards.
However, to be able to do this, the trader must have sufficient funds available for position diversification.
What fundamental factors should one consider before taking a long or short position in STEEM/USDT? and how can external events, such as announcements related to STEEM or stablecoins, influence the trading of the STEEM/USDT pair?
Before taking a long or short position on steem/usdt there are certain fundamental factors that should be taken into consideration.
° We need to find out what is the market capitalization of the steem token.
° what is the circulating and maximum supply of the steem token.
° is the token mineable? if yes, at what rate are new tokens injected into the market, since that will surely affect market price of the steem coin.
° who are the developers behind the steem Blockchain and what have been their track record on other projects.
° what is the growth in price of the steem coin since it's existence?
° How competent are the management team and what projects do they have to add in the future?
° what is the utility of the steem token?
These are some.of the fundamentals we need to look at.
External events such as news and announcements can have either a negative or positive effect on the Steem/usdt pair.
Some months ago, there was announcements of steem token being traded in futures of some major exchanges. That singular announcement caused a tremendous rise in the price of the steem/usdt pair. The price got to $0.32 as at then. That is the effect of news, this time having a positive impact on the pair.
Some days ago, there was a news that $1B usdt was minted at the Tether Treasury. This is definitely going to have both a positive and negative impact on the pair. Why do I say so? It is because with that usdt availability, the market will have to deep (negative) so that the whales can buy their desired coins at a desired low price and afterwards, the market will pull back intensely as supply is taken out on the market. This will be a game changer, leading to massive increase in price of coins including the steem/usdt pair (positive).
So external news do affect the steem/usdt pair.
Apart from commonly used indicators, what other leading indicator could be useful to analyze the behavior of the STEEM/USDT pair? and how can trading volume be interpreted to predict future movements of STEEM/USDT?
There are many other indicators that can be useful in analyzing the behaviour of the steem/usdt pair.
Some of these Indicators are
^ The average true range (ATR).
^ The Ichimoku Clouds
^ The Williams Alligator
^ Super Trend.
^ Average directional Index
All these indicators can be used in successfully analyzing the crypto pair of STEEM/USDT.
A pairs volume is said to be the amount of the cryptocurrency which is traded within a specific period of time.
This is usually indicated below the pairs chart by vertical bars or histograms. It can be shown in all the time frames of the pairs.
The volume shows how active the coin is being traded on the exchange floor. It shows that traders have more interest in the coin, bringing about more price movement and more transactions. While lower volumes indicates lower interest from traders, lower transactions and more stability in price.
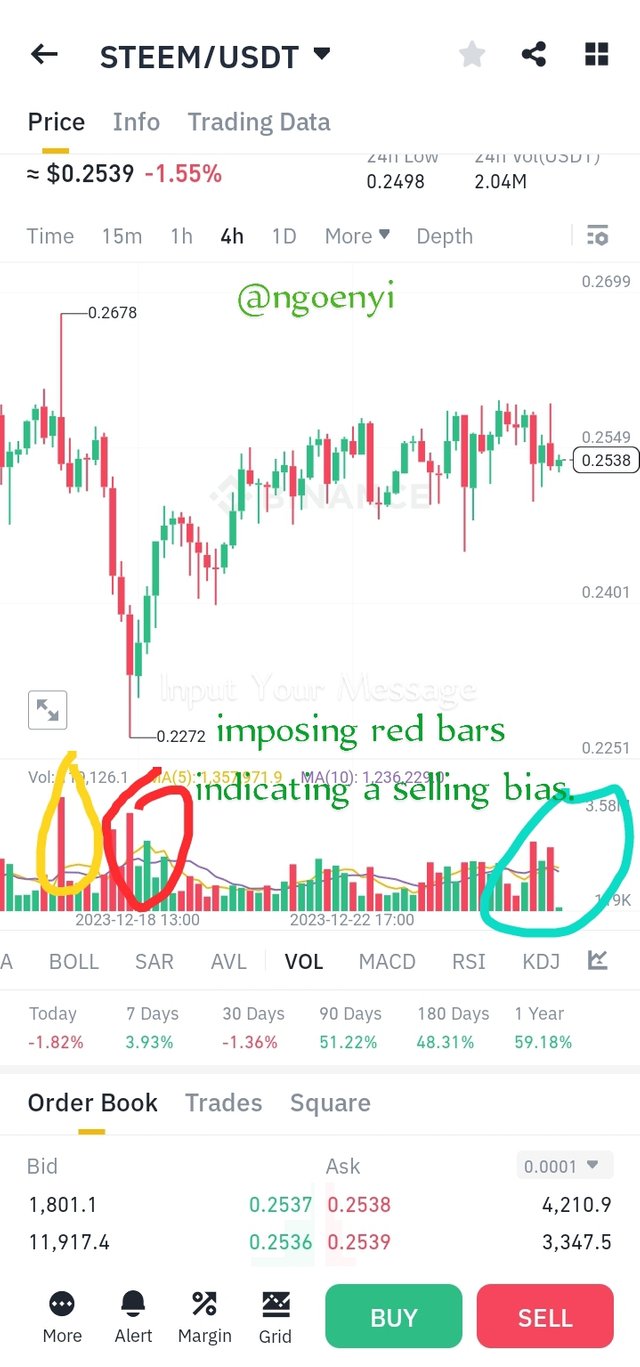
Using the chart above, you will notice the red and green bars of the histogram. The red bars shows the volume or level of Shorters in the market while the green bars indicates the volume Buyers in the market.
So from the volume bars, the pair of STEEM/USDT is biased towards a sell off for the short term. This is deducted from the giant red bars circled in the chart, which no green bar can match.
So in the short term, there is more selling pressure than buying. Unless we have major buyers to change the selling bias. This is my prediction in the next few days. This has already played out as expected.
Conclusion
All the five points highlighted in this engagement contest are important in analyzing and trading the pair of STEEM/USDT as well as any other crypto pairs.
Those key points to always check before investing are;-
° Technical Analysis
° Trading strategies
° Risk Management
° Fundamental analysis
° Leading Indicators.
At this juncture, I will like to invite @yancar @steemdoctor1, @artist1111 and @sahmie to take part in this contest. Learning never ends! This has opened my eyes the more. Hope you too will find it interesting!
This is my introductory post here
Saludos hermosa amiga ngoenyi, muchas gracias por la invitación a este reto.
Amiga tu no has realizado una participación, tu has realizado un tutorial de trading, es magnifico como abordaste cada herramienta dentro del análisis técnico y diste un maravilloso resumen de uso de cada una, te felicito de verdad, con este reto estarás en el top, eso no lo dudo.
Suerte y bendiciones.
Haha, my dear friend, I have been able to explore Steem/USDT trading pair as requested. This is a practical section and I am glad to have gotten this far. Honestly speaking, I enjoyed this exploration and with it, mastering the act of cryptocurrency trading is just very easy. I love learning and practicing. Thank you for finding my entry worthy of being a tutorial. I love it. I live it. Hope to read your entry soon
Thank you, friend!


I'm @steem.history, who is steem witness.
Thank you for witnessvoting for me.
please click it!
(Go to https://steemit.com/~witnesses and type fbslo at the bottom of the page)
The weight is reduced because of the lack of Voting Power. If you vote for me as a witness, you can get my little vote.
https://twitter.com/Celina58042963/status/1739799542625690012?t=vrB8HESXB-u5wvVr7-aeaQ&s=19
You've got a free upvote from witness fuli.
Peace & Love!
Your detailed explanation of RSI and moving averages provides a solid foundation for understanding their roles in determining overbought or oversold conditions and identifying resistance/support levels.
Emphasizing the importance of levels 70 and 30 in RSI and the lagging nature of moving averages is informative for traders. Combining these indicators can indeed offer a comprehensive view of the market. Great job in breaking down these concepts for clarity!
You have picked important points out and these are fundamental to our success in trading. Thank you for finding my entry informative. I appreciate
Greetings ma,
Wow, your explanation of RSI and moving averages will really help traders understand how they work in spotting overbought or oversold conditions and finding support/resistance levels. It's cool that you highlighted the significance of RSI levels 70 and 30 and the lagging nature of moving averages. By combining these indicators, traders can get a complete picture of the market. You did an awesome job breaking down these concepts for clarity. Good luck and keep up the great work.
I so much love this topic for this week. It is more of practical in nature and exactly what traders need. These indicators are key to being successful in trading and I am glad that I am able to explore. Trading is not just what it seems at the surface. Technical analysis using these tools are involved. In deed, learning ever ends. I am glad that you have found my entry very helpful especially to traders. Thank you so very much for engaging, I appreciate
That is very true, it's practicality took us away from the theory into the semi-field of trading, where taking out only the actual trading is left for us to decide. Nice one.
Please be my teacher. (:
Hahahahah, dear Sis, I will do my best if you are willing. How are you doing? It's been a while. Hope you and yours are doing great?
Thank you. Now I know where to go if I need help. (:
I'm good. Yes, it's been a while since we last talked. How's your new place? Has it come together?
We are doing great. Trying to be regular here.
Yes, you can call on me if you need help. I will be available for you anytime.
Good to know that you are doing good. My new place is serving us real good. Hoping to put it together with time but we are ok with the way it is for now.
It will be great if you become more regular. I can't wait. I have missed you a lot. Thank you for always checking out on me with you upvotes. I have been seeing them. I appreciate. My kind regards to you and yours over there. Best regards
I definitely will.
Do share the pictures.
I'm more regular than ever. 2 blogs in a week. Working on the 3rd. I think you didn't see those.
I didn't see them. I will check them up on your blog now.
hello sister @ngoenyi i always check the news and updates about STEEM before making any trades. Positive news and community support make me feel confident about going long, while negative developments may lead me to consider a short position. It's important to stay informed and be aware of any changes in the market sentiment or announcements related to STEEM and stablecoins. This helps me make more informed decisions in my trading journey....best wishes for you dear
@ngoenyi m'am
The principle of trading is with volatility we've seen that lately there's been a lot of volatility. And this is the most important point because with this the trader can save himself from the losses that are going to happen. What is happening affects the market. If you talk negatively, the market will go down. If there is a positive trend, then the market will go up. This is the basis of the news. Other activities are great. Stay tuned and be sure to comment on other friends' posts