[Crypto Trading with Price Action] - Crypto Academy / S6W2- Homework Post for @reminiscence01


Explain your understanding of price action.
The importance of fundamental analysis, as well as technical analysis, cannot be overstated. However, the popularity of technical analysis is increasing day by day and many people are relying on this analysis. Technical analysis is used before the history of the market structure because the behavior that the market has done in the past may again be seen in the market.
Especially those who trade for a short period of time give the highest priority to investigative technical analysis. Price action is part of a technical analysis that is familiar to traders. Price action helps to understand the market structure which is important for every trader.
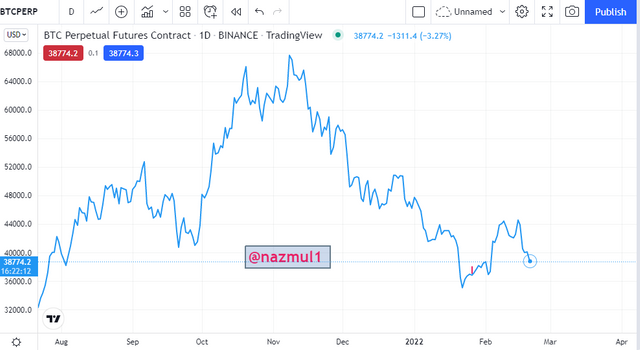
Traders usually use price action to understand the condition of the market and where they can take the trade opportunity. Traders also use the price action to find out the best entry and exit points which helps to manage risk in trading.
A trader can set a stop loss in a very good place if he can find out the market entry and exit points. Market action also helps us to determine support and resistance. Let's see a screenshot for better understanding.
What is the importance of price action? Will, you chose any other form of technical analysis apart from price action? Give reasons for your answer.
Since Price Action helps us to understand the movement of the market, it is very important. Let's see the importance of price action.
- I have mentioned earlier that it helps to understand market structure by using price action. As a result, traders use it for understanding Market structure.
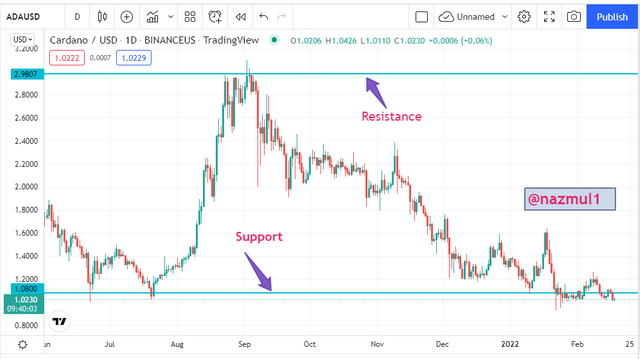
- Price Action helps us to spot support and resistance in the chart. The most important thing to know before entering the market is support and resistance. It gives an idea to set stop loss.
- The most commonly used to understand the psychology and emotion of market buyers is the price action. Depending on which reversal in the market is estimated.
- Price action is used to filter noise and false signals from charts. When we use different technical indicators, the right signal does not always come from there, times it gives a false signal. Price action is widely used to solve such problems.
- It helps us to understood trends. For example, uptrend and downtrend.
Explain the Japanese candlestick chart and its importance in technical analysis. Would you prefer any other technical chart apart from the candlestick chart?
The candlestick pattern is one of the most widely used and popular chart patterns in the world. We need a Japanese candlestick pattern to see the various market information, usually through the chart. All kinds of information like price movement, opening price, closing price, uptrend, downtrend, sideways, date with price, high-low, etc. The behavior of the market and different patterns like triangle pattern, ascending pattern, wedge pattern, double top, double bottom, etc can be seen and by looking at it the traders open the trade and make a profit.
By looking at different candles we can understand the reversal of the market like Hanging Man, Shooting Star, etc which is made in uptrend or downtrend then market reversal happens. At the same time, I get so many benefits only in the Japanese candlestick patterns which is not possible in any other chart pattern. So I can say without a doubt that this is a very important and necessary chart pattern that most traders use. That's why the importance of the Japanese candlestick pattern is so high. Let's see a Japanese candlestick pattern.
Yes. I prefer another chart beside the Japanese candlestick chart pattern.
If we click on the option to change the chart of trading view, then we will see different charts.
- Line chart
- Japanese candlestick chart
- Heikin Ashi
- Bar chart
- HollowCandles
Each of these charts usually has different characteristics. For example, Line Chart only calculates the closing price and shows us a line. From which uptrend and downtrend can be determined. We get many such benefits in different charts so I use other charts besides the Japanese candlestick chart patterns.
What do you understand by multi-timeframe analysis? State the importance of multi-timeframe analysis.
We will hear the name of the style in different types of trading such as intraday trading, swing trading, long-term trading, short-time trading, etc. Here different traders try to understand the market position by analyzing different timeframes. When we notice any pattern on the candlestick chart, if we change the timeframe to a certain timeframe, then there is almost no more there. Because the condition of the market is seen to change every time in this crypto market.
Normally, a higher timeframe uses traders to identify trends for example uptrend or downtrend. On the other hand, a short timeframe is used for entry or exit in the market. A swing trader uses one month or one-week timeframe but an intraday trader uses four hours or higher timeframe to take their entry or exit in crypto trading. Again The one who trades within a very short time frame is called a scalping trader. Generally, they use 5 minutes, 15 minutes, or within seconds. So we can say that one type of trader carries different importance at different times.
Importance of multi-timeframe given below.
- If one has created market side away in a timeframe then we can find the direction of the market by changing that timeframe. Because sometimes it is seen in longtime where side away is making short time there is a bullish or bearish trend.
- Different timeframes help a lot to eliminate noise and disturbance from the market. So traders take advantage of this by changing the timeframe.
- The timeframe helps us to find real exit and entry positions. We usually add stop loss take profit using timeframe. Which makes it easier for a trader to trade and helps to avoid large losses.
- The most important thing is that the timeframe ensures our market analysis. Short-time traders, in particular, can book quite good profits using multiple timeframes.
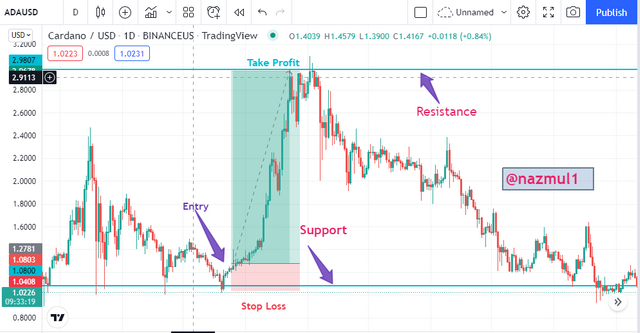
With the aid of a crypto chart, explain how we can get a better entry position and tight stop loss using multi-timeframe analysis. You can use any timeframe of your choice.
I will enter tradingview.com to perform the answer to the question. There, through a specific pair, I will highlight the details in front of you through some screenshots. So let's see a screenshot below.
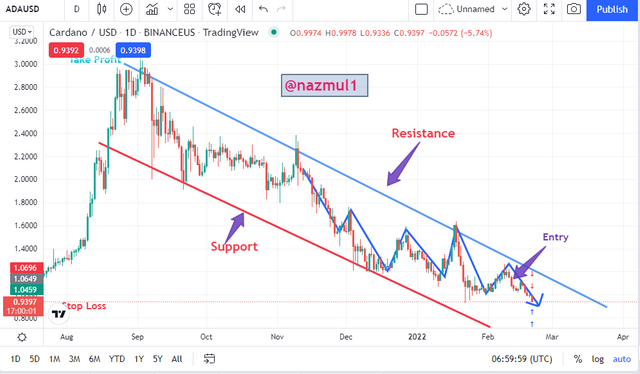
In the screenshot you can see above, I have added one-day time frame. Since we will use multiple time frames, this is the first time frame I have used big time here.
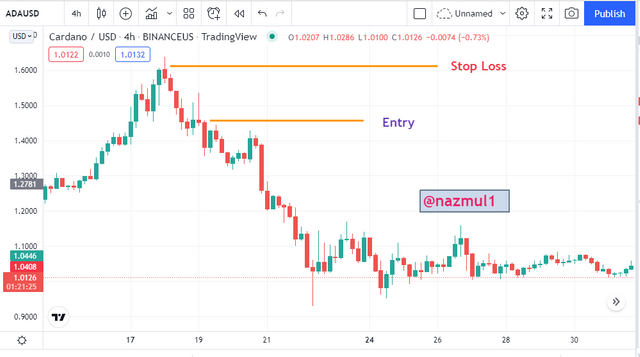
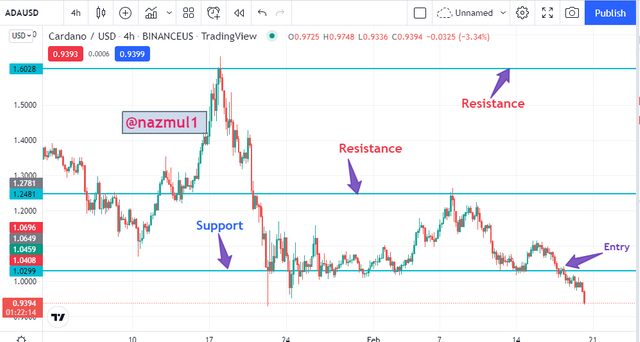
Four Hour
Time frame 5 minutes
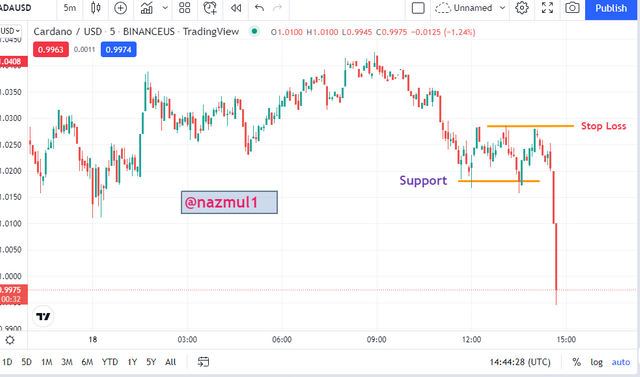
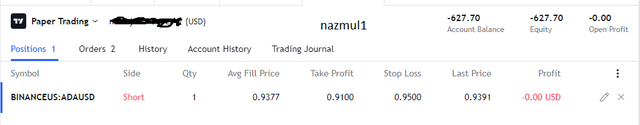
Carry out a multi-timeframe analysis on any crypto pair identifying support and resistance levels. Execute a buy or sell order using any demo account. (Explain your entry and exit strategies. Also, show proof of transaction).
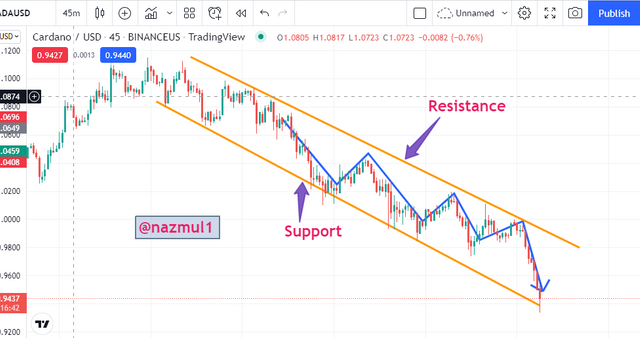
45 minute chart
4 hours chart
1 Day Chart
To trade the demo I will do paper trading with the help of the Tradingview website. I have opened a trade in a pair and the screenshot below is given as proof.
Conclusion
Today's lecture was a very important lesson on price action. Through this lesson, we have learned about the various issues of Price Action and have tried to highlight many issues through answering questions. Such as where the time frame is used and its advantages disadvantages and how we can benefit from using the time frame.
Moreover, we have highlighted the use of time-frame to enter the market, exit, and where to set stop loss. Such details will surely help us to enrich our trading experience. Finally, I would like to express my sincere thanks to the Honorable Professor @reminiscence01 for sharing such an instructive lesson with us.