Candlestick Patterns - Steemit Crypto Academy Season 5 - Homework Post for Task 10
Edited in Canva
Questions
1a) Explain the Japanese candlestick chart? (Original screenshot required).
b) In your own words, explain why the Japanese Candlestick chart is the most used in the financial market.
c) Describe a bullish and a bearish candle. Also, explain its anatomy. (Original screenshot required)
Introduction
Greetings Steemit Crypto Academy, it is always a pleasure to be here. Today’s class was awesome as usual and I’ll get to testing my understanding through the questions and answers. While hoping my answers meet expectations, I will like to say a big thank you to Professor @reminiscence01
1a) Explain the Japanese candlestick chart? (Original screenshot required).
Before the West developed the bar chart and the point-and-figure charts, candlestick charts had already been discovered in Japan about 100 years back.
A Japanese man called Munehisa Homma in the 1700s discovered that though there was a relationship between the price of rice, it’s demand as well as its supply; the market was equally highly influenced by traders' emotions.
It is these emotions that are shown by the candlesticks through visual representation of the different price sizes with different colors.
These traders use the candlesticks to decide on trading with their base being on regular occurrence patterns. It is therefore these regular occurrence patterns that help them to forecast the direction of prices in a short term period.
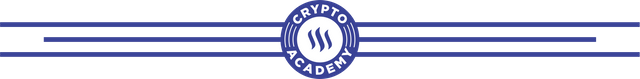
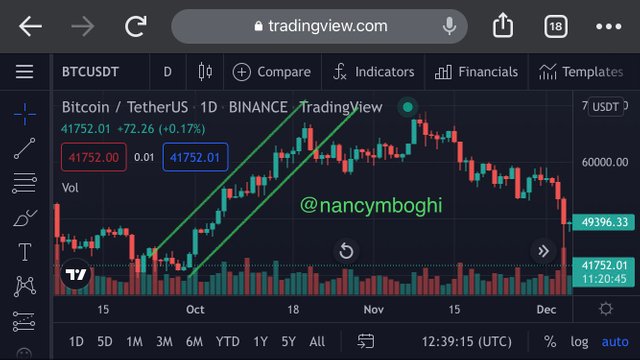
screenshot gotten from Tradingview
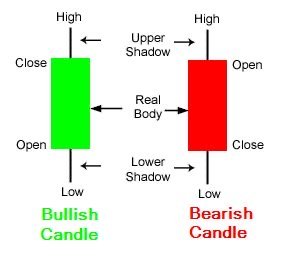
There are four price points shown on candlesticks which are; Open, Close, High and Low.
Open: This is synonymous to the Opening price. It could be seen as the start of the day in other words. It actually shows where the price movement starts. Within a given time period,the price movement is thus marked, built and recorded.
Close: Here is the closing price, it marks the end of the day. This portion of the candlestick actually shows the last price recorded within a given time period.
High: High is the Highest price. It is that portion of the candlestick chart which shows the highest price that is recorded within that specific time period.
Low: Low is the Lowest price. This shows that part of the candlestick chart with the lowest price within the specific or given time.
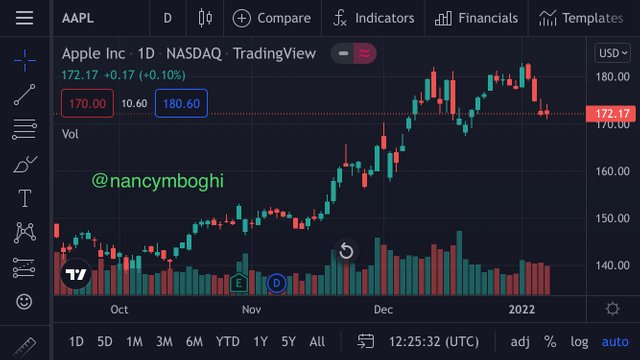
Candlesticks equally have a real body and a shadow.
- The Real body: It is the wide part of the candlestick. It is the price range that is between the open and close of that trading period.
Traders could however alter colors in their trading platforms for example red for the down candle and green for the up candle.
But generally, when the real body is filled or in black, it indicates that the close price was lower than the Open. Here, the closing price can therefore be seen at the bottom of the body and the opening price at the top.
On the other hand, if the real body is empty or in white, it means the close was actually higher than the open price wise. In this case, the closing price is located at the top of the real body and the opening price is located at the bottom.
- The shadow or wick: This shows areas that the price moves through but did not actually close. Therefore in other words, it indicates the unsettled movement of prices that is the fight and struggle between the buyers and the sellers.
There is the upper shadow which is the price distance between the top of the body and the higher price or high for the specific trading time period.
The lower shadow on its path is the price distance between the bottom of the body and the lower price is low for that specific trading time period.
Note that, the length of the candlestick body and shadow are very important indicators of price action.
b) In your own words, explain why the Japanese Candlestick chart is the most used in the financial market.
It is no news that these candlesticks are the most visual graphical representation of traders in regards to a clear price movement. For this and more, they are the most used in the financial market. Below are some points to ascertain this.
At a glance, the current state of the market is determined. Traders by just looking at the color and length of the candlestick could instantly determine whether the market is becoming bullish or bearish.
Again, with this market patterns can be identified easily. Specific bullish and bearish reversal patterns that cannot be seen on other charts are easily identified here.
More so, Japanese candlesticks show a lot of information; highs, lows, open and close in a specific time period. Added to this, though with all this information, the display remains very attractive, accurate and easy.
With this candlestick, the market direction is easily seen. With the help of the shape and color, traders could determine if an uptrend is actually part of a bullish momentum or it is just a simple bearish spike.
To add to, these candlestick charts are not only easy to understand but aesthetically pleasing to the eyes. Adding to the fact that they go with customizable colors thus traders can make them look however they please makes it all the more beautiful.
A very important point to this is that most indicators work perfectly with the candlestick charts. Together they give far better readings.
Lastly, for the fact that Japanese candlesticks are clear and easy to describe, it makes it even easier to describe in code for the creation of trading algorithms.
c) Describe a bullish and a bearish candle. Also, explain its anatomy. (Original screenshot required)
Bullish candle
There are two types of candlesticks; the bullish are one which one can use to strategically and timely trade financial investments in the the market as well as stocks.
We say a bullish candlestick is formed when traders try pushing prices up. These traders are equally known as the bulls. When they do, the closing price becomes higher than the opening price. In price charts, they are originally represented as green or white.
This pattern alerts traders that the market will soon enter an uptrend. This means that the bulls are taking control of the market hence prices would move up.
In the crypto language; we say the market is a fight between traders otherwise known as bulls who raise prices by opening long positions, that is, buying assets or contrarily lowering the prices by traders known as bears by selling their assets or taking a short position.
Therefore, to be able to make a good trading decision, one has to know who has the upper hand in the market at that particular point in time. It would be bad to go short when the market is bullish for example. Knowing this goes a long way to help achieve the goal of trading- profitability.
In common words, with bullish candlestick think of buyers. In this same light, the more the buyers, the higher the price of the asset being traded.
screenshot gotten from Tradingview
Because this pattern is in every chart, it is of utmost importance that we identify and read them correctly.
Bearish candle
This is the converse of a bullish candle. A bullish candlestick is formed when traders, known as bears, try pushing prices down. When this happens, the opening price becomes higher than the closing price. They are originally represented as black or red in the price chart.
This pattern is a message to traders that the market will soon enter a downtrend indicating that the bears are in control of the market thus prices should be expected to go down.
Spotting a bearish pattern doesn’t really require any special skills because they actually occur regularly. Traders' emotions constantly change, so do the price moments and hence patterns.
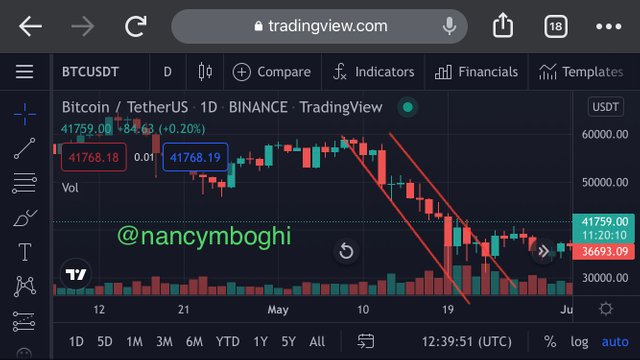
screenshot gotten from Tradingview
This bearish candlestick somehow tells us that there are now more sellers in the market than buyers reason for the fall in prices as the rule of demand and supply states.
Bullish and Bearish candlesticks are however just one part when analyzing a trade so as to make a decision. Often for accuracy of results, they are used alongside other indicators like RSI and so on.
Note that, all the words on the image have been explained above.
Conclusion
Cryptocurrency is the world of today; adequate knowledge however needs to be acquired for sure before venturing into this cryptocurrency trading.
I am glad to have been part of this class as I have learnt and understood a whole lot.
Once again, I say thank you.
Best Regards
@nancymboghi