[Trading with price action] - Crypto Academy / S6W2- Homework Post for @reminiscence01

Hi steemians, I’m happy to take part in the second week lessons of this season of the steemit crypto academy. Today I will be answering some questions given by professor @reminiscence01 after the end of his lesson. This lesson or my task is all about price action and its function as a good trading analysis method. I will describe this method of carrying out trading analysis and will give the best way of manipulating chart time frames in order to make good results from them. Without wasting much time let’s head on to the work proper.
Price action is the behavior of the price value of an asset on the price chart. Carrying out cryptocurrency trading analysis is done in different ways and the basic ways of doing it is either by fundamental analysis or technical analysis. The technical analysis done is by understanding the price action and predicting future market moves since the market is in a “constant repeating circle” such that events likely happen from time to time.
Price action actually gives out the internal workings of the asset value such that it identifies patterns, trends, and define the buying and selling pressures of the market at different times. Putting these together tells a lot about the external forces acting on the market but without external precisions like the fundamentals will provide. There are lacking fulfillments in the use of the fundamental analysis and this calls for the utility of price action either as the main criteria or method or as a complement to fundamentals.
The price charts of an asset is a description of the activities taking place with the buy and sell ratios of that asset. Therefore this is the representation of the trading psychology of the investors of that asset. If this can be read on the price chart as price action, therefore it’s of great advantage to use the price action to satisfy accuracy in determining when to buy or sell an asset. The price action uses the trading volume, support and resistance, the structure of the market and patterns that form in the market as well as indicator tools to understand the precise future move of the asset at a given time.
Thus, price action is a graphical representation of the psychology and emotions of traders investing-in or withdrawing-investment from a common market such that the market can see an ascend or descend depending on the external forces driving investment. Those traders applying the price action method for analysis before making buy or sell actions will always take a deep look into the price history of the asset such that they can note recurring situations and patterns. So if patterns tend to repeat themselves it’s of vital advantage to the trader. Take for example the Elliott wave theory or the double tops and bottoms, these patterns will always occur and most of the time the next move will be the same unless the analysis wasn’t done properly. With such advantage, the trader has an edge over the market already.
With the aid of price action a trader can develop a trading plan such that the trader knows when and where to invest with precise take profit points or stop loss of great risk management criteria. With price action the entry and exit criteria is made quite clear and easy as levels on the chart such as the support and/or resistance prices acts as a standard for identifying levels where the price has the probability of staying for a while. Whenever the price breaks the support price, the trader can make a sell entry while setting the take profit a little below the next immediate support price. For a buy signal, the resistance can be broken when the bears can no more hold the market to their side and we can make a long entry with stop loss below the immediate support and the take profit a above the immediate resistance. With such unique information gotten from the price action method of trade analysis, it’s good for a trader to practice this method, especially intraday trader.
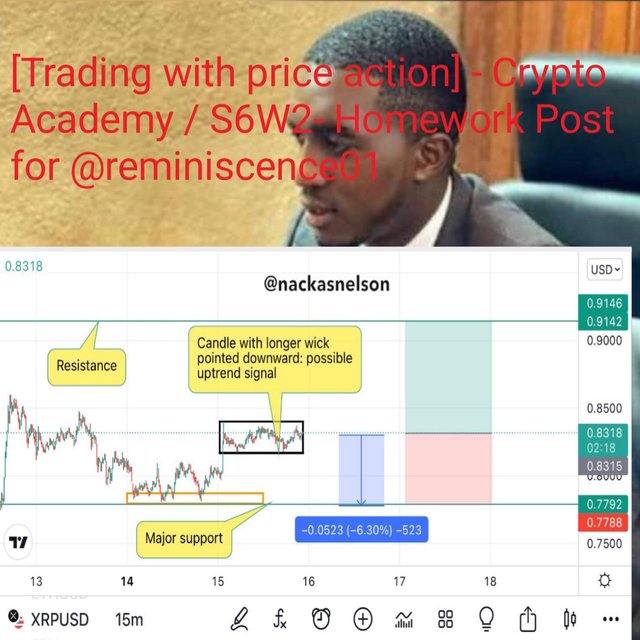
The above screenshot is an idealized description of our price action analysis used as a means to determine exit criteria of the market. The horizontal lines are linking supports and resistance ok the price chart such that we use such points as the focus on taking profits and setting stop loss when placing trades.
With this we can say that the traditional fundamental analysis is effective for strong bull markets or bear markets but doesn’t dish out the amount or rate at which the move will be effective. This can only be best understood by applying price action. The price action method on the other hand is capable of producing vital information about the movement and level of movements that may occur in the market within a certain range. The fundamentals can be used to give more credit to the prediction of the price action trader.
Price action is very important to but a link term investor and a short term investor. Price action reduces noise on the information it gives abou an asset. It also provides information about the current market structure and the next possible market move as well as it shows the emotions exercised by traders in the market.
The activities of man are controlled by his emotions. During investing in a project, the mind plays a vital role in the decision taken by an investor such that they believe in buying low and holding until high but sometimes turns out to be in liquidity. The price movement seen on the price charts are a representation of the behavior of all investors in the market of a particular asset. The buying and selling pressure outside the market is registered on the price chart collectively so that we can read the minds of most traders/investors in the market.
Let me take the example of the Elliott wave theory whereby five impulsive waves form and after the fifth has formed completely, three correctional waves will occur. This means that whenever buyers take over the market, some tend to take profits at just the time they think is the top of the asset at the particular period. This leads to selling pressure increase which leads to some correction wave formation and after the process, the impulse might continue. Another typical example is the double tops and bottoms. This takes place when investors buy or sell an asset to an extent where a group of these investors cash out causing the market to have some correction and later the remaining investors try to push the market to a greater price level but when the previous high/low is met, most of them take profits and cause liquidity of the others. The market movements I just described are a replica log emotions or the trading psychology of the investors/traders of a particular asset at a particular time.
The market structure can be determined by the price action of an asset such that traders can identify different market structures which guides in opening and closing positions in the market. Knowing that the market is in an uptrend, downtrend, or range will enable the trader know which analytical tools to use for the study of the price action of the market. Having the ability to identify the marjet direction is an added advantage to every trader. When the price action records a market direction, the price chart shows a gradual or impulsive upward or downward movement of the market or an oscillation in a particular range.
When the whales of the marjet take profits, the retail traders are always in trouble. At some points the whales will try to shake the tables so that the small hands in the markets will follow a false trend and end up being liquidated. To avoid this kind of scenario, traders use the price action’s ability to prevent false and irrelevant signals such that traders can identify only true signals of purpose. The discrimination of false to true signals is gotten by applying different price action analytical tools such as trading indicators. A single indicator can give good signals as well as bad signals sometimes. To solve this problem, traders apply more than one indicator on the price chart and are able to detect and silence faulty signals while they make use of the profitable signals. One can also apply the multi-tome frame technique to avoid false signals or false trend from surfacing all the time on the price charts.
With all the above mentioned values of the price action method of analyzing assets in the financial markets, I consider price action to be the best means of analyzing any asset provided that the asset has been trading for long enough time that the repeatition of activities can take place. If an asset is still young in the market, then fundamental analysis will be the best means of understanding and predicting next marjet move of the asset.
The Japanese candlestick charts are the widely used price charts in analyzing cryptocurrency pairs for trading activities. This is because this chart category contains smaller signatures of the price action at any given time frame such that there’s a series of candlesticks with each candle representing a bearish or bullish market move. The candlesticks are capable of forming patterns which when studied accurately will earn the trader good entry and exit criteria of trades placed. The Japanese candlestick charts represent the buying and selling pressures and the market in a significant scale such that individual candles can be used as strategic positions for specific analytical purposes.
There are other chart styles such as the Hallow chart, Line chart, Heikin Ashi chart and other charts. The different charts have their ways of interpretation for example the line chart only shows the day open and day close of the market. The candlestick chart shows quite much compared to the rest. With the credit added to the candlesticks chart, they tend to be the most famous and productive chart style for technical analysis with price action.
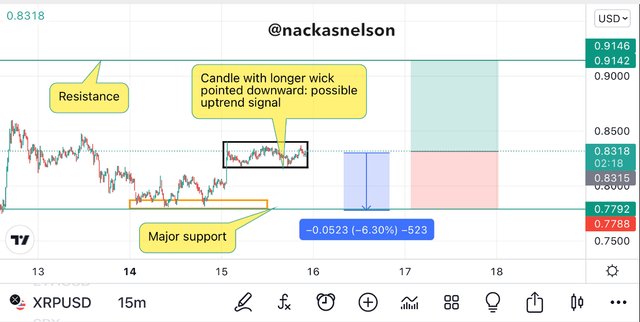
Each candlestick on the Japanese price chart is of high significance especially when dealing with higher time frames. Imagine a single candle representing a whole bull run or bear run.these candles form depending on the time frame on the chart such that a 15 minutes candle will completely form when the countdown reaches 00. This starts from an open price and may fluctuate until it ends at a closing price. The following screenshot shows the two basic candlestick types that can be seen on the price chart of any asset. The colour setting depends on the trader but by default, the green candle is the bullish candle while the red candle is the bearish candle.
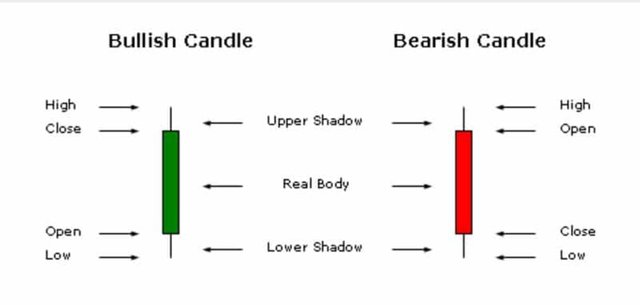
A bullish candle means that the price value of the market at the beginning of the formation of that candle was smaller than the closing price of that asset at the end of the formation of that candle. For example, the 15 minute candle belongs to form from below and moves directly upward all throughout the 15 minutes such that it forms a bullish engulfing candle, we know that there is a high buying pressure in the market.
If we dive deep into the anatomy of these candlesticks we will see that there’s a lot of information coming from each candle and if these candles line up in a series for a particular trend it forms a clearer version of the signal produced by individual candles. Candlestick la without wicks are considered of high market momentum depending on the colour it can be high bearish momentum or high bullish momentum. If the candlestick has a very long time, the market is considered highly volatile such that prices can move far up/down and return to the opposite side in just a matter of a complete time frame. Depending on the direction or direction of the longest wicks, the candlestick plays another typical rule for a specific signal. Different candlesticks have different names or acronyms given by different traders but all for the same significance. This means that a trader can call a special candlestick in their own way and another trader calls the same candlestick in a different way, it will not change the functions of such candlestick.
The candlesticks and their patterns acts as sweet moves identifiable in the market for common market move predictions. Support and resistance levels which are a necessity in planning the exit criteria of a trade are seen commonly on candlestick charts. Checking a resistance area to find a bearish engulfing candle will tell the trader that there’s a possibility of a reversal at that point and of such as bullish engulfing candle is seen at the support level, the same situation is likely to happen.
With such vital information that can be gotten from the candlesticks and their patterns, I think the candlestick charts are best to use for price action analysis when dealing with any time frame since they are not limited to anything. Knowing that the smallest signal can be gotten from just a wick of a candlestick makes the chart style the best to use.
Multi-time frame analysis is a method of analyzing price charts in order to get precise information about support and resistance levels on the charge. This allows a trader to know any strong support and strong resistance depending on their time frames. In the case of a market structure with indecision, the multi-time frame analysis will guide the trader on the market direction. This time frame is used to filter noise from the market and allows for the identification of good support and resistance levels.
When dealing with trade set (trade exit criteria) we make good use of the multi-time frame analysis to set tighter stop loss and take profits. This will prevent the loss of opportunities and the mistake of using the wrong stop loss or take profit price since we can easily get all the footprints of the support and resistance. Since the support and resistance play a vital role on the position size, the multi-time frame analysis should be keenly looked into.
This analytical technique is done by checking different time frames on the same price chart to unravel the different resistance and support levels. It also uses the larger time frames to show off the current price trend if it is hidden on the smaller time frames. The higher the time frame, the stronger the support and resistance levels identified on the chart. Therefore a smaller time frame chart will give us an intraday level for take profit and stop loss but the higher time frame will give that of a larger position such that if any support/resistance on both time frames appear the same then we have a good support/resistance level to count on. The importance of the multi-time frame analysis can be seen in three different ways and this I have described below in different sub sections.
The muleti-timeframe analysis can give the trader a vivid identification of tight support/resistance levels as the time frames are switched. Therefore all hidden support/resistance are made public while the exit criteria upon setting up a trade will be made easy and perfect.
This analysis reduces the rate of complexity on the price chart which surfaces from too much price fluctuations. The irrelevant moves in the market are silenced when you switch time frames because the trend becomes very clear to you. If a pattern is hidden on one time frame, another time frame will reveal the right trend or pattern in formation or that has already formed in the price chart. This serves the trader with the benefits of a doubt as to which direction a trade should be placed.
The role of this analytical technique is of great importance to a trader upon identifying the best possible areas to set the exit criteria of a trade. As the vital roles were described above, it’s necessary for a trader to practice trading analysis with the utilization of the multi-time frame technique. This is of utmost importance to every trader to take note of.
On time frame specifications, it will depend on the trader and the type of positions to be placed. For long term investments traders can use time frames up to weeks such that major resistance and support are gotten clearer.
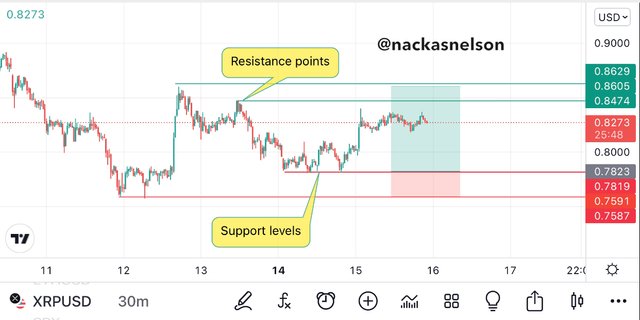
We can get better entry points by applying the multi-time frame analysis. This is done by switching the tile frame to understand different support and resistance hidden levels within our price chart. The following screenshots will describe this proves better


On the chart above the support has been identified but the position seems too large for a day trade. So we have to take it back to a smaller time frame so we can confirm tighter supports and resistance to place the stop loss and take profits in order to set our exit game perfectly.
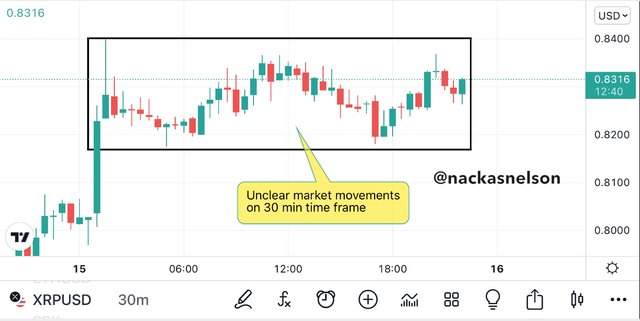
I have brought the chart to a 15 min time frame and we can see that using the multi-time frame analysis has brought us back here after unraveling the hidden support and resistance as well as our price trend identification. At this point it’s possible to set the entry and exit criteria of the trade if we wish to. A proper trade will be done in the next section.
The analysis described above is a representation of how to carry out multi-tile frame analysis on a price chart depending on the expectations of the trader.
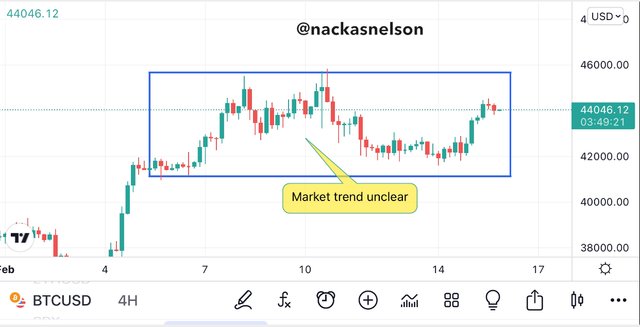
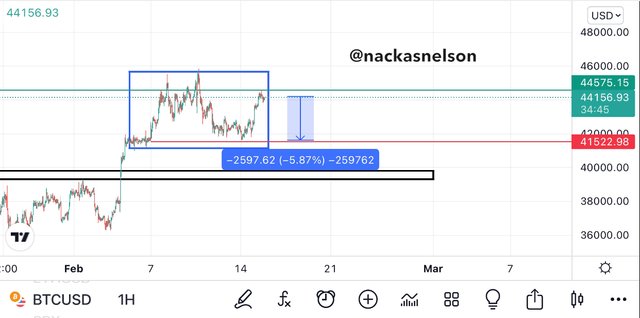
The 4h time frame chart of BTCUSD on the screenshot above doesn’t show the trend of our asset in this position. To understand the current market trend I will have to change to a higher time frame. In this case I will take the Daily chart time frame which is the next time frame to the 4h time frame.
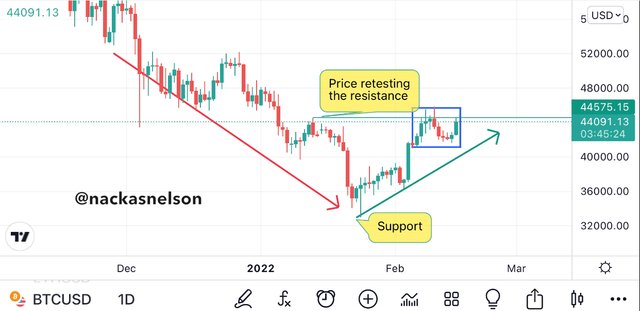
The second screenshot above shows the 1D time frame chart which is clearly showing the current market trend and that of the past. From this screenshot we can see that the price was trading in a downtrend and later hit a support so strong that the price couldn’t continue it’s movement downward and had to make a reversal.
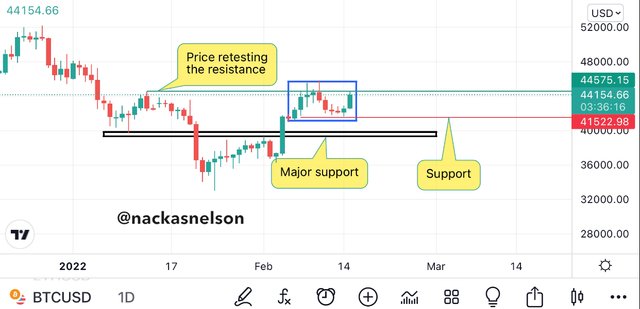
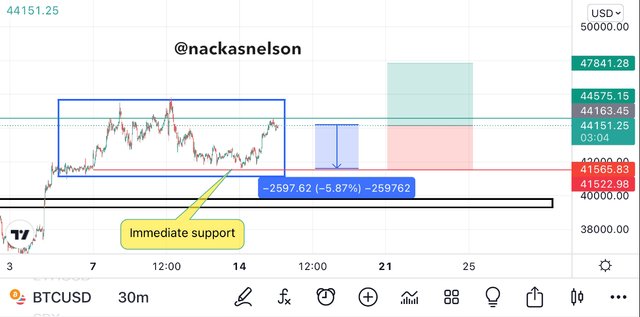
just as seen on the above screenshot, the 1D chart also shows how the price is retesting an immediate resistance just above the current candle of the day. Opening a position here will be too large and the major support below will be the main support but when we change to a smaller time frame such as 1h we will be able to use the immediate support instead of the major support that is too far from the entry.
From the above screenshot we can see a tighter support which can be used as the stop loss if we are to make an entry. This immediate support now seen on the 1h time frame was also detected during the 1D chart.
While on a 30 min time frame chart we can place an actual trade for a smaller position and we still consider the tighter support as our stop loss while maintaining the take profit at the next resistance level.

The above screenshot shows the trade results of this position of the buy trade such that the trade was already in a profit zone.
The price action method of trading analysis can help a trader out in analysing the market for any time frame possible. Unlike the fundamental analysis where you can’t evaluate the market in very small time frames. This price action method has the ability to identify the most small but significant activity on the price chart which are of interest to a trader. Using the candlestick chart is the best means of applying the price action method of analysis for a profitable trading journey. When situations look like the market trend is difficult to identify, the technique of using multi-time frames is employed. Entry and exit points are best identified and made use of through the support and resistance levels unraveled by the multi-time frame technique. The tight supports and resistance are brought to light on smaller time frames while the strong support and resistance levels are brought to light by the higher time frames.
Thanks to my professor @reminiscence01 for such a wonderful lesson on price action and this stands the fundamentals to technical analysis in trading the financial markets as a whole.
Hello @nackasnelson, I’m glad you participated in the 2nd week Season 6 at the Steemit Crypto Academy.
Unfortunately, it is observed that you have used @tipu which is a bot account to build your reputation. We encourage students to build their reputation organically by publishing quality content.
Similarly, you seems to have the same chart with @acbaby . Can you explain that?
https://steemit.com/hive-108451/@acbaby/trading-with-price-action-crypto-academy-s6w2-homework-post-for-reminiscence01
Remark : Homework Task Disqualified
Unfortunately, after our checks and investigations, we found that your account is an alternate account for @acbaby. There are similarities in content between users - @nackasnelson & @acbaby.
Operating an alternate account to earn a disproportionate reward is a flagrant violation of Steemit Cryto Academy. Hence, you are now blacklisted.
Thank you.
Cc:@steemcurator01