[ Crypto Trading with Moving Average ]-Steemit Crypto Academy | S6W2 | Homework Post for @shemul21


The moving average is a set of indicators which are set to operate by giving accountability to the average price fluctuation of an asset over time. This group of technical analysis tools works almost the same but have different intensity in operations. They are widely used in the analytizing price charts in order to make entry and exit positions. These are trend following indicators that are moving with the price in a particular diekention such that they stay close or away fe the price depending on the aspect of their set up or the momentum of the market trend.
The moving averages is an acronym of its activity such that they represent an average of the price movement. So the moving average is a representation of the actual price of an asset as a particular scale and point in time. By this we can say that the moving average indicators are good for trend identification, trend reversal and also for discovering good entry points on the chart as well as developing an exit criteria for a trade even before placing the trade. The screenshot below shows an example of a type of moving average known as the Simple Moving Average. We see that the higher the period of the moving average the further it gets away from the price itself. This can be seen on the chart below for a 100-day Exponential Moving Average.
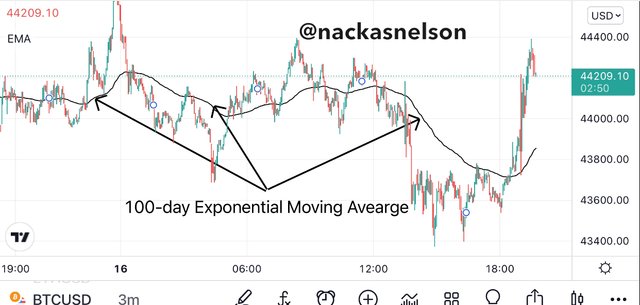
The moving average indicators have different set-ups and they can be customized differently. The set up of each indicator (moving average) depends on its method of calculation. When the moving average is customized at a higher period (length) such as the 100-day Exponential Moving Average (EMA) we will notice that the price will trade a little far from the moving average line. Whenever the moving average line is below the price we consider the asset to be in a bullish market structure and if it’s far away too much from the moving average line we know that the bullish momentum is strong enough. On the other hand, whenever the price trade below the moving average line we know that the asset is in a bearish trend and if it’s far from the moving average line we consider the bearish momentum to be strong. This way we can use the moving average to track price movements of different cryptocurrency assets.
Therefore we now see that after setting up our moving average we will have a graphical representation of the average price of that asset traveling in the form of a single line across the price chart from left to right. More than one moving average can be added to a chart for different analytical purposes which I will describe bellow. The general idea should be that whenever the higher period moving average is above the smaller period moving average, the price should be in a bearish trend and the reverse is for a bullish market.
The are different ways of calculating the moving average price of an asset on the price chart. This means of calculation has subdivided the moving average into three categories. All these moving average types deals with the average price movement of an asset for a certain period defined by the trader setting up the configuration of the indicator. The three different mode of calculations includes the simple determination of the average price, the weighted average, and the exponential average determination.
Like o said above, the moving average differs depending on the mode of calculations applied to get the average moving capacity of the price of an asset. The subcategories of moving averages are Exponential Moving Avearge (EMA), Simple Moving Average (SMA), Weighted Moving Average (WMA). Below follows with the description of each of this subcategory.
This is the moving average that is determined by the calculation of the normal average price fluctuation of an asset on the price chart. This is done in an interval known as periods.This moving average is plotted on the price chart as a dynamic line representing the true average price of an asset. With the consideration of all little drops and increase in price taken key note of, this moving average type takes record of every small price change such as that of the candlestick chart it will be affected by every single candlestick. This makes the SMA the true average price of an asset and is very good for long term analysis as it readily shows a grand style of the price fluctuation.
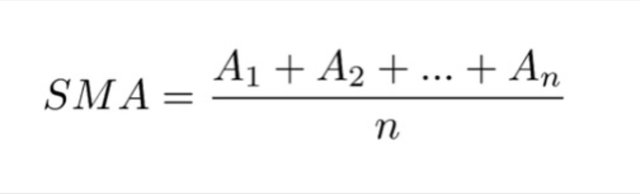
As can be seen on the above screenshot, the SMA has a formula with mainly two parameters which are the price/data in a given period of time (A) and the length (n)
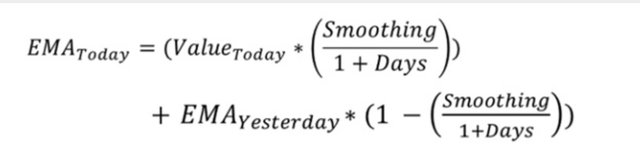
The second category of the moving averages is the Exponential Moving Avearge. Like I said before, all the moving averages are almost the same but they differ in the means of calculation. The EMA also tracks the movement of market price on an average value but with the application of a more complex mathematical criterial. For its enhance mathematical calculations has made it reachable to analyze in very small scales such that it can tracks prices very closely. It gives a precise information about the price change but is also represented by a line often acting as support and resistance on the price chart. The EMA is known to give more market opportunities to the trader when used on a smaller time scale. Identifying price fluctuation is so easy when using the EMA indicator such that in a ranging market it still provides the trader with good entry opportunities and a defined exit criteria as support and resistance are seen to occur more frequently. This moving average is calculated using the following formula:
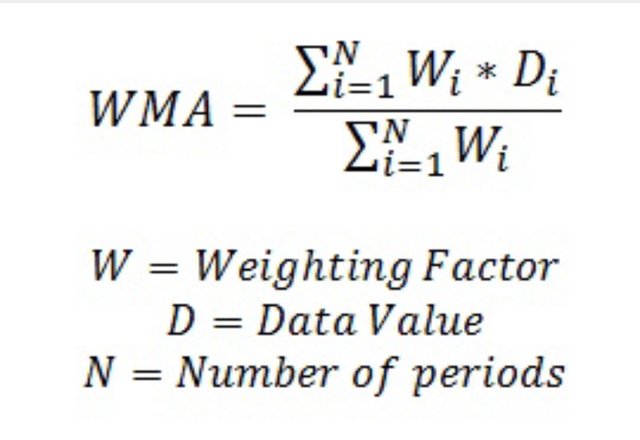
The weighted moving average is that which focuses on the statistical analysis of the greater and smaller price change. This measures the greater price change to the current data to the lesser price change to the previous data. Therefore this stands as a ratio measure of these parameters. With its model of calculation, the WMA uses mostly the current data of the price action to draw up a moving average line on the chart. The WMA uses the multiplication of the price of individual price bars or candlesticks to a common weight ratio or percentage such that it sums up to 1 or 100%. This lands the WMA to be the most descriptive moving average but commonly uses the current data only. The formula for calculating the WMA is given by:
Despite the same working purpose of the moving averages, they tend to have certain differences which sidelines them to specific purpose and restrains their uses from covering all other sectors in which moving averages can be used. I have addressed these differences in a tabular manner below.
| SMA | EMA | WMA |
|---|---|---|
| The SMA is good mostly for long term analysis | mostly accurate for short term analysis such as intraday trading analysis | Good for trading analysis of recently listed assets on exchange platforms such that it uses the recent data |
| Higher periods are the best for analysis | The lower periods (length) are considered best | Good for higher and lower period analysis |
| Uses the highest values and their average | Uses today’s values and their smoothing | Uses the recent data only |
| Takes the total average over the provided length chosen by the trader | The EMA gives attention to the average of the recent market value | The WMA only uses recent data as a prerequisite for its activity |
The moving averages work sometimes as support and resistance on a chart. When the price of an asset trades and bounces on the moving average line it is an indication of the bulls or bears being unable to push the price more than the current level hence forming a support/resistance level. With such rebound points on the price chart we can take advantage of the market and make entries depending on market trends.
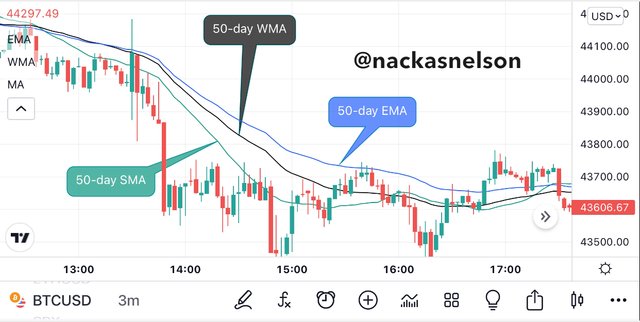
We can see the chart above containing the three categories of moving averages all in the 50-day period. We can see clearly how the EMA (in blue) on the chart touches the price as resistance level at different points.
These different MAs can be combined in any manner depending on the results expected from the trader.
If the market is too volatile such that drastic moves are made by the price, it will become more difficult to identify the current market trend and track it. We can still handle this situation with the moving averages. We can use just one moving average on the chart such as the 20-day EMA and when the price breaks the EMA above or below, we have an entry. This is seen on the following screenshot.
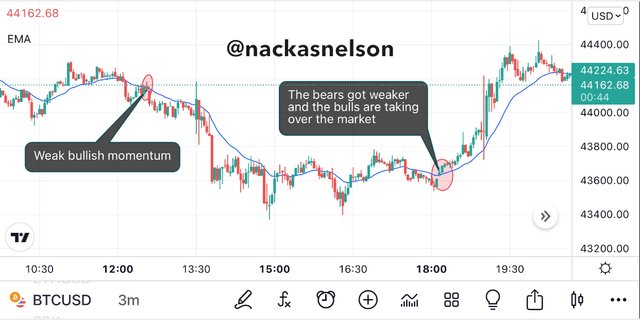
It’s clear on the above screenshot how the price moves across our 21-day EMA above and below. Let’s look closer to the candlesticks and we will see how distinct candles touch the EMA line forming possibilities of candlestick patterns that are famous for reversala and continuation. With the knowledge of candlesticks we can understand the approval of the above supports and resistance. More of this description is on the screenshot.
Due to forces acting on the market, prices will always rise and fall to a certain extent such that prices can continue in a particular direction. I’m such cases the price and the average lines will work hand in hand to close the gap between them when the price starts to sit on the EMA. We know that a support level is forming and if the EMA is instead sitting on the price then we have a resistance level forming.
The common application of the moving averages is in the activity of crossovers. This happens when at least two moving average lines cross each other on the price chart. This has an opportunistic importance to a trader. This moving average crossover technique is more of an entry and exit criteria on trading analysis that utilizes the MAs. A good example of a crossover is when we have a 20-day and a 50-day EMAs on the same price chart and at one point the price fluctuation causes one to crossover the other. The implication to which a trader sees as an opportunity to make entry in different directions. The smaller range EMA will be closer to the price chart while the larger one will maintain a certain distance from the chart. In this light we say that the 20-day will be the faster EMA while the 50-day will be considered the slower EMA. On the proceeding chart I will add the 20-day and 50-day EMAs on a price chart and exhibit the importance of their crossover signals.
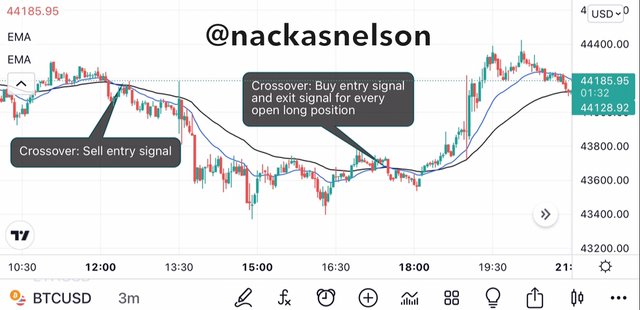
The above screenshot shows the occurrence of crossovers from the 20-day and 50-day EMAs on the price chart which all signifies good entries. It can be gotten in this simple understanding that whenever the price trades below both average lines we have a bearish trend and whenever the price trades above them we have a bullish trend. Secondly, when both ELAs cross one another we have an entry signal. Depending on the trend direction we can choose the position whether long or short.
This technique of average lines crossover is built on some few rules which guides a trader on how to handle this technique or market activities when this signals unfolds in the market.
1). When the faster EMA crosses the slower EMA and faces upward, we have an opening for a long position. We can make buy trade entries.
2). When the faster EMA crosses the slower EMA to the downside, we have an opening for a short position. Therefore we can make entries of Sell trades.
3). If during an open position, the price trades such that the two EMAs make another cross in the profit zone, we exit the market.
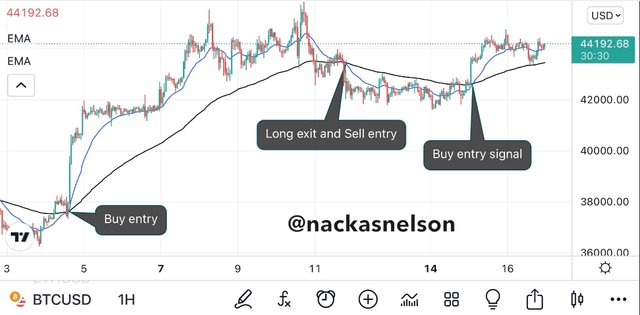
The above screenshot is that of the 20-days and 100-days EMA on the price chart. The crossover points have been marked as entries and the opposite crossover as their exit point and opening for newer trades.
During my explanation I used different combinations of the EMAs on a particular price chart but there are common EMAs used by traders to analyze the market. These are seen below.
a). 9-day and 21-day period EMAs (mostly applicable for short term analysis such as the intraday trading analysis)
b). The 25-day and 50-day period EMAs (mostly used for medium term trading analysis such as that of days to weeks.
c). 50-day and 100-day period EMAs (applicable for long term trading analysis such as that of months to years)
Depending on the analysis needed, the trader will always choose the best combination for their analysis. As the period increases so is the amount of signal that can be gotten from the analysis. Therefore the last pair will have a lesser number of entries compared to the first pair above.
The moving average indicators like other indicators have their flaws. The limitations of the individual moving average types is a different thing when it comes to the overall limitations of the moving average as a whole. I will describe these limitations in the preceding paragraphs.
Moving averages provide the trader with signals based on the price action of the market of a particular asset without taking into consideration the external activities that may affect the market price.
Different moving average lengths can provide different results. For example, a cross in the 20-day moving average is different from that of the 50-day moving average. If these precise periods are not taken into consideration, the trader may get wrong or inadequate signals.
The moving average indicator only uses past data from the price chart to bring out signals. If an asset is just from being listed, the average lines will not produce accurate results.
The moving average indicators are known to be lagging such that their signals are not ahead of the market.
The moving average indicators require a filter indicator in order to avoid their false signals. They are less accurate when not used in confluence.
The moving average is an average measurement of the price action of an asset such that it’s plots ok the price chart as a line running from left to right hand side of the price chart. This set of indicators have subcategories that springs up from their different mode of calculations. When applied well, the moving average can be a very good indicator for trend following, reversals and also a good tool for setting up trade exit criteria.
Moving averages work as support and resistance levels in the price chart and also when more than one moving average is placed or added to a chart crossovers may occur and this becomes more of opportunity openings for the trader. Thanks for reading through my homework task, hopefully I was able to dish out what my professor thought throughout the leason