Steemit Crypto Academy Season 4 Week 2 - Beginner's Course | Technical Indicators. | @nachomolina2
1. a) In your own words, explain technical indicators and why it is a good technical analysis tool.
Introduction
The objective of a trader is to make successful buy and sell operations with a solid profit margin, therefore, his philosophy is based on the detailed study of the market to find a favorable possibility of "entry", where he can place his order and it will be executed smoothly according to the expected.
In this sense, technical analysis is the stock market study taking into account graphic patterns that define the investor's psychology in order to detect a behavior with a high probability of being repeated in the future.
Image created by the author, Steemit logo

Technical indicators
They are tools of stock market analysis that allow the price of an asset to be monitored, facilitating the understanding of the market and its future evolution.
An indicator consists of a series of graphical statistical data that mainly take into account the opening and closing prices of an asset, as well as the highs and lows of a session to provide results that can guide trading towards financial success.
The results offered by the indicator analyze the progress of the trend of a crypto sending signals to the trader about the current state of the asset and whether it is overbought or oversold, which is extremely useful when trading and can make timely decisions to significantly reduce a possible margin of loss.
In general the indicators act as a support tool for the management of cryptocurrencies and not as an exclusive, definitive or conclusive guide of the technical analysis, it is advisable to use more than one indicator to make the study as this allows to compare results and confirm possible changes in trend.
"It should be noted, that the indicators are sensitive to fluctuation and the readings offered are affected by the volatility of the trade, in such a way, that they could come to emit false signals at a given time according to the programming given by the trader or the sudden and unexpected changes that may be in a market."
Why is it a good technical analysis tool?
Because it serves as a support to interpret what is the momentum of the price of an asset when you want to explore a market in search of an investment opportunity.
Prices are a variable that is in constant movement, therefore, the indicators are a good tool for monitoring taking into account the transactional history to predict a possible pattern of future behavior.
Another advantage of an indicator is that it is based on the analysis of the price in real time according to the buy-sell orders placed in the market, therefore, the use of this tool gives us a true notion of the price allowing us to have control of our investment with the management of reliable data that are in progress.
"In general, indicators are good because they adapt to each type of trader, there are so many, enough to choose from; Some provide signals to detect volatility, others establish the trend, the relative strength of the price or momentum, making the trading activity simpler and taking care of performing the complex mathematical calculations that derive from technical analysis and chartism."
Example:
"If I am at an exchange looking for an opportunity to enter the market, perhaps I could guide myself by watching the buy and sell orders and try to select an asset according to the movement or speed with which they are executed. Likewise, I could look at the candlestick chart to detect patterns that may repeat themselves. If I have some knowledge in technical analysis, perhaps, performing support and resistance calculations would help me to predict possible trend changes and make confirmations. Ok, although all these parameters are very important for the study of an asset, it also requires a great deal of training, experience and solid knowledge to carry out such a study, which in the end, takes away an important time in our attempt to find an entry point to the market. On the other hand, if we set up some indicators to the candlestick chart and establish the most recommended parameters for optimal performance, then we could obtain all this necessary information for an effective and timely follow up. We would take more advantage of the investment time and simplify the activity mostly. Even any trader, regardless of his experience or level of knowledge, could use the indicators to quickly detect the progress of the trend of the asset. Without having to make extensive and complicated calculations. This puts at our fingertips a set of adaptable, easy-to-use tools (indicators) that would help us understand trading through strategic comparative signals that broaden our trading experience and in turn leads us to be more productive in trading by acting with certainty and speed."
Always remembering that indicators serve as a support or complement to the technical study and their function is to offer us "clues" (signals) of the progress of the price of an asset and of changes or situations that are about to happen.
b) Are technical indicators good for cryptocurrency analysis? Explain your answer.
Of course yes, technical indicators are an excellent support tool for cryptocurrency analysis.
When we do trading we must select some crypto and study it in detail with the intention of investing, in such sense, technical indicators help us to visualize graphically the price of the asset and track its fluctuation as a function of time taking into account the transactional history.
In this way it is possible to estimate or predict the future price and find an entry point, or exit point, as the case may be, technical indicators help us with this task.
The behavior of the cryptocurrency market is governed by human behavior before investment, this indicates that the buying and selling activity can be studied through behavior patterns corresponding to the euphoria generated in the market by speculation in the crypto environment, based on this, we find a wide range of indicators adjusted to the demands and needs of each trader.
Example
If I set out to study the STEEM/TRX pair with intentions of entering the market I would use all my knowledge in charting to try to determine the supports and resistances according to the repetitive patterns that have occurred over time. Additionally I would set up the chart, for example, the Parabolic SAR and Stochastic indicators, at time intervals of "1 h" or less, to track the latest movements of the asset and try to determine the actual trend that is in progress. In this way the indicators would help me confirm changes in price trend or momentum and send me overbought or oversold signals, which I would use to predict future price and enter the market reducing operational risk.
Finally, I would like to point out that many traders consider that using indicators is not suitable because they carry a margin of error and give false signals due to their high sensitivity for analysis to radical price changes.
However, I want to clarify according to my own experience gained in #cryptoacademy classes, that the problem is not in the indicators but in the configuration given by the trader.
"Indicators are a highly accurate computer program that performs complex mathematical calculations based on the actual market price and the sensitivity to process the data will not depend on the software itself, but on the trader's ability to give it the most appropriate settings."
c) Illustrate how to add indicators on the chart and also how to configure them. (Screenshot needed).
To illustrate this section of the task I selected in my personal account Tradingview the TRX/USDT pair to which I will add the PSAR indicator with a certain configuration of data inputs and style.
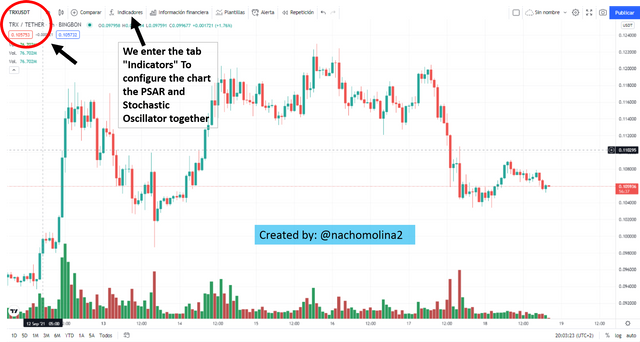
PSAR
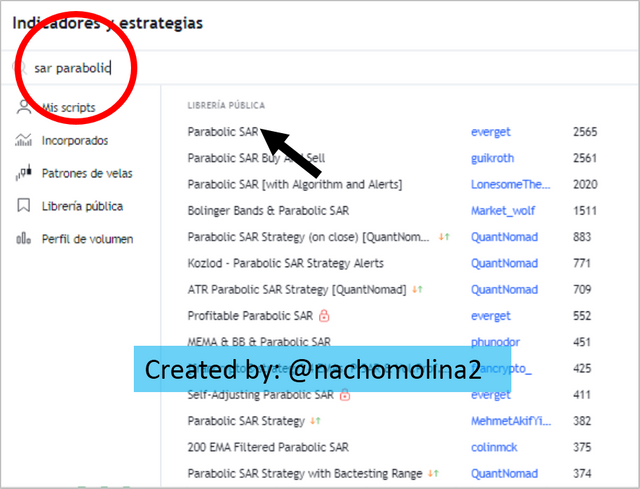
- To add the Parabolic SAR we type the name in the search engine and select the indicator by clicking on the name as shown on the screen. This will automatically add the indicator to the chart by displaying it as a dotted line.
- Below is an overview of the PSAR according to the default settings.
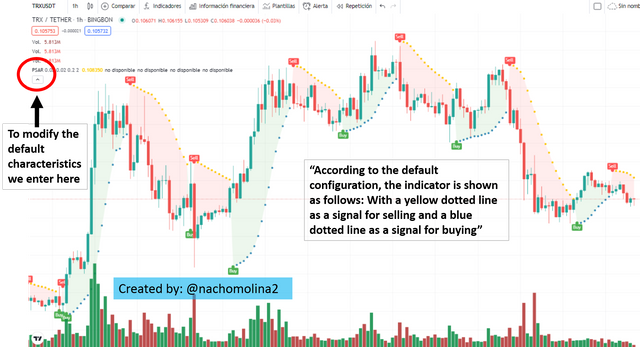
image source
- Now we proceed to configure certain visual indicator features to customize our chart.
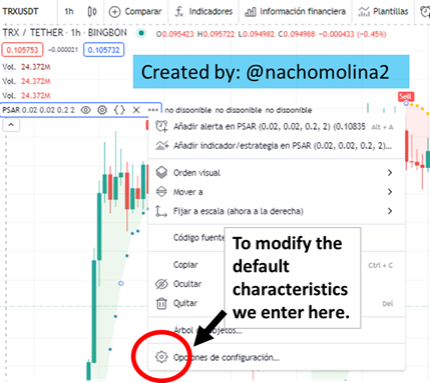
image source
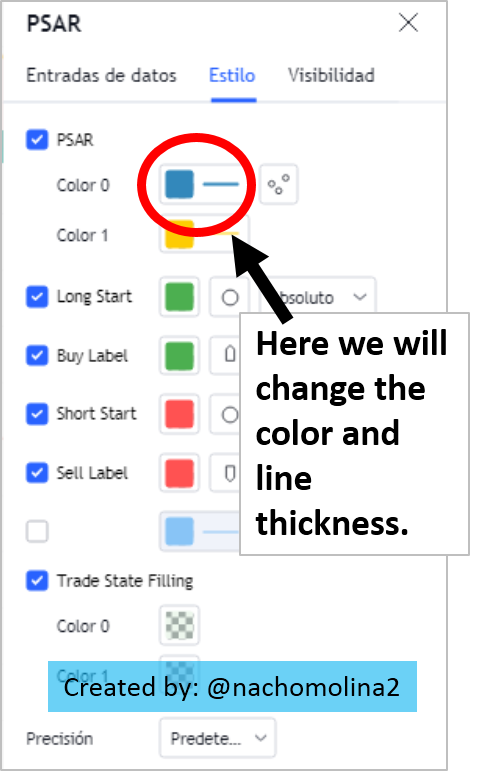
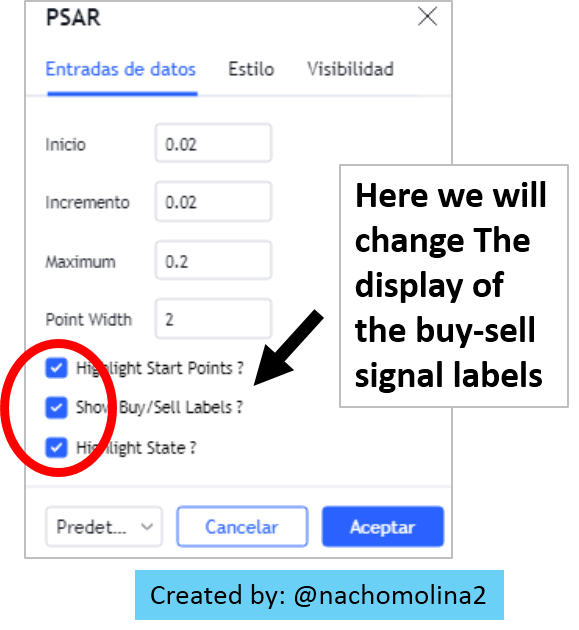
- Options are shown: Data inputs, style and visibility, where we will configure the line color and display information.
 |  |
|---|
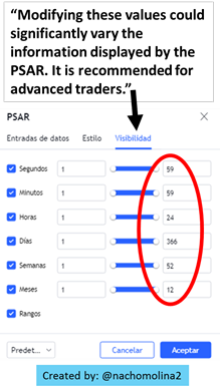
image source
Note: The other advanced features I would recommend leaving by default so as not to alter the normal operation of the indicator. Unless you are an advanced trader with extensive PSAR programming experience.
Finally, after we have added and configured our Parabolic SAR on the chart, it would look like this:
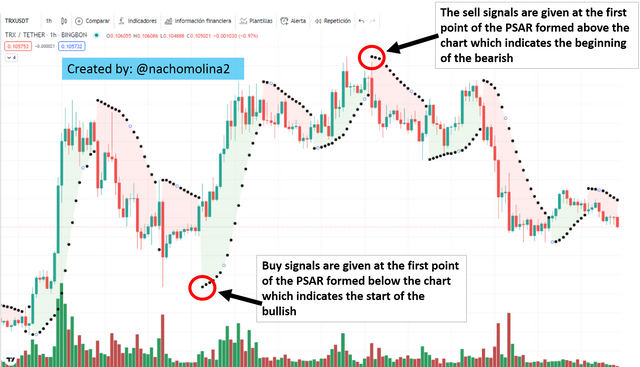
image source
2. a) Explain the different categories of technical indicators and give an example of each category. Also, show the indicators used as examples on your chart. (Screenshot required).
Indicator categories
Indicators are designed to express the price of an asset and its behavior, for this many variables and characteristics specific to the cryptocurrency market are considered. For such reason it is necessary to group them into categories according to their use and functions so that the trader can visualize on screen the information he requires according to his modality and way of seeing the trade.
- Trend-based indicators: They are those that offer information on the trend or progress of the price. They are extremely useful when entering the market and being able to identify which specific trend the asset is in at the moment. The information offered by this type of indicator is based on the average of prices according to the highs and lows reached in a certain period and thus establishes the exponential averages that can predict the future behavior of the asset. These indicators send signals that must be interpreted by the trader and can be used to make decisions on when to enter or exit the market.
Among them we can to mention:
- Exponential moving average
- Standard deviation
- Average Directional Movement Index
For example, at the moment of entering the market we can only observe the current price of the asset, have a notion of whether it is low or high, according to the information displayed on the screen. Perhaps, we will detect if at the moment there is a fall (red candle) or a rise (green candle) of the price. It will be after a "technical analysis" and a series of confirmations of supports and resistances that we will be able to know which is the trend of the asset. A trend indicator or tracking indicator helps us in this sense, showing us graphically what the price trend is, taking into account points of the transactional history such as the lows and highs reached in previous sessions to average the current price and define the real behavior of the market. This way by adding one or more trend indicators to the chart we could make timely decisions when exploring a crypto knowing the price trend for the moment."
As an example, I will take the EMA indicator, which is easy to use. When the line is positioned below the chart it speaks of an uptrend and when it is positioned above the chart it speaks of a downtrend. It is recommended to reinforce such information with a deeper technical analysis and with the joint use of other indicators.
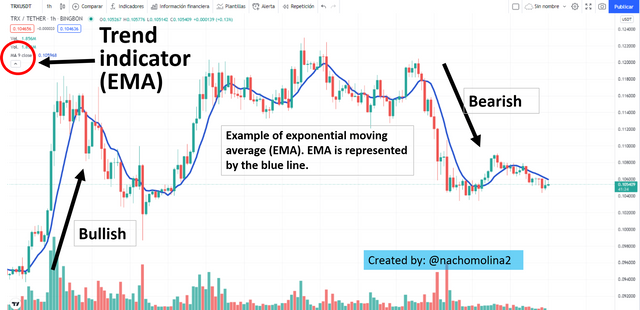
image source
- Volatility-based indicators: They provide information about the price fluctuation in the market. Let's keep in mind that short-term traders benefit directly from the ups and downs of the price rather than its long-term future behavior. In this case a volatility indicator measures the speed with which the price of an asset changes, which for some means that the higher the volatility, the faster the price change and therefore the more money is at stake and the more investment opportunities there are. Its usefulness will depend on the trader's psychology, goals or personal purposes.
Among them we can to mention:
- Relative Volatility Index.
- Bollinger Bands
- Average True Range (ATR)
By way of example, I will take the Relative Volatility Index indicator, which indicates the points where the price stops and reverses the trend radically and abruptly, leaving as a reading a zigzag graph indicating the points of rise and fall of the price.
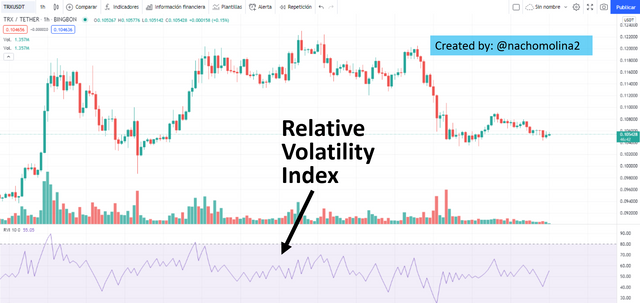
image source
- Momentum-Based Indicators: These are oscillator type indicators which advance over time leaving a progressive reading that defines the price trend and with which one can predict future positions or movements of the asset. They are usually based on the previous transactional record taking into account the opening and closing prices of the session. The intention is to study lapses of 10 to 12 previous sessions and average to get an idea of the "momentum" that the asset will take. Traders use them in groups of two or three to compare confirmations, to know what status the asset's trend is in and to continuously track a crypto.
Among them we can to mention:
- Stochastic oscillator
- RSI (Relative Strength Index)
- MACD (Moving Average Convergence Divergence)
By way of example, I will take the Stochastic Oscillator indicator, which is versatile and indicates the overbought and oversold points of an asset. It uses two moving averages to plot the results offered and is highly predictive when used with another indicator, being of great help for technical analysis.
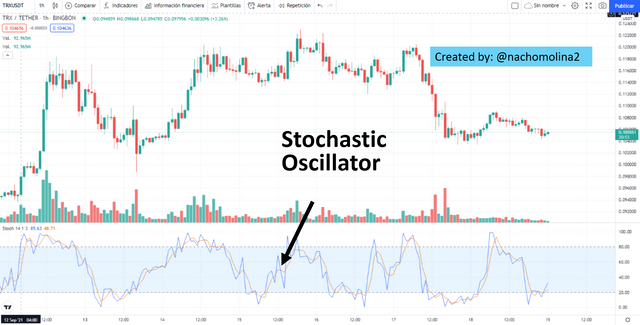
image source
b) Briefly explain the reason why indicators are not advisable to be used as a stand-alone tool for technical analysis.
The explanation is that indicators do not provide conclusive results or complete expressions of the price of an asset. They only give signals of the behavior of a crypto in the market for a specific time interval, therefore, taking into account that the virtual asset market is highly volatile requires a more complete study that the "Indicator" alone cannot offer.
Similarly, it should be noted that an indicator is a computer program that performs mathematical operations and statistical calculations, for this purpose will be the trader who is responsible for the proper configuration of the same for each stock market scenario that is at a given time.
The fluctuation produces drastic changes in the market and without previous warning, this condition affects the logic of procedures that the indicator uses and can drag certain margin of error or send false signals for a certain cryptographic scenario.
For these reasons it is not advisable to use only the indicators, but to accompany them with technical analysis or other trading tools.
c) Explain how an investor can increase the success rate of a technical indicator signal.
The way to increase the success rate is by giving proper settings to the indicator. By increasing your knowledge in the area of cipher so that you can come to discern between the results offered by the indicator and the true reality of the market.
In the same way you can increase your success rate by using several indicators (I would recommend two or three) at the same time, each one highlighted in a specific function and with the configuration that guarantees the highest performance.
In the same way, do not get carried away by the preliminary results of an oscillator but test them for a period of time until you find the most suitable configuration according to the type of investment you want to make.

Image created by the author, Steemit logo
Cc: -
@steemitblog
@steemcurator01
@steemcurator02
@reminiscence01
Original content
2021
Twitter:
https://twitter.com/addverso/status/1439369110274691076?s=20
Hello @nachomolina2, I’m glad you participated in the 2nd week Season 4 of the Beginner’s class at the Steemit Crypto Academy. Your grades in this task are as follows:
Observation
This is correct. Proper configuration of the indicator with recommended settings helps improve the signal given by the indicator.
Recommendation/Feedback:
This is a thank you for completing your homework task.
Thx professor!