Crypto Academy Week 16 - Homework Post for [@kouba01] cryptocurrency trading for Bollinger band
question 1
Bollinger Bands was developed by John Bollinger, a famous Technical Analyst. It is a powerful indicator that measures how LOUD OR QUIET a market is one how high or low the volatility is
The calculation method in the Bollinger band is the moving average which is = total amount of price over a specific amount of days.
A moving average of 20 uses a standard deviation(volatility) of 2
Bollinger Bands allow a moving average to be centered around the upper and lower band serving as support and resistance, the upper band serves as resistance while the lower band serves as support.
The upper band is calculated by adding to 2 deviation to the moving average while The lower band is calculated by subtracting 2 deviation from the moving average.
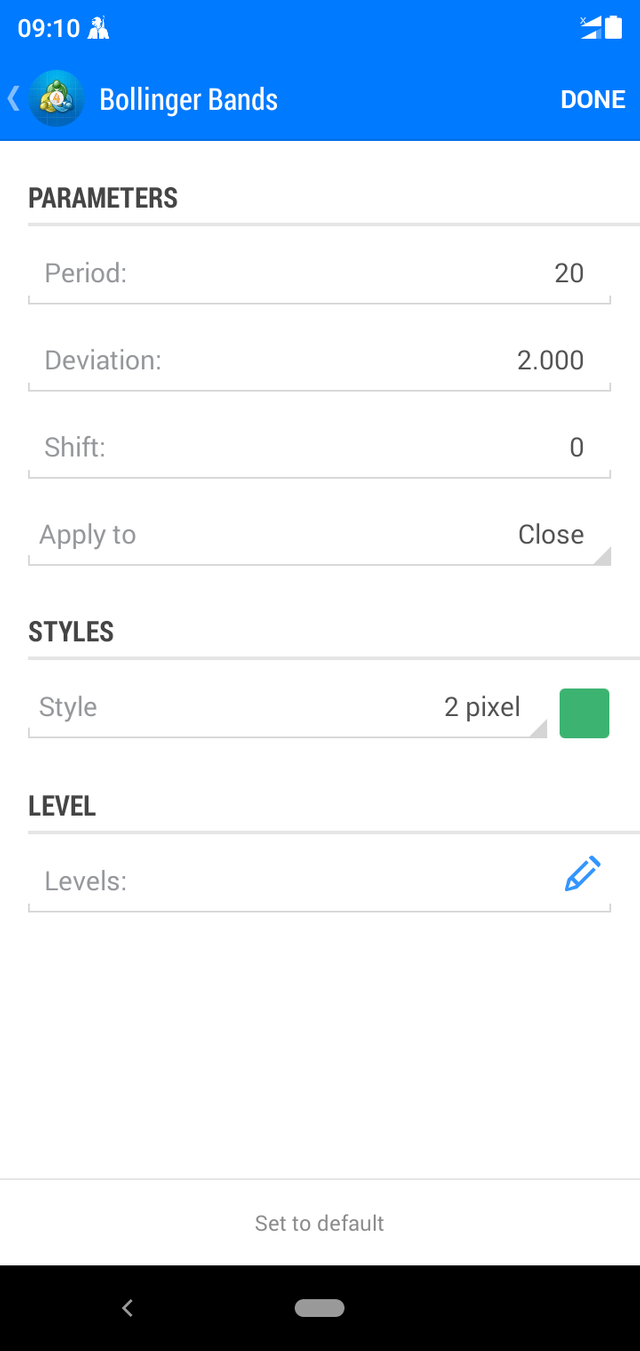
The best Bollinger setup to use is the default settings cause It turns out that with this type of setting price stays within these bands if you using the default setting.
by default
*Period: the period is 20 which means the last 20 candle stick
*Apply to: is in close cause it uses the closing price to determine the M.A
*Deviation: By default, it is 2 which means double of the deviation.
*Shift: it is 0 which means the number of candles before the graph, so the fact it's in 0 then no candle is ahead of the graph
###question 2
Bollinger bands studies the volatility in the market if it's low or high at the moment. There are 2 strategies while using the Bollinger band.
- Bollinger bounce
- Bolling Squeeze
Since we are to talk about breakout we use the Bollinger squeeze strategy to determine breakout. When the market volatility is very low the candle sticks are very thin and short but when they are high the candlestick are thick and long.
A breakout can be defined and a drastical increase or decrease in price as a result of volatility.
Whenever a trader noticed that the volatility is very low and candlesticks are short and thin he should know there is a breakout in the corner whenever the volatility increases.
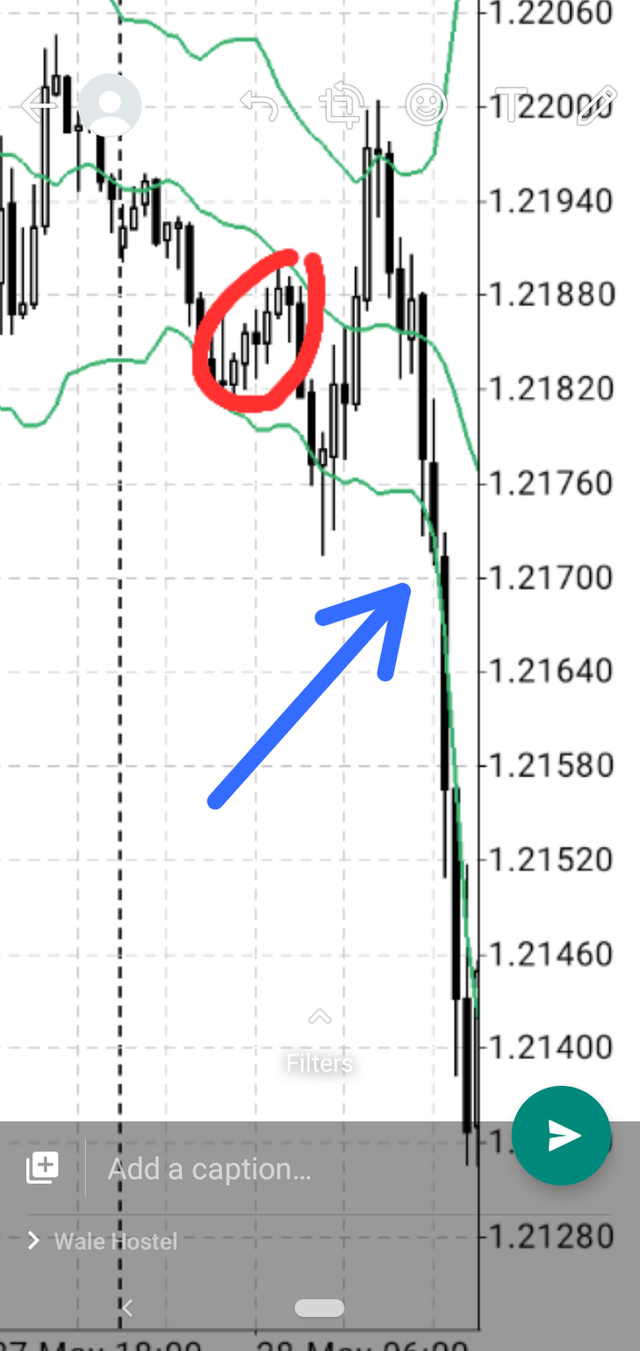
The image above is a chart of BTC/USD on a 30mins time frame, you could notice low volatility in the place I circled red because of the state of the candlestick stick and we later saw the outcome,the price dropped drastically.
The best way to trade the Bollinger Squeeze method of by using the "CALL LEVEL APP" it's an that notifies you when price breaks the squeeze (breakout) even when you are not active on your trading platform.
how to use the call level app
you take the price of the upper band and add 10 pips to it, take the price of the lower band and subtract 10 pips from it,
. enter you call level app
. Click on cryptocurrency or Forex depending on what you want to trade
. Select the pair you trading
. Input your upper band and add it so the app will notify you when price reach this level do the same for the lower band too and add it so it will notify you When price reaches this level.
. So we have 2 alerts set now so one of them will definitely trigger and the call level app will notify you when it's does
the upper and lower band you input is after adding and subtracting the 10 pips form it.
We add and subtract 10pips cause if it breaks the band and also reaches the added 10pips price it means price will definitely rise even more and if it reaches the subtracted 10 pips of the lower band then price will still fall.
question 3
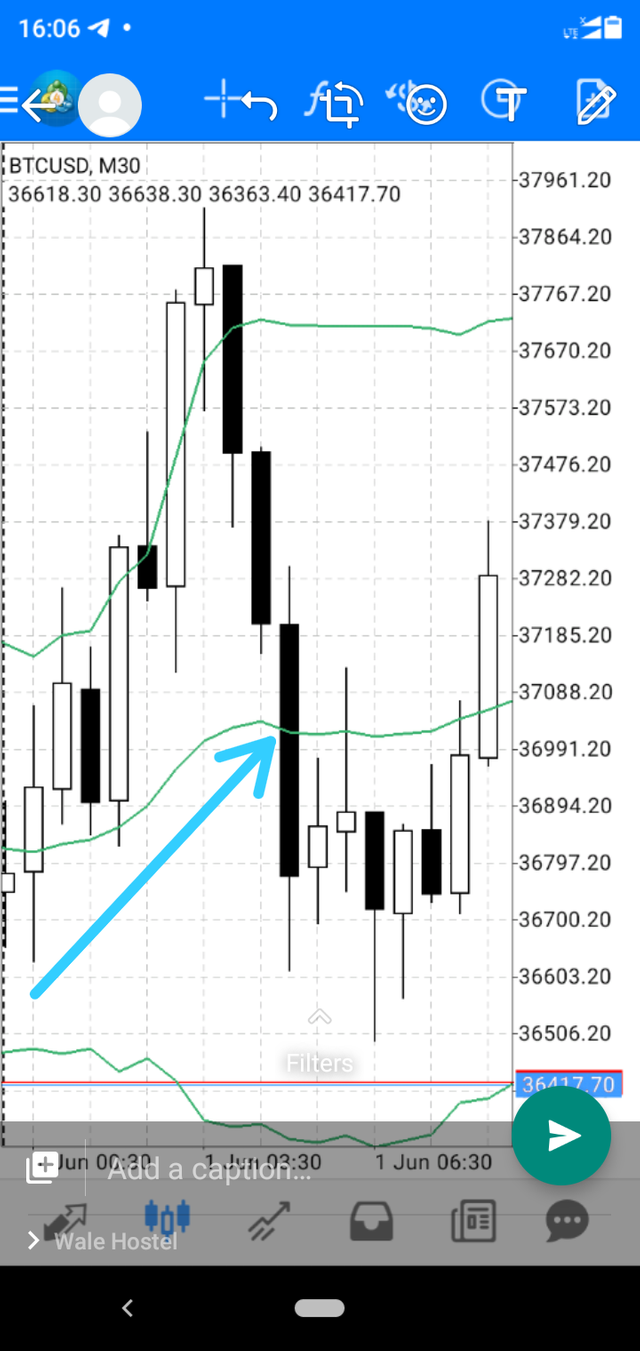
It helps in a trending market cause it helps to know when the trend changes or when a trend will stop, if more than one candlestick appears outside of either upper band or lower band means 2 things the trend could either stop or reverse.
If the candlestick is outside the upperband the upward trend could either stop or reverse likewise a downward trend if it's formed outside the lower band the downward trend will stop or reverse.
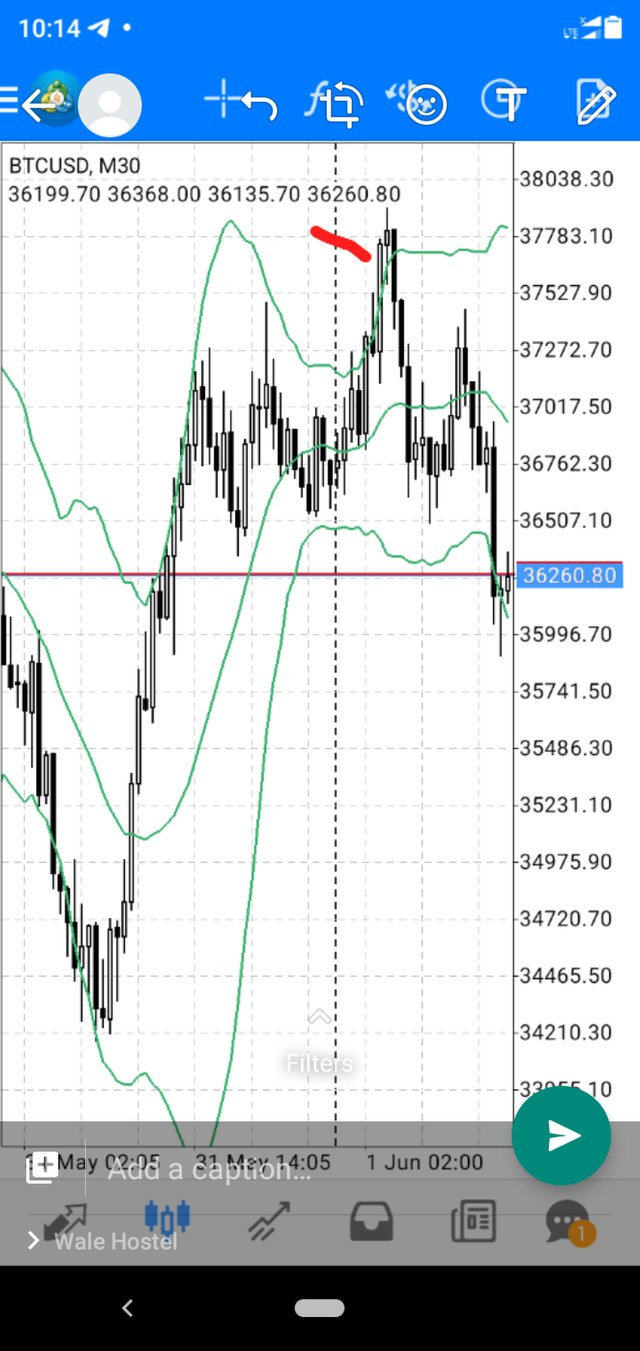
The image above is a chat of BTC/USD on a 30mins timeframe. The candlestick I pointed red formed outside the band which helps us to know that there would be a reversal and that the upward trend will stop.
question 4
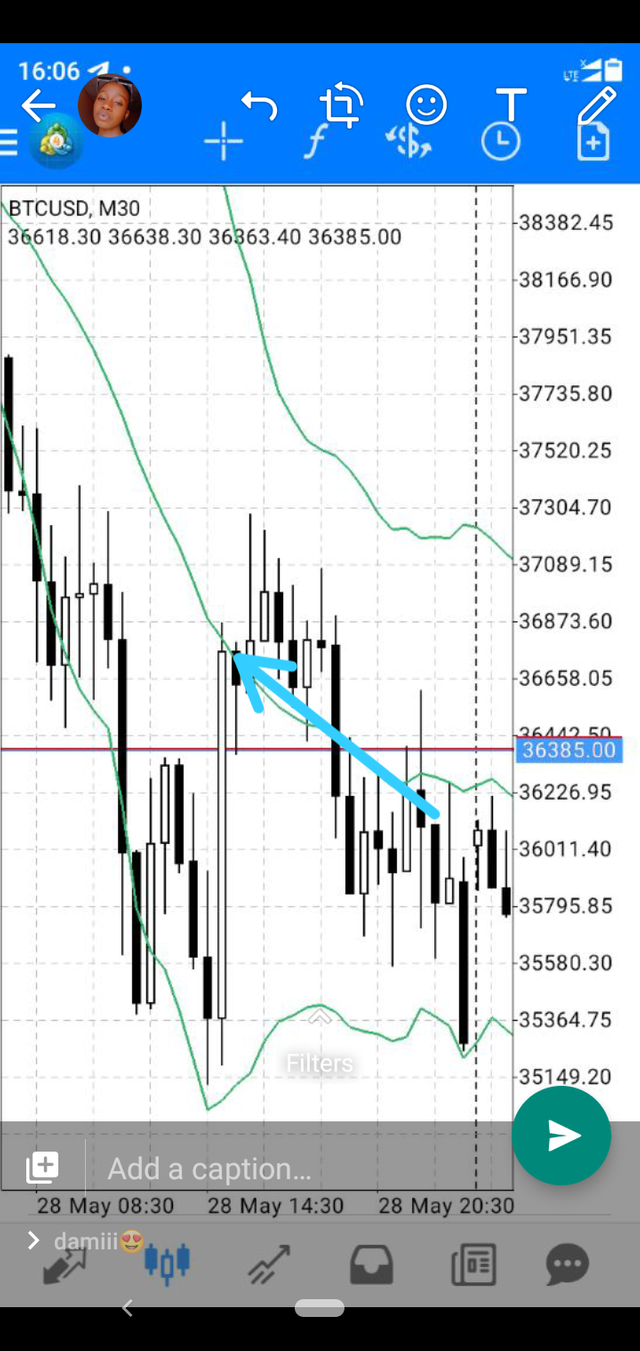
Relative strength index is best to use with the Bollinger band indicator because it helps to determine the oversold and overbought region. In order to use the relative strength index RSI with the Bollinger band you have to check for when the overbought( 70 and above) or the oversold region(30 and below ) of the RSI corresponds with the low volatility in the Bollinger bands.
If RSI is in an over bought region and the volatility is low at the moment that means price will definitely drop and when the RSI is in an oversold region and volatility is low the price is definitely going to rise.
You could also use more indicator because one can never be so sure and again the more confirmation the better.
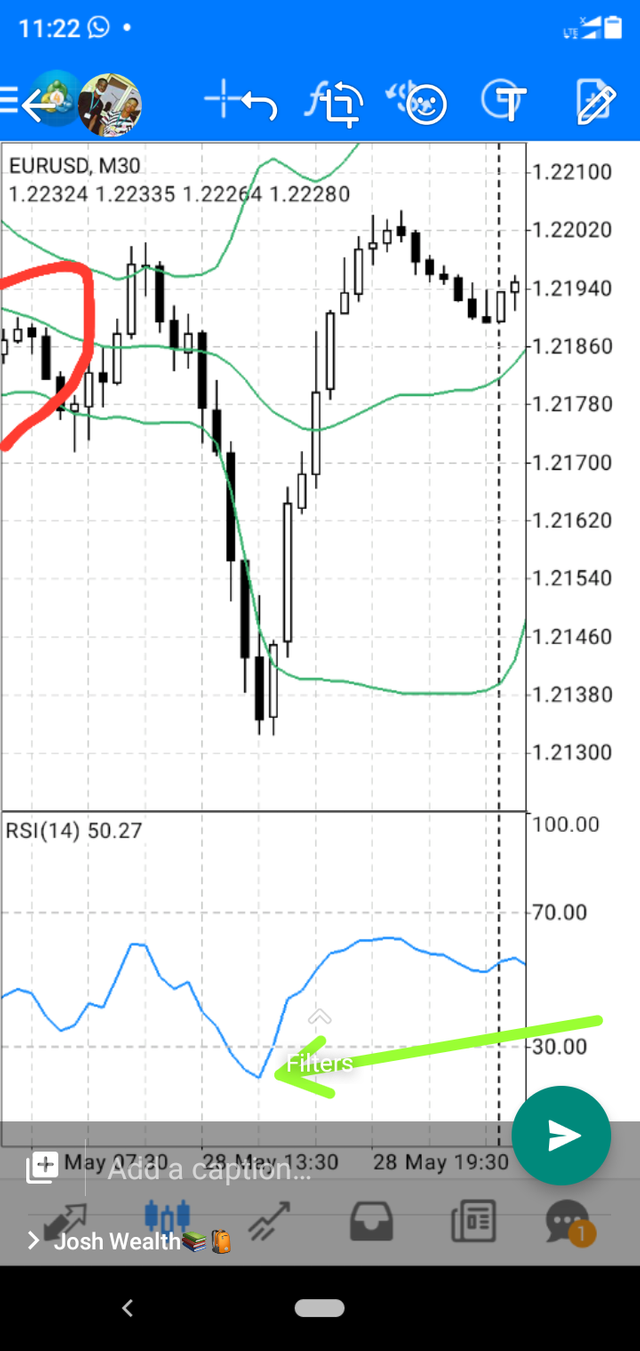
In the diagram above. We could see previously in the bollinger band that the volatility was low cause of the short and thin candlesticks so when price went to the oversold region in the RSI, that was a confirmation that the price will rise which eventually happened.
question 5
For the Bollinger band strategy you can use anytime frame using the Bollinger band it just depends on the type of trader you are whether a long term trader, short term trader or a swing trader but the founder of the Bollinger band John Bolling encouraged the use of the 20days time frame. The Bollinger band is made up of 3 bands the upper lower and the middle band. once deviation of 2 is added to the upper and another deviation of 2 is deducted from the lower band then drawing the band is easy.
question 6
Using the bollinger bounce strategy
Immediately the market reaches the lower part of the bands (Lower Band), You BUY and set your TP at the price that aligns with the middle band.
Also, when the price rises to the Upper Band, immediately SELL as it starts to bounce off downwards and set your TP at the Middle Band.
It's just as simple as that!!!
In the image below when price reached the upper band it bounced back to the middle band
In the image above when price reached the Lower band it went back to the middle band
And the Bollinger squeeze strategy like I said earlier in question 2 the Bollinger squeeze helps in trading breakout . The longer the squeeze or longer the low volatility takes place the higher the massive the breakout
In the diagram above the place I circled red shows the squeeze and you can see the breakout after its so massive.
conclusion
The bollinger band strategy is a very good indicator to use in predicting price
It also helps us to know how load or quite the market is in terms of volatility
And they are to be used with the RSI for better confirmation.
Thanks you sir @kouba01 for this great lesson I feel like I can't lost a trade no more
#kouba-s2week8 #cryptoacademy #bollingerband #steemit #steemexclusive
Hello @mykhell007,
Thank you for participating in the 8th Week Crypto Course in its second season and for your efforts to complete the suggested tasks, you deserve a 6/10 rating, according to the following scale:
My review :
An acceptable article of content in which you have done the various tasks required. What is missing is the in-depth analysis of the various signals by taking clear examples, with no useful additions, such as tracking the price movement of the pair, which is the main goal of using technical analysis indicators. Try to organize more article to give it more aesthetic.
Thanks again for your effort, and we look forward to reading your next work.
Sincerely,@kouba01
I actually expected more sir
But thanks anyways @koubal01