"[Trading Using Rectangle Pattern] - Crypto Academy / S5W4 - Homework Post for @sachin08".
INTRODUCTION
Hello guys!!
I'd like to welcome you all to the 4th week of season 5 of the steemit cryptoacademy. Professor @sachin08 gave a fantastic talk on Trading using Rectangle Patterns that was very detailed and easy to grasp. The following is my lecture homework assignment.

NO.1 EXPLAIN RECTANGLE PATTERN IN YOUR OWN WORD.
Rectangle patterns, in my opinion, are another type of technical analysis pattern that traders use to predict market price. They are made by placing a horizontal line at the top as a resistance point and another horizontal line at the bottom as a support point.
It's important to note that we can't merely draw rectangular patterns without first identifying them on the chart. This is most commonly seen in the range market. When the price travels up and down without following a specific trendline (uptrend or downtrend), the rectangle pattern can be drawn by placing the resistance line at the top and the support line below the trend.
In other words, we should be aware that the rectangular pattern can be generated in the chart in two ways: at the top, which is known as rectangle top, and at the bottom, which is known as rectangle bottom. Traders can forecast which trend will occur based on these two factors: either buyers will take over the market or sellers will take over the market.
Also, we should be aware that when a rectangular pattern breaks out, we should be aware that a specific trend is going to emerge, either up or down, following a ranging movement in the market price.
A rectangle pattern is a rectangular combining range in which market prices move around or perambulate, indicating that the buying and selling intensity is equal. The price could now technically breakout between the two directions. Traders can use rectangle patterns to trade breakouts.
NO.2 HOW TO IDENTIFY RECTANGLES. EXPLAIN WITH SCREENSHOTS.
Professor @sachin08 stated in the lecture that rectangles are rare and difficult to locate in pricing charts. Rectangles can be found at either the top or bottom of the chart. Now we'll look for a chart that forms a range market, which means the price can't go above or below a support or resistance level, and the movement must be equal. This demonstrates that both buyers and sellers are equally in control of the market, with a battle raging over who will take over the market price. To locate the rectangle, we must first draw two trendlines, one at the top and the other at the bottom, which function as support and resistance levels, respectively. The price must hit the top horizontal line and then fall, touching the bottom line and then pulling back, and it must continue in this pattern until a breakthrough occurs in either direction. Note that both the support and resistance lines must have at least two or three touches. The screenshot I gave is seen below.
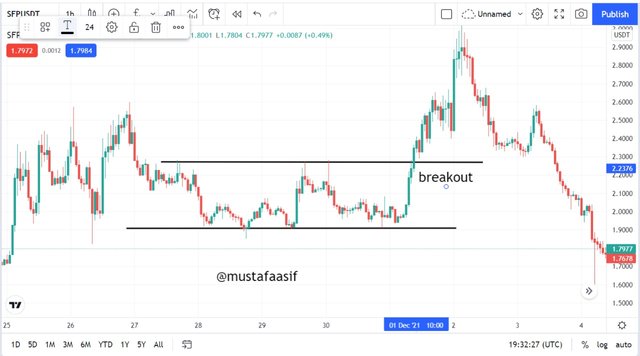
We can see the two trendlines I sketched in the screenshot above, the higher forecasting future, which serves as challenge, and the lower trendline, which works as support. We could see how the chart moved between the trendlines, indicating a balance of buying and selling forces. When you see a chart like this, you can notice or recognize the rectangle pattern.
NO.3 CAN WE USE INDICATORS WITH THIS PATTERN TO GET ACCURATE RESULTS? EXPLAIN WITH SCREENSHOTS.
Depending on the indication you're using, combining indicators after evaluating or analyzing the market with a rectangle pattern could offer you an accurate conclusion.
Let's imagine I've done my analysis using a rectangular pattern, and I've added an indicator to it so that I can get a more accurate market of how the market will move or what the next trend will be. Take a look at the screenshot I've included below.
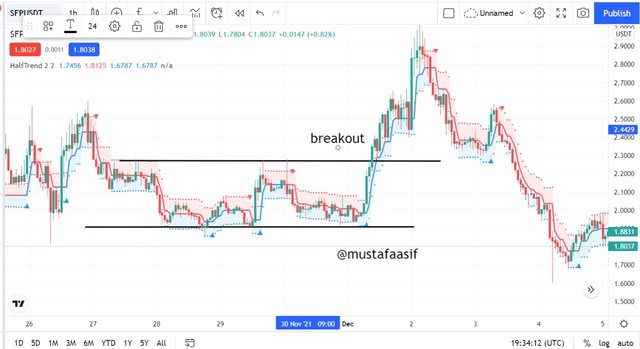
Following my rectangle pattern analysis, I added the half trend indicator, which is one of my favorite indicators to use while trading. When a blue arrow or a blue arrow emerges on the chart in the half trend indicator, traders are expecting the market to be bullish, and when a red arrow comes at the top of the chart, traders are expecting the market to be bearish.
Now, utilizing the indicator in conjunction with the rectangle pattern, as shown on the chart above, after completing my analysis with the rectangle pattern, I added the half trend indicator, which resulted in a blue arrow appearing beneath the chart, indicating that the market will be bullish. Following the blue arrow on the chart, there was a tremendous bullish trend that resulted in the resistance point being broken.
NO.4 EXPLAIN RECTANGLE TOPS AND RECTANGLE BOTTOMS IN YOUR OWN WORDS WITH SCREENSHOTS OF BOTH PATTERNS.
In a price chart, the rectangle pattern might appear at the top or bottom of the chart; each of these positions implies a different thing, which I will explain.
RECTANGLE TOPS
In a basic explanation, the rectangle top may be found at the top of the chart, establishing a ranging market where buyers and sellers cannot be above to generate a specific trend. When the rectangle pattern appears at the top of the chart after forming a ranging market, it usually indicates or warns traders that the market will turn bearish. The breakout always occurs in the support line, and when there is a breakout, the price tends to turn bearish, which is when traders typically short the market, i.e. selling opportunities. Take a look at the image below.
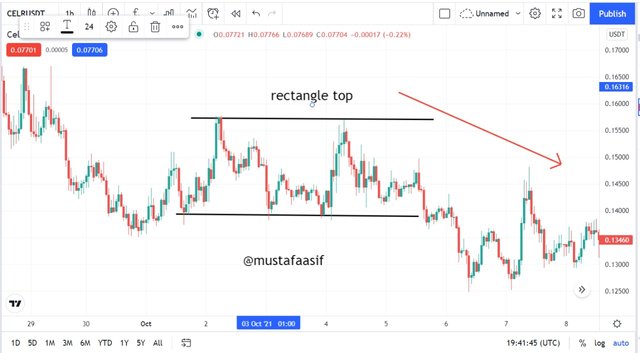
This is a rectangle topping, as shown in the graph above. You can see how the price developed a range market, with buyers and sellers unable to form a specific trend until a breakout occurred, resulting in a large bearish trends.
RECTANGLE BUTTOM
In a basic explanation, the rectangle bottom can be found at the bottom of the chart, establishing a ranging market in which buyers and sellers cannot be above to generate a specific trend. Though when the rectangle pattern appears at the bottom of the chart after forming a ranging market, it usually indicates or warns traders that the market will turn bullish. The breakout always occurs in the resistance line, and when there is a breakout, the price tends to trend up (bullish), which is when traders usually long the market, i.e. buying opportunities. Take a look at the image below.
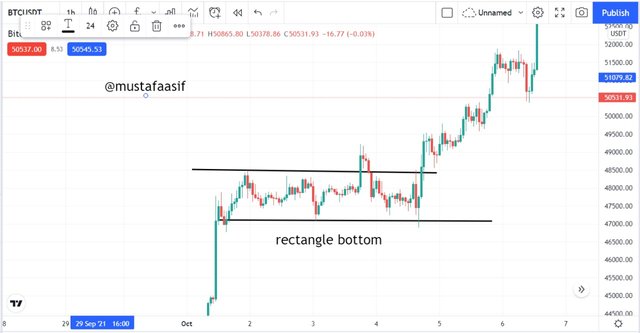
This is a rectangle buttom, as shown in the graph above. You can see how the price developed a range market, with buyers and sellers unable to form a consistent trend until a breakout occurred, resulting in a large bullish trend.
NO.5 SHOW FULL TRADE SETUP USING THIS PATTERN FOR BOTH TRENDS. ( ENTRY POINT, TAKE PROFIT, STOP LOSS, BREAKOUT)
In this section, I'll present a complete trade setup in both Rectangle top and Rectangle bottom, with my stop loss, take profit, breakout, and entry point indicated.
Trade setup using Rectangle Top
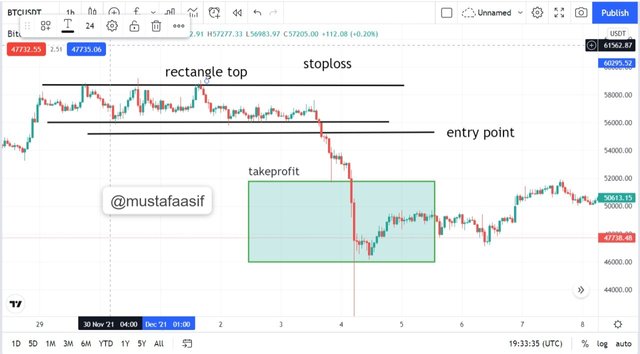
Based on the chart above, we can see that the price formed a rectangle top, which means that the price was moving up and down in the support and resistance line, so there was a breakout at 56002, and the market began to trend down. I took my entry at 55348 and then set my stop loss above my entry price because I was shorting the market, so I set my stop loss at 59720.14 and my take profit below my entry point, which is at 51800. My order will execute after the price trends down and hits my take profit, indicating that I have made a profit.
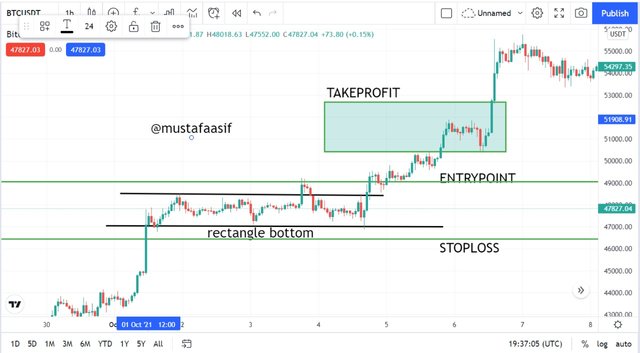
Looking at the BTCUSD chart above, we can see that the price formed a rectangle bottom, indicating that the price was moving up and down in the support and resistance lines, resulting in a breakout at 48464, after which the market began to trend up. Because I was in a long position on the market, I placed my stop loss at 46440 and my take profit at 50407. I took my entry at 49060 and then set my stoploss below my entry price. Now, my order will execute after the price trends up and hits my take profit, implying that I have made a profit.
CONCLUSION
Rectangle pattern is one of the greatest analyses traders employ in breakout trading, which is when they want to determine which way the price will move, which might be up or down. The Rectangle Pattern talk was quite informative, and I learned a lot from it. Professor @sachin08, I appreciate your efforts in the lecture and for us to learn.
Thanks for reading.
Cc-
Professor @sachin08
#club5050 #sachin08-s5week4 #cryptoacademy #steemexclusive #pakistan #chart
@steemcurator02
@steemcurator02