[Technical Indicators] - Crypto Academy / S4W2- Homework Post for Prof. @reminiscence01
Hello wonderful people, how are you today? I hope you all are good. I'm glad to be a part of this wonderful lecture. In this article, I'll share my experience with technical indicators.
so, let's get started.
source

Q1
a) In your own words, explain Technical indicators and why it is a good technical analysis tool.
Technical Indicator.
Technical indicators are intuitive or analytic calculations based on cost, volume, or volatility of an asset or trade used by traders who use trading methods.
Technical analysts and trend analysis look for technical indicators in prior asset value records to predict trade entry and exit locations.
Technical indicators include chart study approaches that can help investors recognise and respond to market activity more effectively. Methods for evaluating patterns, determining price trends, monitoring variations, and more are all available through technical analysis.
why it is a good technical analysis tool?
The reality that what a market moves up or down indicates is that a force or volumes is moving it in that way; technical analysis can assist you determine whether or not that volume exists. Whether you're weak or strong. Volume indicators, such as Volumes, demonstrate this.
These indications reveal potential resistance and supports. For example, the running average can tell us when a market response is likely to happen.
Indicators assist in the identification of appropriate entry places. For taking enters, techniques like as the golden and deadly crossing are used, as well as under or above indications to establish stop losses.
b) Are technical indicators good for cryptocurrency analysis?
It's rare to make money in the cryptocurrency market without applying technical analysis. They're available on major crypto exchanges, but newbies may find them tough to use. This is not necessary to be perplexed by indicators; all that is required is an awareness of what they reflect and what is expected of them. After knowing the reason of at least the principal signals, the trader would be ready to finish the majority of his transactions intelligently, and understanding the purpose of each transaction is the cornerstone for successful trade.
When we look at the crypto market in detail, we can see that it's made up largely of a few variables. It represents the main value as well as the values from a previous time.
c) Illustrate how to add indicators on the chart and also how to configure them:
First, we will visit a application tradingview and we will search for any coin in the marked box.
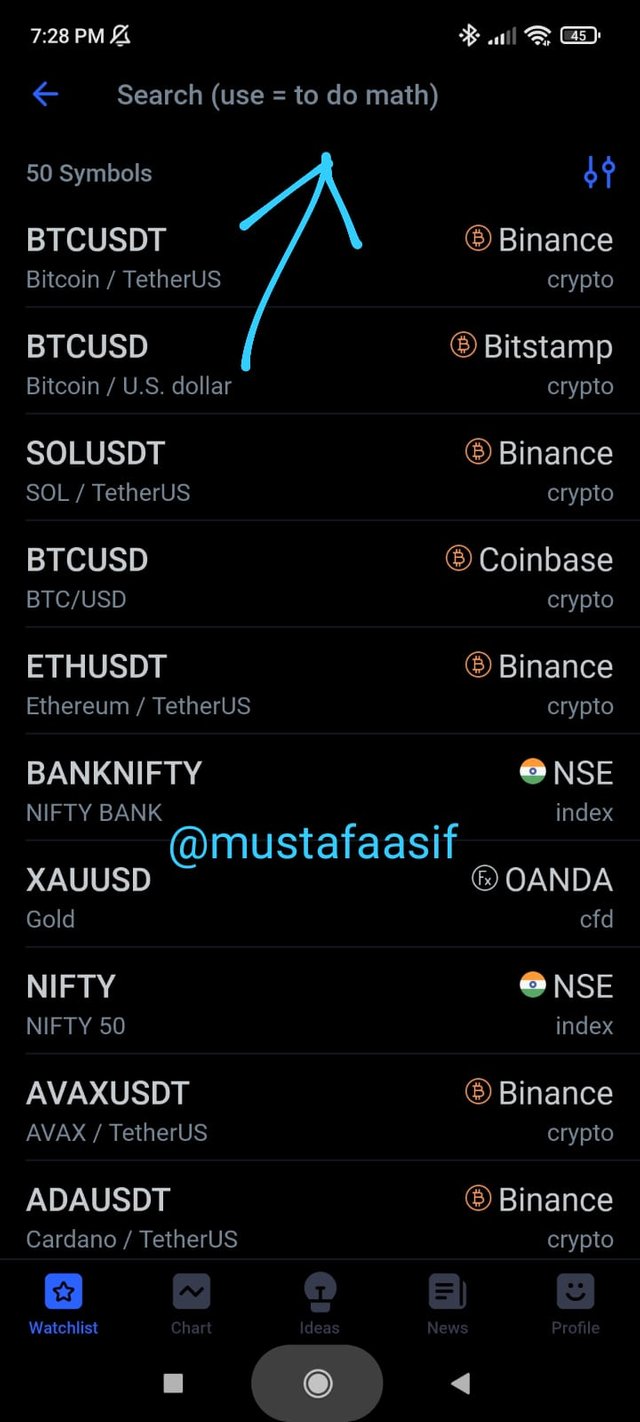
Let's take the example of ETHUSDT.
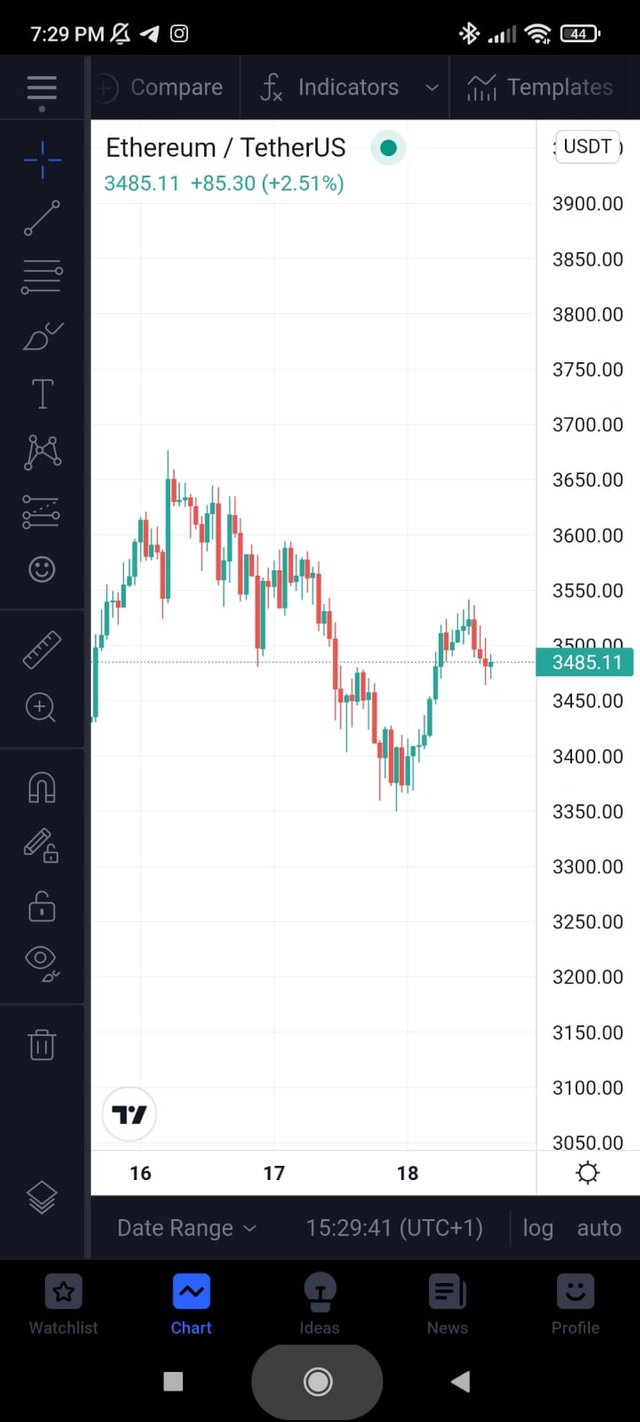
the default chart will appear like this
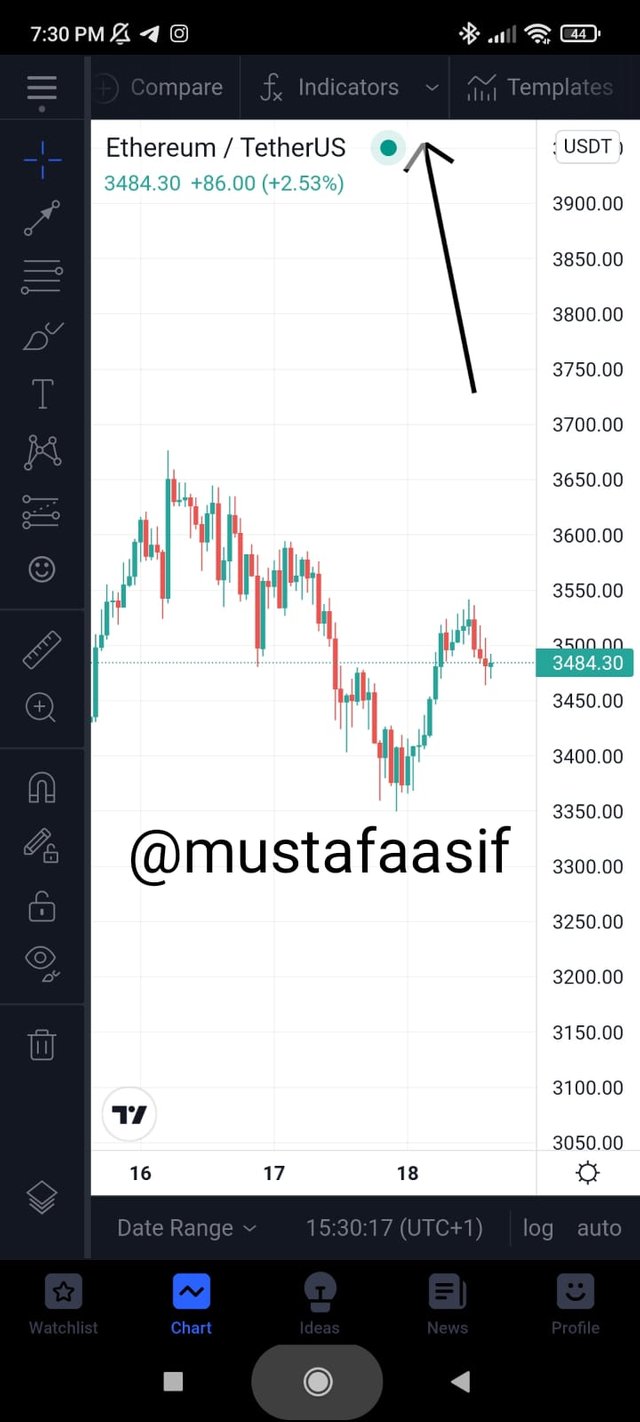
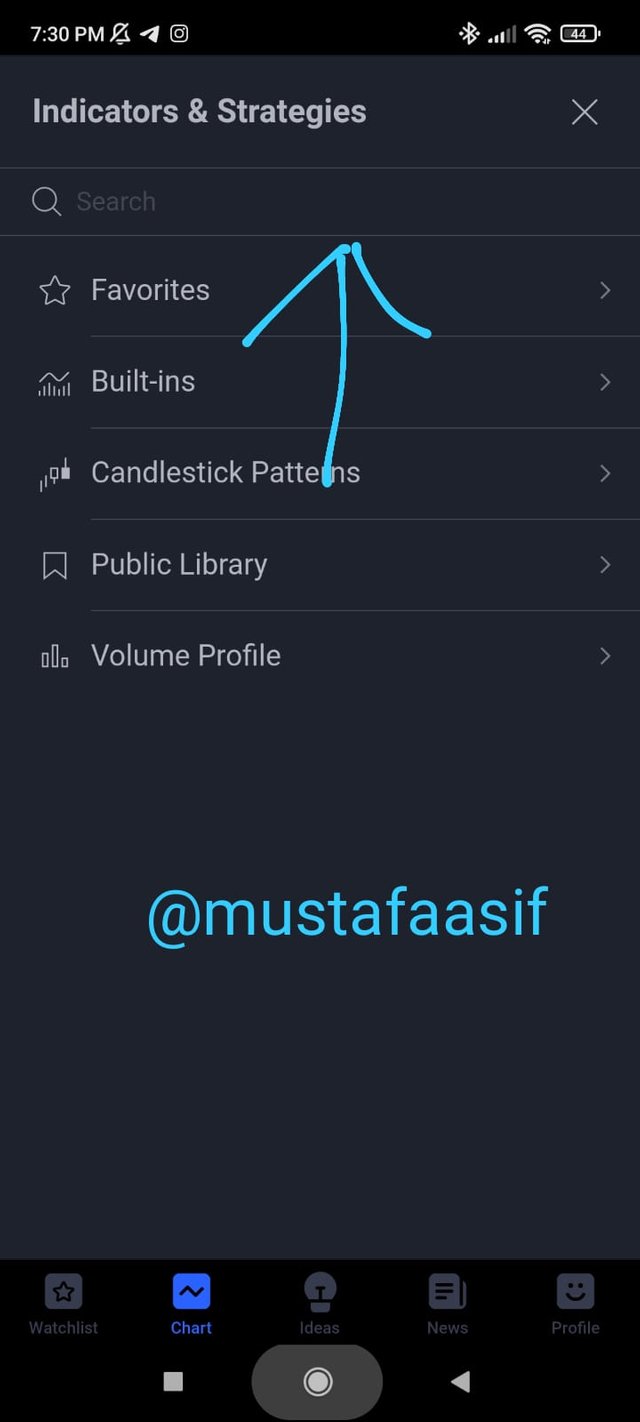
for selecting indicators click here.
this screen will appear and by searching here you can select any indicator.
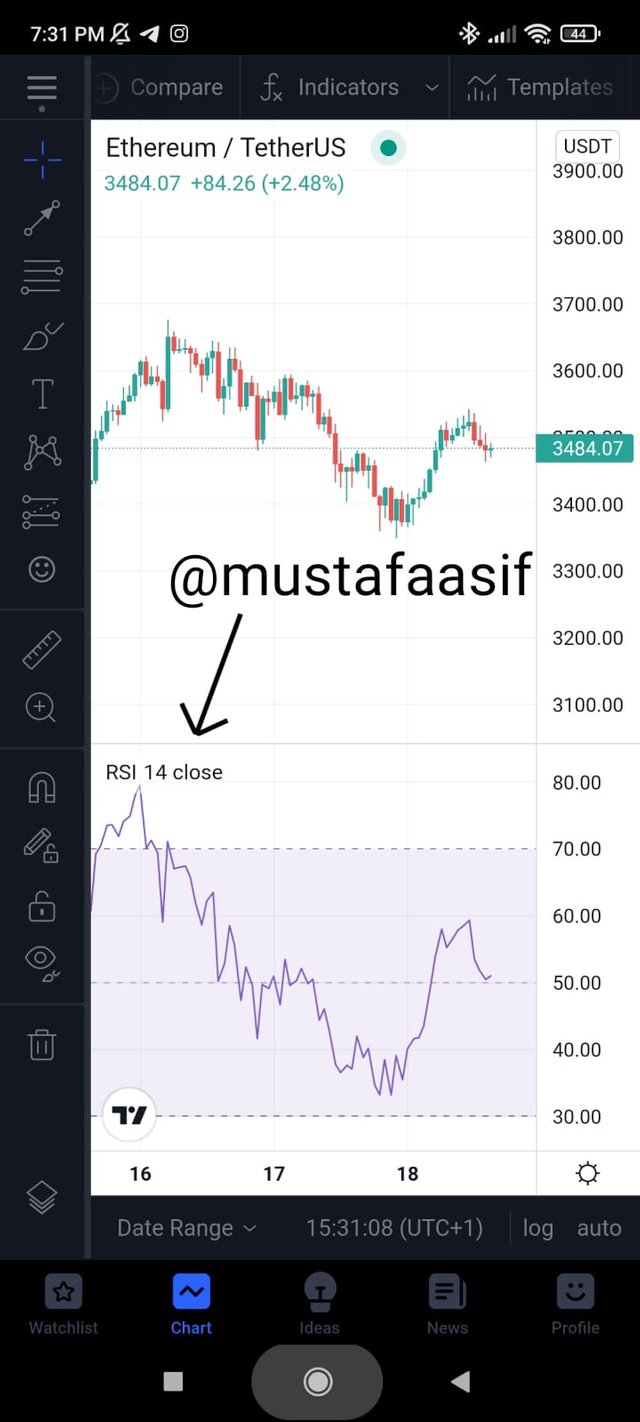
like I have searched for RSI and clicked it will automatically add in the chart which you can see
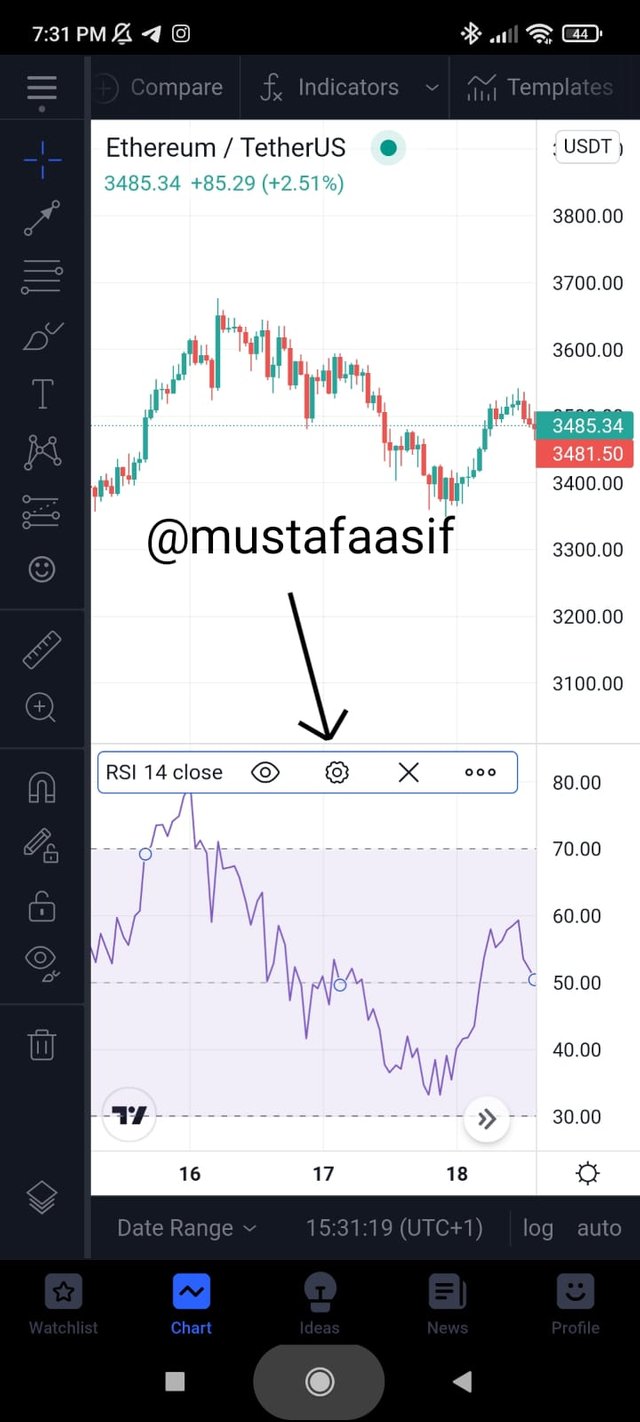
now if we want to change the settings of the indicator we will click on the marked part of the below picture.
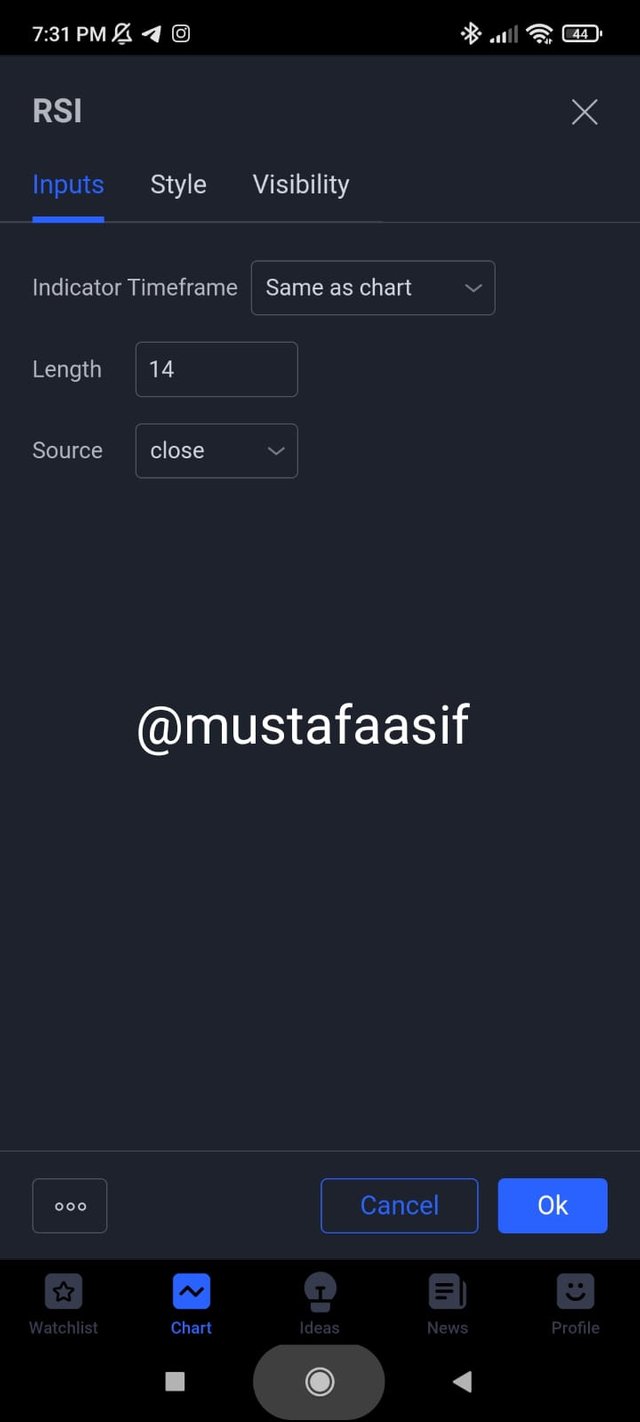
after clicking this icon it will open a new window where you can change its style and inputs etc.
Q2
a) Explain the different categories of technical indicators and give an example of each category. Also, show the indicators used as an example in your chart:
There are major categories of technical indicators and they can be listed below
- trend Based Indicators
- Volatility-based indicators
- Momentum Based Indicators
1. trend Based Indicators
If there would be a trend, trend indicators will alert you where in the direction it is moving. Because they fluctuate in a wave-like manner between low and high levels, they're called oscillators.
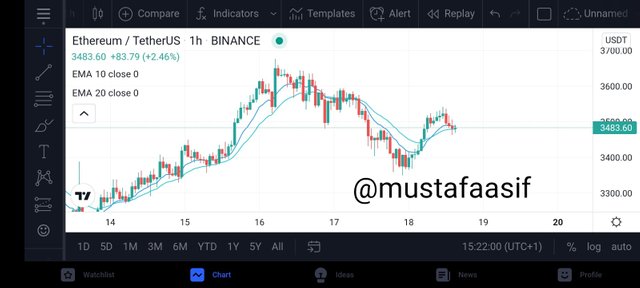
The EMA indication is a sample of a trend-based indicator, in my opinion.
2. Volatility-based indicators
These indicators are useful for swing trading. To put it another way, we are using this indication to spot swing high points for sellers and swing lows for buyers. They assist with both the buy low, sell at a profit trading strategy. They also assist in demonstrating how unstable a market is.
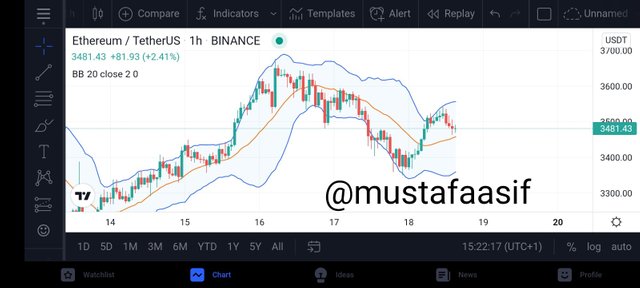
for example of Volatility-based indicators, I used Bollinger bands on ETHUSDT
3. Momentum Based Indicators
Traders utilize momentum indicators to get a better picture of how quickly an asset's value is changing. Because momentum indicators only measure the time frame during which a price movement happens but not the direction of movement, they are typically used in conjunction with other indicators and strategies. Regardless as to whether the price is moving up or down, momentum indicators represent market fluctuations over time as well as the strength of such changes.
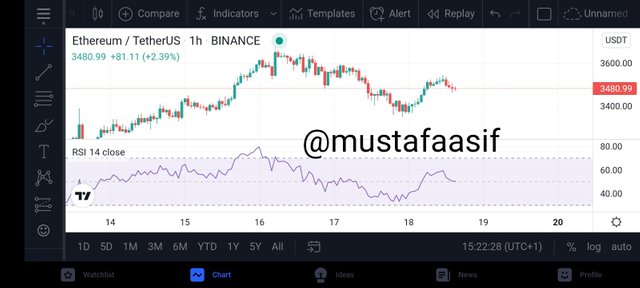
I used RSI on the ETHUSDT chart as an example.
b) Briefly explain the reason why indicators are not advisable to be used as a standalone tool for technical analysis:
All human-made gadgets, including indicators, do not perform their functions perfectly. Furthermore, many indicators just show you a single bit of information, such as the trend, momentum, entry, and also how volatile the market is. We also see basic analysis, which can always throw a technical analysis off. Therefore, while executing trades, do not rely solely on an indicator and combine it with your fundamental analysis to minimize losses. In the cryptocurrency market, we observe whales' behavior's creating a variety of rapid market fluctuations.
c) Explain how an investor can increase the success rate of a technical indicator signal.
An indication is not the same as a trading strategy. A strategy is an investor's guidebook, and traders sometimes combine many indicators to build a trade approach, while an indicators may assist investors in spotting market conditions.
The most common technique to achieve this is to combine many indicators and combine the multiple functions of these indicators to obtain as much information about an asset as possible before investing or taking positions on it. One trend indicator, one momentum indicator, and one volatility indicator can all be combined. I'll give you an illustration of this by making the transaction below.
Traders must select indicators from a number of categories. One indicator is frequently used to confirm that another indicator is producing a trustworthy entry or exit point.
CONCLUSION
When utilized correctly, indicators are an excellent trading tool for picking positions and comprehending what is going on in the market. It's also a good idea to backrest indicators before using them, and once you find a trading technique that works with the indication, stick with it. Always realize that an indicator isn't a gold standard. Thanks @reminiscence01 for the wonderful assignment.
#reminiscence01-s4week2 #cryptoacademy #indicators #technicalanalysis #steemexculsive
@steemcurator02
@steemcurator02