Support and Resistance Breakout - Steemit Crypto Academy - S6W3 - Homework post for pelon53
Hello everyone, I'd like to welcome everyone back to the courses in the steemit crypto academy. For the past two weeks, we've been putting what we've learned in the academy into practice, and to be honest, I've learned even more. Today, after attending Professor @pelon53's lecture on the topic of Support and Resistance Breakout, I shall undertake the homework assignment he assigned. Let's get this party started.


1.- Explain in detail the advantages of locating support and resistance on a chart before trading.
These levels of support and resistance are extremely essential in technical analysis because they allow a trader to determine the currency's power. These are areas with a high likelihood of the trend reverting in the other direction. If the value of the asset is rising, the line of barrier is the point at which the value likely to revert and fall. Likewise, if the price of an item is falling, the line of supports is the point at which the price tends to reverse and rise.
Aside from being pivotal locations for trend reversals, the points of support and resistance also serve as entrance and exit points for traders. A solid support and resistance level is one where traders may take profits and cease losing money. When a trader is able to recognize this critical zone and then use it appropriately, the likelihood of making a profitable transaction increases.
The zones of support and resistance also provide us with concrete information about just the market's demand and supply at any given time. The current value is an aggregation level, which means that the desire for the asset is generally quite high at this level, therefore more traders acquire the asset in this zone, causing the price to rise. From the other side, the support level is the dispersion level, which means that the supply for the asset is generally quite large at this level, thus more investors sell their asset here, causing the price to fall.
Simply conclusion, a current value is indeed a region or region at which a downhill trending value pauses and then reverses to the reverse way, whereas a resistance level is an area or zone where an upward trending price stops and then reverses to the opposite way.
2.- Explain in your own words the breakout of support and resistance, show screenshots for the breakout of a resistance, use another indicator as a filter.
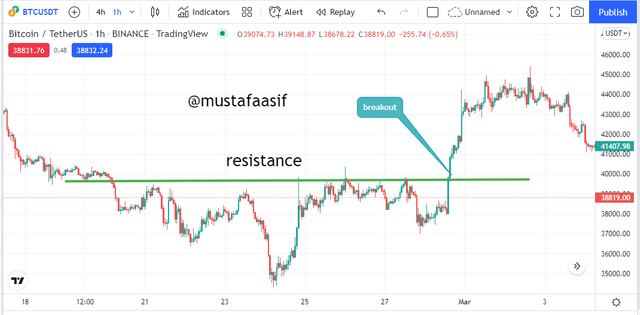
Whenever we speak about just a breakout of supports and barrier, we are talking to a situation wherein the price action that is in a range moving or has been moving either upward or downward continues its journey without halting at the customary level or tension point. Let's take a closer look at the resistance breakout using a screenshot as an example.
Barrier can be broken down in two methods. I.e., that once barrier is shattered, the market can revisit the shattered barrier before continuing an upwards manner, or the market may well not revisit the overcome barrier and instead just goes in an upward way that once barrier is cracked. Consider the following snapshot, which clearly illustrates a shattered barrier that would not retest.
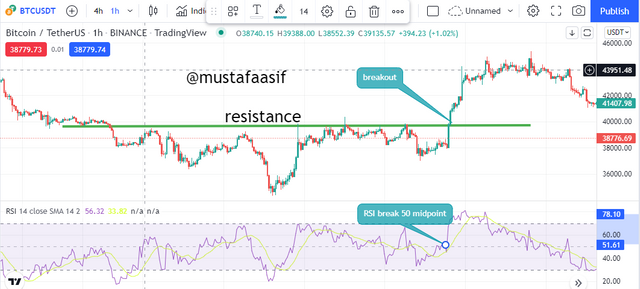
Next, upon this graph, I'll utilize the RSI indicator to analyze the breakthrough of the support zone. If you look at the snapshot below, you will note that the RSI indicator has crossed the top limit. The upper overbought zone serves as the region for barrier, and the chart below shows a steady rise of the RSI indicator above the 70 threshold, indicating that the level of resistance has been broken at that time.
3.- Show and explain support breakout, use additional indicator as filter, show screenshots.
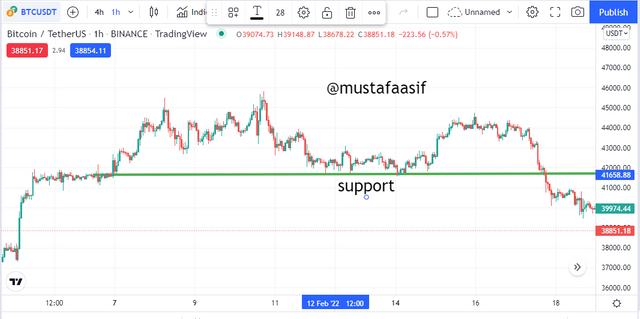
An supporting breakouts is a breakthrough that occurs just at hand includes. Whenever the value of the asset keeps falling without halting at the original support line, we consider that now the reliable basis has indeed been broken.
Help may be broken down in two ways. I.e., after the level is shattered, the market could retake the destroyed level before continuing in a downward motion; alternatively, once the support is broken, the price does not retest the broken support and instead proceeds in a negative motion. Consider the snapshot below, which clearly displays a broken support that retests and a broken support that does not retest.
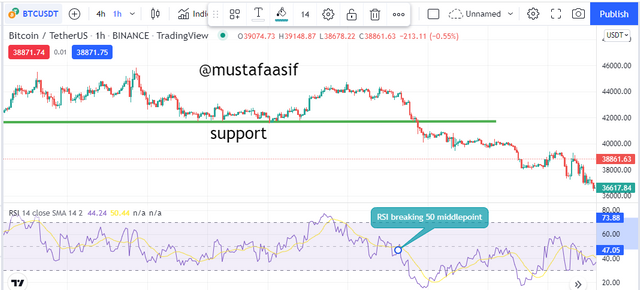
Then, using this chart, I'll utilize the RSI indicator to analyze the breakthrough of the hand includes. If you look at the snapshot below, you will note that the RSI indicator has broken over the bottom level. The lower oversold zone is the region of support, and the chart below shows a steady movement of the RSI indicator below the 30 threshold, indicating that the level of service has indeed been broken at that moment.
4.- Explain what a false breakout is and how to avoid trading at that time. Show screenshots.
False breakouts are types of breakouts that happen at both the supporting or resistance levels and do not continue advancing in the specified direction of the trend, instead reversing to the opposite direction. A fake breakout is usually used by the major players to liquidate the little traders' assets if they join the transaction just at time of the false breakout.
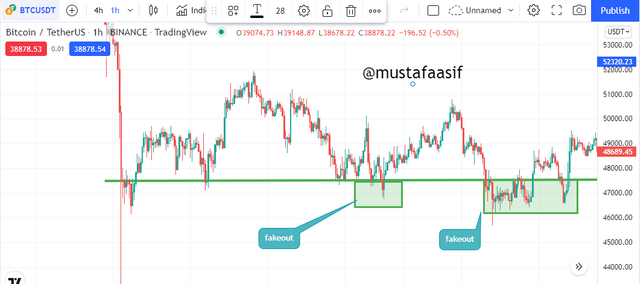
I was able to identify fake breakouts locations in the support zone using the screenshot above. As you can see, the price violated the support level and moved little lower before reversing and moving upward. Traders that placed a position at this breakout with the expectation that the price would continue to fall have actually lost a significant amount of money. To avoid this loss, traders should always wait for a clear breakthrough before entering any trade.
To prevent wrong breakouts, traders are advised to utilize an indicator to establish the actual uptrend. Furthermore, when a breakthrough is noticed, the volume of the asset should grow, and if this is not done, traders should wait and carefully examine the breakthrough after some time before coming into the market.
5.- On a demo account, execute a trade when there is a resistance breakout, do your analysis. Screenshots are required.
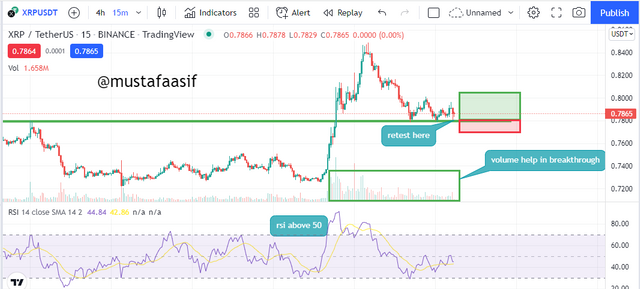
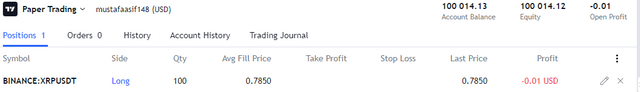
A pair of BTCUSDT was exchanged in the screenshot below. To confirm the breakthrough, I utilized my RSI indicator and volume. According to the snapshot, the trend broke and then retested before the continuous movement, and at the continuous movement, I placed a buy order, as seen below. All risk management strategies, such as stopping loss and taking profit, were considered. This trade has a risk-reward ratio of 1:1.
After a short period of time, the trend continues an upwards direction that I expected. The RSI indicator also continued to go upward, resulting in a large profit for the course of the trade. The outcome of the trade execution is shown below.
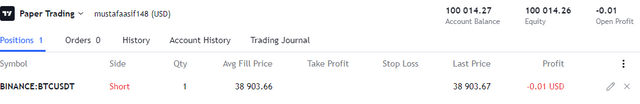
6.- In a demo account, execute a trade when there is a support break, do your analysis. Screenshots are required.
A pair of DEGOBTC were traded in the screenshot below. To confirm the breakthrough, I utilized my RSI indicator and volume. According to the snapshot, the trend broke and then continued to go lower. When I noticed the trend continuing lower, I placed a sell position, and the RSI indicator confirmed this. By establishing my stop loss and take profit, I considered all risk management tactics.
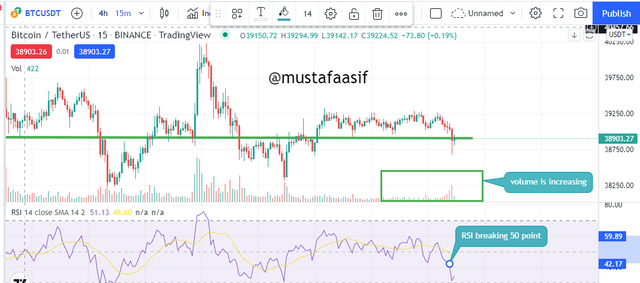
After a short period of time, the pattern will continue in the bad direction that I expected. The RSI indicator also continued to go downward, resulting in the profit that I projected. The outcome of the trade execution is shown below.
Conclusion
When it comes to trading, the support and resistance zones are quite important. If a trader want to achieve progress in the crypto market, he or she must constantly adhere to the principles of support and resistance. We can make a lot of money if we discover this critical level and keep an eye out for a breakout. In the same way as I demonstrated in the preceding transaction.
I'd want to thank the lecturer, @pelon53, for such an excellent talk; it was both educational and informative. I'm keen to learn so much from you, sir.
#cryptoacademy #pelon53-s6week3 #club75 #pakistan #krsuccess
