Steemit Crypto Academy Season 2-Week 8 | Homework Post for (@kouba01) - Bollinger Bands
Hello And Welcome to my Homework Post.
I am happy for the opportunity to participate in Prof @kouba01's assignment post this week. The full lecture on Bollinger Bands trading was really helpful.

What Is a Bollinger Band?
A bollinger band is a technical analysis technique named after John Bollinger, a renowned technical trader who created it. The Bollinger bands are made up of three lines:
- A simple moving average is a calculation that takes into account the number of (usually defaulted to 20-period moving average)
- A band on the top (usually defaulted to two standard deviations above the 20-period moving average)
- A lower-level band (usually defaulted to two standard deviations below the 20-period moving average)
Bollinger Bands are price-structure curves made up of a moving average (middle band), an upper band, and a lower band that allow you to determine if an asset's price is comparatively high or low.
If the price is in the top band, we consider it to be relatively expensive, and if it is near the lower band, we consider it to be relatively low.
To ensure that the Bollinger Bands respond to changing market conditions, the upper and lower bands are set to a value equal to two times the standard deviation of the asset's price history. By default, the centre band is the same as a 20-period simple moving average.
How to Use the Bollinger Bands
We can use the Bollinger Bands in conjunction with other indicators to generate buy and sell choices because they are utilised to identify a high and low price relative to prior performance.
While hitting the upper band can motivate a sale (and hitting the lower band can motivate a buy), it's vital to realise that a tag of the upper or lower bands isn't a sell or buy signal in and of itself.
Bollinger Bands can be utilised on any timeframe, however depending on whether you're trading on higher or lower timeframes, the moving average period and standard deviation should be reduced or increased. A 20-period moving average and a standard deviation of 2 are the default values.Reduce these parameters to 15 and 1.5 for a shorter term or 25 and 2.5 for a longer term.
Important Points to Remember:
- A bollinger band is a visual indicator that is widely used to estimate the volatility of a plotted asset.
- Three lines make up a bollinger band: a simple moving average, an upper band, and a lower band.
- The high volatility of cryptocurrencies, breakout trades are more significant than the other two basic bollinger band trading strategies.
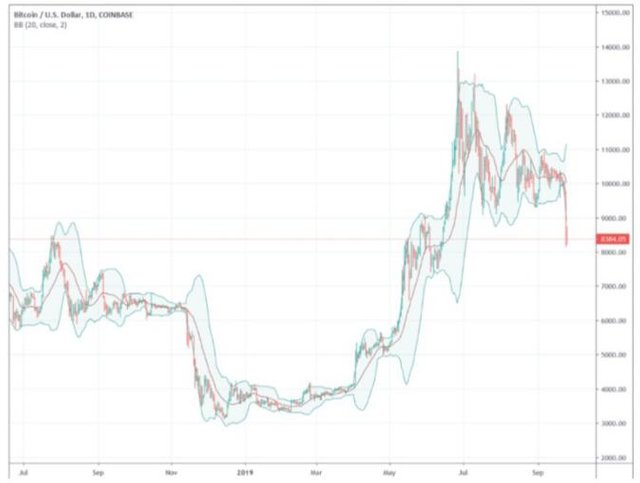
Bollinger bands are applied to the daily chart of BTC/USD traded at Coinbase, as illustrated in the chart above. The upper band is two standard deviations higher than the 20 period MA, while the bottom band is two standard deviations lower. Standard deviation is a useful predictor of volatility since it quantifies the divergence of a group of values from the mean. As prices move away from the lagging 20 MA, the bands widen, indicating that the market is getting more volatile. The fact that the bands are contracting means that the market is getting less volatile.
With Price Patterns and Bollinger Bands
The Bollinger Bands can be used to trade particular price patterns.
For example, the price action's "M" and "W" patterns can be used with Bollinger Bands (and volume) to enter trades with a high probability of success.
Ms and Ws are the most typical patterns identified during market tops and bottoms, and they form during market turning points.
Pattern with a ‘W Bottom
We should look for the first low (typically outside of the Bollinger Bands) to be lower in relative terms than the second low for a genuine ‘W bottom' pattern (which is always inside of the Bands).
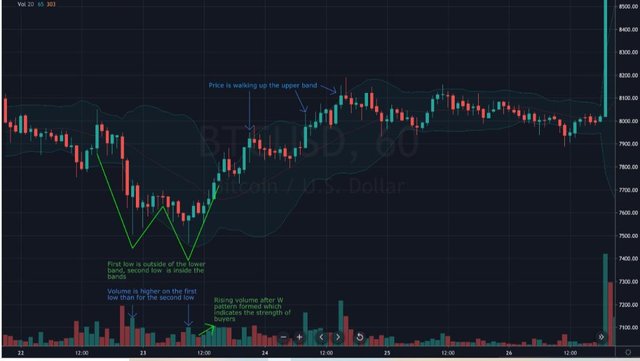
On the first decline, volume should likewise be higher. The second low does not have to be lower than the first low, and even if it does, if it remains within the Bollinger Bands, it is not a new low compared to the first. When the second low is below the lower band, W bottom patterns are disqualified.
When you see a W bottom, you can go long if the asset shows signs of strength. You may, for example, wait for a day of high appreciation with a larger trading range and volume than usual. A stop order can be put slightly below the most recent bottom of the W pattern to reduce your risk, and it can be moved upward when necessary.
For BTC-USD, the chart above displays an example of a W bottom. A bullish candlestick was created following the second bottom inside the Bands, closing at $7,630, which would have prompted an entrance into a long position. Around $7,465, a stop would have been placed just below the second low. Following the W bottom, BTC-USD went on to hit highs near $8,200.
Pattern with a ‘M Top'
A rally, then a retreat, a test of the resistance established by the previous rally's highs, and finally the commencement of a downtrend characterise M top formations. M top patterns are the polar opposite of W bottom patterns, with a new high outside of the Bands and a second high within the Bands.
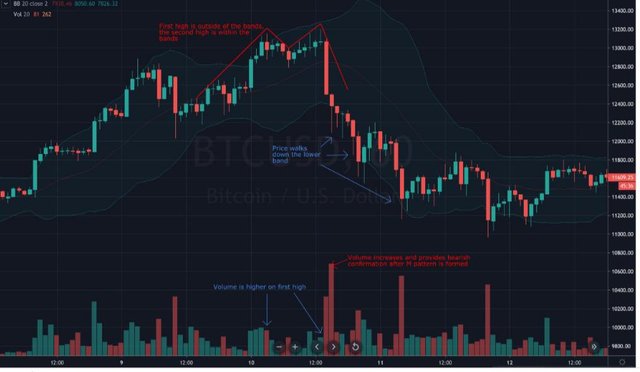
An example of a M top can be seen in the graph above. The first height is on the outskirts of the Bands, while the second is in the inside.
The first high has more volume, while the second high has less, indicating that enthusiasm in an upward rise is waning. A huge bearish candlestick was printed following the second high, and the rapid momentum should have signalled the trader to enter a short position. With an entrance price of $12,400, the price eventually plummeted to lows near $11,200 as selling volume increased.
A 'Triple Top,' often known as a 'Head and Shoulders' pattern, is another popular choice. In a Head and Shoulders pattern, volume normally rises on the left side, wanes in the middle, and then rises again as the downward motion begins.
After observing signals of weakness, we should look for a re-test of the neckline to enter a short trade after a Head and Shoulders pattern (greater than average volume and greater than average trading range). When the neckline is broken, there is usually a countertrend rally that tries to break above it.
Another pattern to be wary of is the ‘three pushes to a high,' in which the first push is outside the upper band, the second push establishes a new high and touches the upper band, but the third high fails to contact the band. As three pushes to a high unravel, we should expect volume to sink progressively.
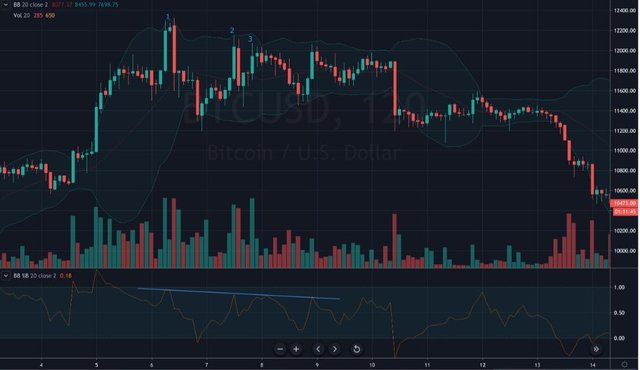
The percent B indication can also be used to indicate three pushes to high, where the oscillator should show lower highs.
Mean Reversion using Bollinger Bands
Waiting for the market to approach the upper or lower bands before taking action is the first method traders use bollinger bands. As the price approaches the bands, the chances of the market becoming overbought (upper band) or oversold (lower band) increase (lower band). As a result, when the price touches the higher band, the mean reversion trader will execute a short, and when the price touches the lower band, he will execute a long.
Caution: For volatile and trending markets like Bitcoin or cryptocurrencies, this simple technique may not be the best option. Mean reversion may be better suited to markets with lower volatility.
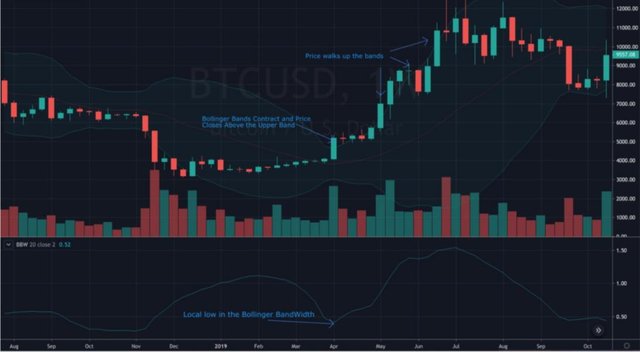
Breakout Trading Using Bollinger Bands
The second way Bollinger Bands are used by traders is to trade breakouts. This is accomplished by placing a trade in the direction in which the price breaks through the band. Enter a long position if the price breaks through the top band, and a short position if the price breaks through the lower band. This is best done in conjunction with the bands narrowing, which could be an indication that the market is preparing for a big move.
A straightforward technique would be as follows:
A straightforward technique would be as follows:
- Wait for the price to increase (bottom band). When it happens, take a long(short) position.
- Using the 20 MA as a stop-price, use a trailing stop. Every time the MA shifts, move the stop.
- When the price re-touches the 20 MA, exit the transaction.
Because cryptocurrencies are extremely volatile and tend to trend for lengthy periods of time, using bollinger bands for breakout trading on Bitcoin or other cryptocurrencies is preferred over mean reversion transactions. Before you trade, do your homework!
Identifying Squeezes with the BandWith Indicator
We may utilise the BandWidth indicator, which is derived from the Bollinger Bands, to spot Bollinger Squeezes.
The BandWidth indicator was established to measure the Squeeze and shows us how broad the bands are (calculated as the difference between the upper and lower band, all divided by the middle band).
BandWidth is also useful for detecting the start and finish of trends. When the BandWidth is small, it indicates a low level of volatility. A breakout from the trading range is frequently followed by an increase in the BandWidth, and it usually leads to the formation of a long-term trend.
BandWidth can also be used to determine whether a trend is coming to an end. In this situation, the signal flattens out or turns down just enough to flip the Bollinger Band's direction on the opposite side of the trend, i.e. the lower band moves south in an uptrend and the upper band moves north in a downtrend. This is referred to as 'Expansion,' and it is the polar opposite of a 'Squeeze.'
OverView/Conclusion
The bollinger band indicator uses both the RSI and the MACD indicators in its function since the Bollinger can discern oversold and overbought conditions, which the RSI indicator can't. The Bollinger band can also be used to determine an asset's market trend, similar to how the MACD indicator does.
Despite the fact that the Bollinger band performs the functions of both the RSI and the MACD, traders should pair these indicators to get a better result when analysing.
I hope You Like my homework Post.
#cryptoacademy #bollinger #bands #indicator #cryptocurrency #trading #kouba-s2week8
Unfortunately @mustafaasif, this week's submission time has expired.