Price Action + Break-even Technique - Crypto Academy/S4W4 - Homework post for @lenonmc21
This is my new post in the Steemit Crypto Academy community, on this season 4 week 4, I will be working on a homework from professor @lenonmc21 with the theme "Price Action + Break-even Technique”.
1.) Define in your own words what Price Action is?
The movement of price in the market is referred to as price action. The price travels in three directions: upwards, downwards, and sideways. These price movement directions are shown on every trading chart by candles of different(two) colours. Without employing indicators or other trading systems, carefully analyzing the chart and observing the price action on the chart might aid in making the best trading selections.
As a result, price movement trading is a strategy that uses past open, close, high, and low prices to aid in swing trades.
Price action, unlike signals and other basic research tools, indicates the current situation of the economy instead of what the price will be or is likely to be in the future. The price action trading method entails primarily observing price trend on the chart and only making trade decisions based on that knowledge. External data that isn't displayed on the chart isn't used in this strategy.
The candlestick
The bullish trend
The bearish trend
The flat market
candlestick
Candlestick analysis is a type of market research that is used to identify trending movements. Because it shows the point where the market starts and closes with its high and low for a given bar/stick trend (bullish/bearish), the candlestick is the most essential view of market analysis.
The candlestick is a tool for detecting the price movement of a market trade trend.
Bullish trend
The bullish trend suggests that market prices are going up and increasing, indicating that buyers have gained control of the market at the duration. The colour green represents a rising trend.
When a graph view indicator such as a candlestick, line, or other type of chart view indicator goes to the right and upward, it indicates a bullish trend. This is made up of what are known as higher highs and higher lows.
Bearish trend
The antithesis of the bullish trend is the bearish trend. This pattern indicates a decrease in market trades, indicating that sellers have taken control of the market at the time/moment in question.
A red colour indicates a bearish trend; the bearish trend is also known as "the dip" in the crypto industry. The lowest high and lowest low form the bearish trend movement, which is a downward movement to the right.
Flat market
The bullish and bearish trends are in balance in the flat trading economy. The markets aren't steady because the upward and negative regression trends are now going in a linear pattern.
Here, however, neither buyers nor the sellers have total control; rather, they are both battling to take control of the market at the moment, and Albany's version of this trend movement is known as "price action."

Define and explain in detail what the "Balance Point" is with at least one example of it (Use only your own graphics?
BALANCE POINT
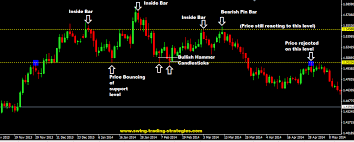
The point indicated in the ends of a candle that marks the end of a trend is known as the Equilibrium Position. The breakeven point, also known as the balancing point, is the point when the high and low of a trend's final candle meet. The trend must've been ongoing for this point to be recorded in a light, and the candle has to be the candle that signals the end of the trend.
We are in a state of sale inside the image above; we can see that the price has not tried to touch this same protection and restoration, and then the market recovers; to prevent losses, we place a stop loss in the tension section, and it is demonstrated that now the price graph continues to climb and through resistance level since we have located a stop loss in the tension section, so we have no loss; this is what is known as break-even analysis.
3.) Clearly describe the step by step to run a Price Action analysis with "Break-even"?
The price action trading strategy cannot be employed without taking the necessary precautions. To determine entry and exit points, one must do a thorough analysis of the market. The break-even or balancing point on the chart is used to analyze price action.
To perform a Price Action analysis with Break-Even, follow the steps below.
Choose a time window that corresponds to your trading approach. Whether you are a day trader (scalper) or a long-term trader determines your trading technique (swing trader). A day trader can employ a 2 hour time frame while still using 30 minutes for proper analysis. Of course, as a day trader, you must constantly monitor the market to determine when to enter and depart. Work within the time frame that has been set.
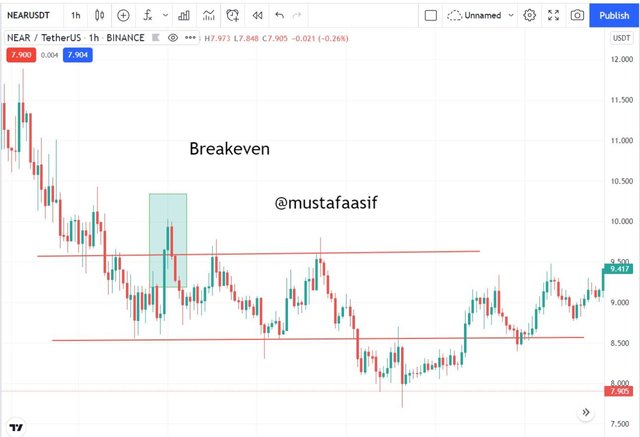
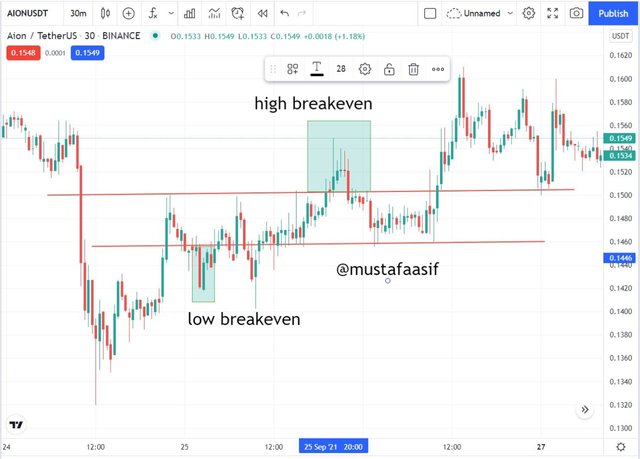
The next step is to indicate the relevant points in the chart after you've set the time range. The peak (break-even) point of the candles which ended the previous upswing and the lowest (break-even) point of the candle that concluded the previous downturn are these points.
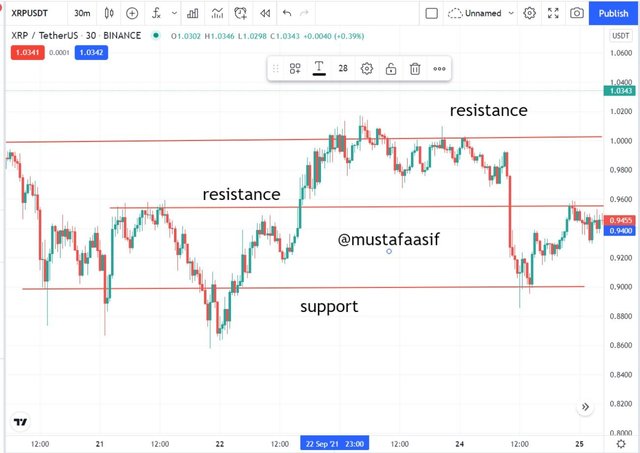
To understand what is going on in the market, conduct a thorough analysis. Determine whether the market is in an uptrend or decline, determine where the market is balanced, and then enter the market.
4.) What are the Entry and Exit criteria using the Breakeven Price Action technique?
There are two criteria to the use of price action break-even strategy in trades
Wait for a discernible break from the previously marked break even points. Thus, the last candle in the previous uptrend and the last candle in the previous downtrend should be marked at the top or bottom of the chart. Continue to wait for a candle to appear before entering or exiting. Expect a bearish candle if the break occurs at the top, and a bullish candle if it occurs at the bottom. The exit should be at the top and the entrance should be at the bottom.
Placed a stop loss below the break-even point for a buy trade and a take profit above the break-even point based on the range with which the stop loss was set. A risk-to-reward ratio of 1:1 should be used.
5.) What type of analysis is the Price action or the use of technical indicators more effective?
When I first got into crypto, all I needed was a basic understanding of the chart and candlesticks to study the chart and trade profitably on a daily basis. I had no idea the method I was using at the time was the price action strategy. I followed this strategy well, and as a result, I was able to generate profits on a daily basis, just as I had hoped. Using this strategy, I made selections in 15 minutes, 1 hour, 2 hours, and 4 hours. Trading was fun and exciting, and I looked forward to crafting something new every day.
I learned how to employ technical indicators and trading strategies as the days passed. I had been utilising these tactics and they have proven to be extremely ineffective. I get hooked on coins for days, weeks, and even months at a time. It's as if I'm now relying on luck to make money. I believe that the usage of technical indicators is so complicated that many of them, like the price action break-even method, do not provide profits.
With my experience both ways, I am confident that my old unidentified approach, which I am only now learning the name of, is far simpler and easier to trade with because it produces the desired gains. The only factor that could influence this way of trading is a general drop in the price of Bitcoin, which could cause all currencies to decline in value.
Practice (Only Use your own images)
1.) Make 1 entry in any pair of cryptocurrencies using the Price Action Technique with the "Break-Even Point" (Use a Demo account to be able to make your entry in real time at any timeframe of your choice)
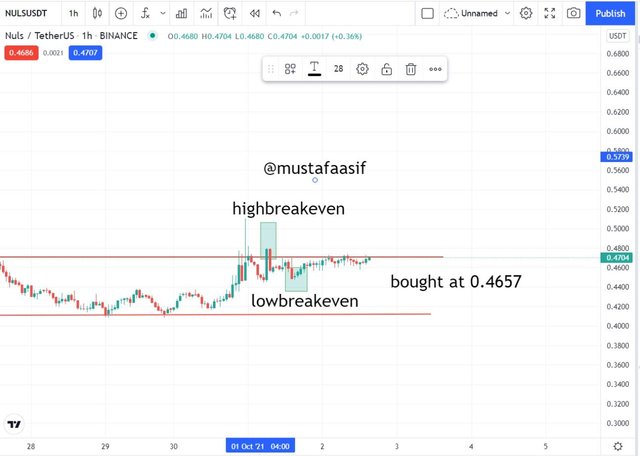
To carry out this task, I did a live trade on Binance. I bought NULS token with USDT.
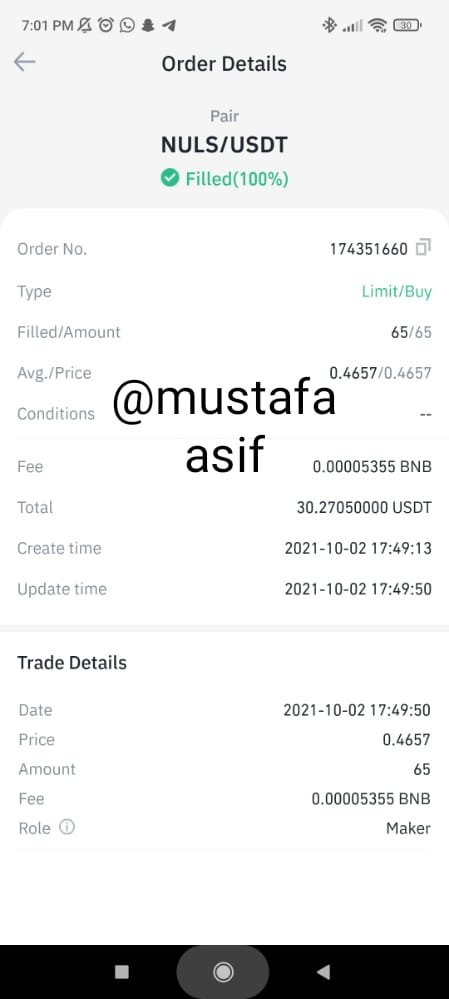
These are the details of the purchase entry I made.
To summarize, the price action breakeven strategy is excellent for day traders but may not be rewarding for long-term investors. With this method, one must always be in the money market to keep track of it.
Cc:
#lenonmc21-s4week4 #cryptoacademy #price-action #trading #nigeria #steemexclusive #steemit