"Perfect Entry" Strategy Using Stochastic Oscillator+200 Simple Moving Average- Crypto Academy/S5W3 - Homework Post for @lenonmc21
Prof. @lenonmc21, how are you today? It warms my heart to be a member of this group. It's another chance for you to be a part of your class. I must say, the lesson has had an impact on me. I present my finished homework based on my comprehension.

State in your own words what you understand about the Perfect Entry Strategy (Place at least 2 examples on crypto assets)?
THE PERFECT ENTRY STRATEGY
The modern era has infiltrated every area of our lives, including our enterprises, in today's globe. As a result, an introduction to online business is provided. The same can be said for investments. Cryptocurrencies, or digital currencies, are now available for online investment. You can trade cryptocurrency at the right periods and make money. But just as you examine the firms you want to invest in and analyze data on their market growth and its relationship to global economic growth, you make trading strategies based on the trends the market encounters through time. Technical Indicators are instruments that investors use to make analysis, and they can use one or a mixture of them. This conveys market conditions to investors, who then make a judgement based on that information. Today, we'll look at the "Perfect Entry" trading method, which employs a Stochastic oscillator and 200 moving average line combo.
Theory
Let's take a look at what the Stochastic oscillator and moving averages are before we go into the Perfect Entry method.
- Stochastic Oscillator
The stochastic oscillator is a form of momentum technical indicator, which means it tracks price fluctuations in the market in relation to a predetermined price. The Relative Strength Index, or RSI, or the Rate of Change of Oscillation, or ROC indicator, are examples of similar indicators. This keeps track of how much the price of crypto assets has changed over time. It often indicates the price overbought and oversold zones when used in conjunction with the RSI. It has a range of values between 0 and 100. It takes into account the asset's Percentage K and Percentage D values. Dr. George Lane was the one who came up with this idea.
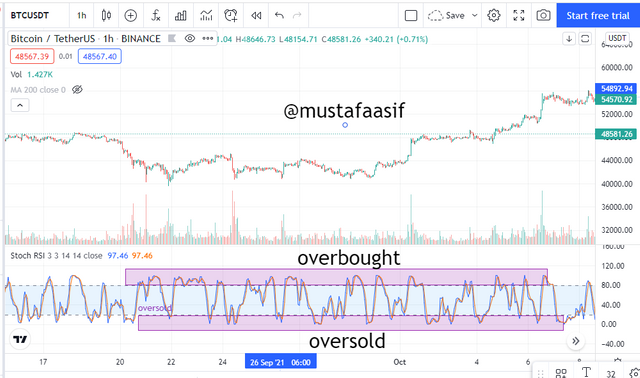
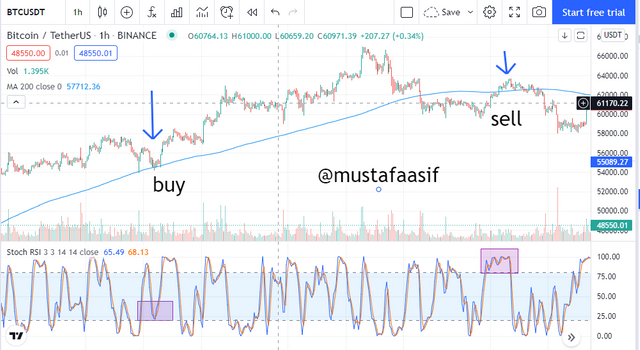
The oversold region is 0 to 20 points, whereas the overbought region is 80 to 100 points. It's worth noting that the crossover approach can be used to identify possible trend buy and sell situations. We consider a potential buy position in the market when the Percent K crosses over the Percent D line at the oversold region, and we consider a potential selling position in the market when the Percent K crosses below the Percent D line in the overbought zone. This must match the market's price trend as shown by the candlestick chart.
- Simple Moving Averages(MVA)
These are lines that help investors smooth out the candlestick chart (i.e. short-term price swings) and assess the trend the market is following over time. They're similar to candlestick chart trendlines. They also evaluate where the market is overbought and oversold in terms of price.
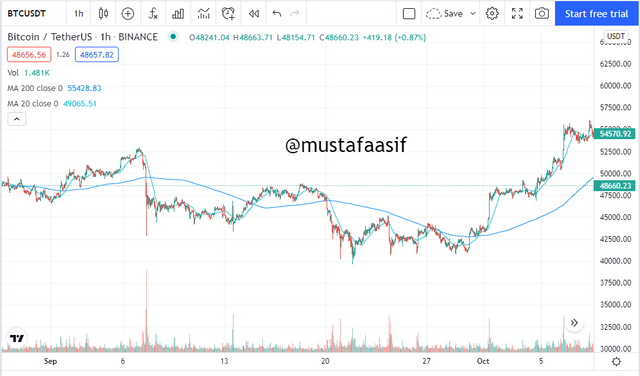
Trading with moving averages involves either short-term or long-term training. It's worth noting that most investors choose to combine the 20-period MVA (short-term) with the 200-period MVA (long-term). These two together assist you in determining which regions are overbought and oversold in order to make market selections. This aids you in making market selections.
An uptrend is indicated by a rising average line, whereas a downtrend is shown by a falling average line. When the short-term moving average crosses over the long-term moving average, it indicates a positive market (support area). When the short-term moving average crosses below the long-term moving average, a bearish market is identified.
We can now return to discussing the "Perfect Entry" technique. The Stochastic oscillator and a 200-period moving average are used in this method. These are also used with the Japanese Candlestick, and they must agree with the trend of the candlestick. Before using the Perfect entrance strategy, three requirements must be met.
Determining the market trend
It's crucial to figure out which way the candlestick is going. The 200-period moving average is used in combination with this. We examine the price momentum of cryptocurrency over time and discover upward and downward price trends.Agreement of Candlestick with the 200 Moving Average
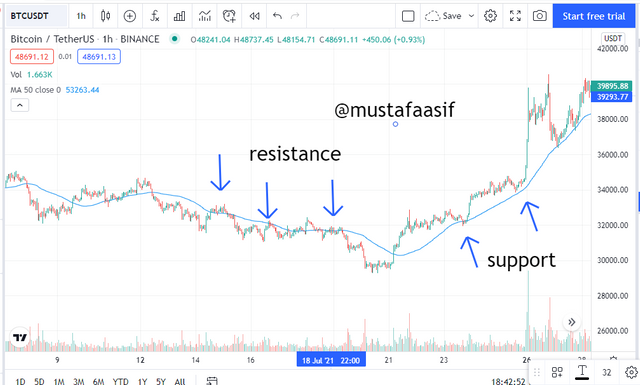
To establish agreement, we must first ensure that the Candlestick follows the "flow" of the 200-period moving average. Then we look at where the candlestick is approaching the 200-period moving average and how it is approaching it. A Trigger Candle, which will be a little candle, will appear in the market, signaling an indecisive time in which buyers and sellers are unable to control the price due to pressure from both sides. It denotes a point at which a reversal is feasible. As the two sides apply pressure on one another, the price appears to be at a standstill (no rise or fall). The candlestick pattern, along with the 200-period technical indicator, defines whether the market is in support or resistance territory. When a candlestick pattern is above the moving average and has greater highs and lows, it is said to have developed at the support region. If the pattern is below, with lower highs and lows, it is thought to have formed at the resistance level.Stochastic Oscillator
Here, you must examine the stochastic oscillator to see if the extreme and oversold regions meet the aforementioned criteria. So, at the tiny candle, if the Percent K crosses over the Percent D in the overbought region, which is between 80 and 100, you take the Market sell option, which coincides with all of the other conditions to make the appropriate investment decision. In the oversold region, which is between 0 and 20, if the percent K falls below the percent D, you pick the Market buyout clause at the little candle.
You can make a fantastic entry trade after these circumstances are met. Otherwise, if even one of them is dissatisfied, you'll have to wait until they're all happy. Depending on its relative position to the moving average, the moving average can operate as price support or resistance. When a candlestick pattern is established on top of a moving average and the candlestick continues to make higher highs and lows, the moving average acts as price support for the candlestick. If the candlestick is established below the moving average and continues to make lower lows and highs, the moving average will act as a price resistance for the candlestick. This is depicted below.
The daily average must now serve as a support for the candlestick in order to produce a superb entry for a buy. Then you check the stochastic analyzer, and if the percent K crosses over the fraction D at the oversold level at the same time, you place your buy entry. That is an excellent Buy entry.
To make a flawless entry for a sell, on the other hand. The moving average must operate as a barrier between the candlestick and the moving average. Then you check the stochastic oscillator, and if the percent K crosses below the percent D at the overbought region at the same time, you place your sell entry. That is an excellent entry for a sale.
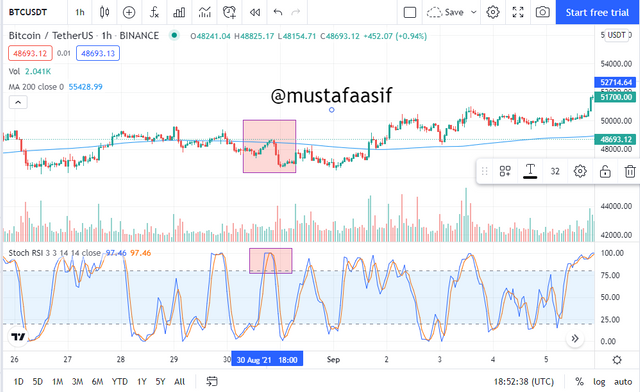
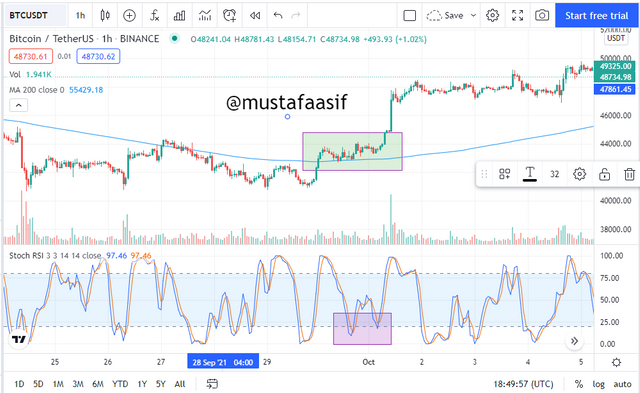
This is the best way to get started. The BTCUSDT trade and the SHIB/USDT trade are examples of crypto assets.

Explain in your own words what candlestick pattern we should expect to execute a market entry using the Perfect Entry Strategy.
As previously said, the approach is designed to alert you to potential trend reversals, allowing you to capitalize on the chance and trade. As a result, it is consistent with a form of candlestick pattern. Before we go any further, it's important to understand that we use the buy or sell entry option when the candlestick makes contact with the moving average, as well as the candlestick's relative position to the moving average, as I previously described. As a result, the Morning Star and Evening Star candlestick patterns should be expected.
The Morningstar is noticed when making a superb entry for a buy since it denotes a positive market trend reversal. The indecisive moment in the market, which is one of the candles in the morning star pattern, is represented by the small candle that makes contact with the moving average.
The Evening Star is studied while making a flawless sell entry since it also indicates a negative market trend reversal. The small candle that makes contact with the moving average, which is also one of the candles in the evening star pattern, suggests that the market is undecided. This is also generated at the resistance area, which corresponds to the Perfect Sell Strategy. Morning Star, on the other hand, is the polar opposite.
Explain the trading entry and exit criteria for buy and sell positions in any cryptocurrency of your choice (Share your own screenshots)
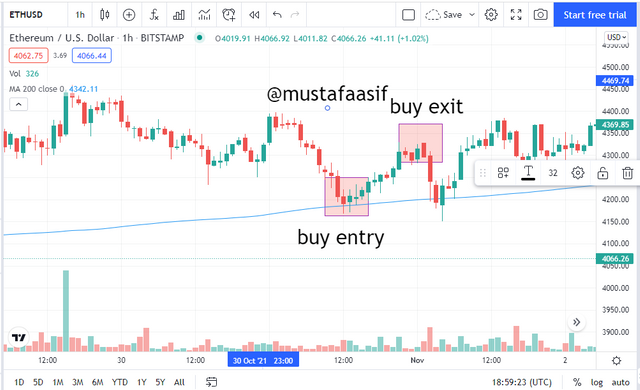
- Trading Entry and Exit for Buy Position
We've already discussed how the optimum moment to buy is when the moving average is functioning as a support for the candlestick, indicating that the asset's price is rising. After the small bearish candle reaches the moving average, it is recommended to enter the purchase trade. This indicates the probability of a bull market trend reversal. Await the formation of the following bull candle. Check to see if it has a big market volume. Keep up with the crowd. When a bearish candle with a big volume forms, you quit the trade.
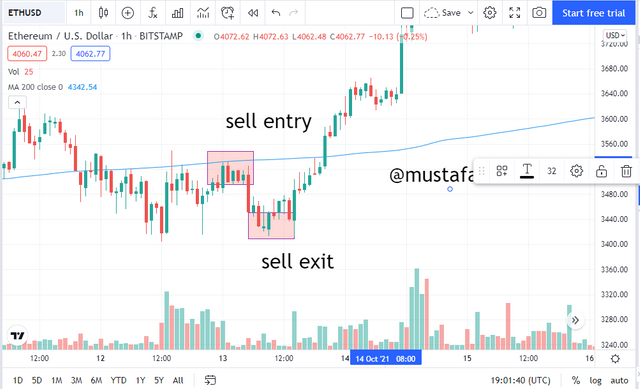
- Trading Entry and Exit for Sell Position
The optimum time to trade, on the other hand, is when the moving average acts as resistance to the candlestick, indicating that the price of the crypto asset is ready to fall. After a modest bullish candle meets the moving average from below, signaling a likely trend reversal, it is recommended to take a sell position. Wait for the next candle to form, especially if it is a massive bearish candle, indicating a bear market with significant volume. Follow the trend and exit the trade when a bull candle appears with a higher relative volume.
Practice (Remember to use your own images and put your username). Trade 2 demo account trades using the “Perfect Entry” strategy for both a “Bullish” and “Bearish” scenarios. Please use a shorter period of time to execute your entries. Important you must run your entries in a demo account to be properly evaluated.
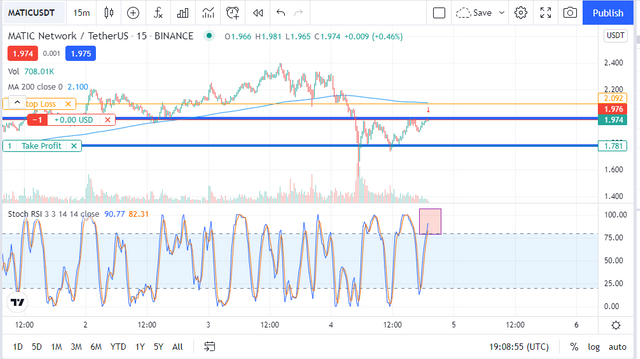
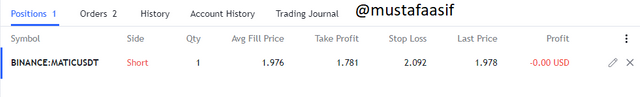
Trading a Perfect Entry with a Bearish scenario
Making a Perfect Entry for a Bull Market.
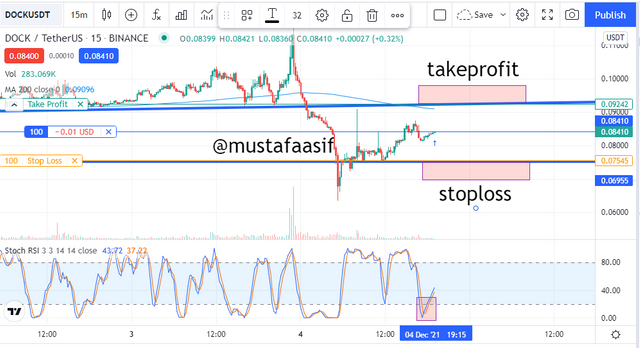
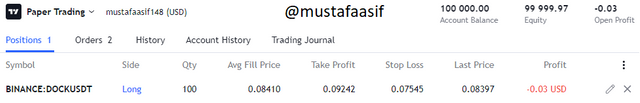
These are images of a demo trading when a great entry was made. In the photos, the steps are depicted.
Thank you for reading, Prof. @lenonmc21
#club5050 #cryptoacademy #lenonmc21-s5week3 #perfect-entry #strategy #pakistan