Introduction to the principle of Crypto Analysis, crypto Academy S4W7, Home-work post for @imagen.
Hello, friends. I hope you're enjoying yourself? This is my contribution to Professor @imagen's lesson on Introduction to Cryptographic Principles. The following was the assignment:

source
What are the differences between Fundamental Analysis and Technical Analysis? Which one is used most often?
Fundamental Analysis
When examining the market state of an asset in order to discover the optimal entry and exit points that can net them a significant amount of profit, investors and traders use a variety of methods. The fundamental examination of an asset is one of the most extensively utilised and established approaches.
The fundamental study of a financial asset is particularly compatible with cryptocurrencies, despite being traditionally connected with stock markets. Fundamental analysis is the evaluation of qualitative and quantitative data on a cryptocurrency asset in order to estimate the asset's inherent worth.
The outcome of such an analysis assists traders and investors in identifying numerous possibilities on the asset market that might lead to profit. The comparison of the results of the study with the actual market value of the asset acts as a key signal for investors and traders to determine whether the market is overvalued or undervalued. In the case of an undervalued asset, investors might make a smart market decision by putting their money into the asset's market to benefit from future digital growth.
Alternatively, investors should avoid making new investments in expensive assets because the market could devalue them violently. If, on the other hand, an investor or trader has cryptocurrency assets that are overvalued according to fundamental research, the assets can be sold to ensure profits. These earnings can be utilised to repurchase assets when digital financial entities become discounted, and then sold to make even more money once they become overpriced again.
Fundamental analysis is popular among cryptocurrency investors because it allows them to spot fraudulent projects by performing a thorough qualitative and quantitative review of the asset. There are thousands of cryptocurrency initiatives, and the vast majority of them are uncontrolled. Some of these initiatives are likewise short-lived since they do not deliver on their promises.
Scams or deceptive initiatives are also common, with the goal of defrauding investors and stealing their money. As a result, using fundamental analysis methodologies might assist traders and investors in avoiding such enterprises.
The reliability or reputation of the main contractors, the project's location, the number of visitors, enterprise value, daily volume of the asset, and many other aspects are all taken into account in the fundamental analysis.
These indicators provide useful information about a cryptocurrency asset's current price activity or state. Even better, fundamental analysis can be integrated with other analytic procedures like technical analysis and others to obtain a more thorough evaluation of a coin component.
Technical Analysis
Price action is another way that market participants use to test the efficiency of a cryptographic asset and make predictions about the organization's monetary direction based on past market data.
This is because traders believe that current price patterns reoccur and that historical data is a strong predictor of an asset's future direction. The market price oscillations are generated by the combined actions of market participants.
Because of the intensive buying and selling actions of traders, the cryptocurrency market is viewed as extremely volatile. Asset prices can rise or fall dramatically in a short period of time, and most of these fluctuations begin to follow the same pattern when examined over time.
These digital financial entities develop support and resistance points, as well as trends, over time. These price directions, when identified by traders and investors, aid traders in predicting with a reasonable degree of accuracy so that they may determine excellent entry and exit opportunities on the asset's market to profit.
Bullish price movements, bearish price directions, and sideways marketplaces are the three primary forms of asset trends. The positive trend is an increase in the asset's price point, indicating that buyers are in control of the market since they are amassing more assets.
The bearish trend shows that sellers are in control of the market, and as a result, the asset's price continues to fall. A sideways market refers to an asset that has yet to develop a bidirectional motion due to the traders' vacillation.
Charts are mostly used in technical analysis to evaluate bitcoin assets. By default, these charts use two-color candlesticks to depict the nature of the digital currency's market state. Red and green are the primary colours. In some charts, the colour white or black is preferred.
Bullish price direction is represented by white or green, whereas bearish price direction is represented by red or black. These graphs are evaluated in terms of certain time periods. These time frames depict the asset's performance over a specific period of time.
Short-term traders are more likely to use shorter time frames, while long-term traders choose longer time frames. Short-term traders may use minutes-marked time frames to get a clear picture of an asset's performance in such a short period of time. Long-term traders prefer to keep their orders open for much longer, therefore they utilize hourly, weekly, or even monthly time frames to monitor the digital element's long-term performance.
In addition, technical indicators are used in the evaluation process of technical analysis. These technical indicators use the digital currency's data to make a variety of calculations. The indicator's results are frequently graphically portrayed as an overlay on the chart or a separate grid box below or above the chart.
These indicators are generally utilised for asset conjunction, trend analysis, and the detection of asset divergence. All of these factors assist traders and investors in making more sound financial decisions that result in profits, as well as risk management measures.
To get a comprehensive and in-depth scope of the market state and trustworthiness of a project and its financial aspect on the market, technical analysis is frequently employed in conjunction with fundamental analysis.
Fundamental Analysis
- It makes use of the project's qualitative and quantitative data.
- It evaluates the asset's intrinsic value in order to establish whether the asset's market value is reasonable.
- Typically utilized for long-term investments.
- It assesses facts from the past and the future.
- It is mostly related with financial investments.
Technical Analysis
- Charts, price activity, and technical indicators are used.
- It is used to predict price direction and to locate advantageous entry and exit opportunities.
- Investments are normally for a shorter period of time.
- In asset evaluation, only historical data is employed.
- It is primarily focused on trade.

Choose one of the following crypto assets and perform a Fundamental Analysis indicating the objective of the Project, Financial Metrics and On-Chain Metrics.
- Cardano (ADA)
- Solana (SOL)
- Terra (MOON)
- Chiliz (CHZ)
- Polkadot (DOT)
Now we can get a better understanding of what fundamental analysis is: the value placed on an asset to predict its future performance. Thanks to the question, I'll do a quick fundamental analysis on Cardano (ADA).
Cardano(ADA)
The Cardano cryptocurrency's activities are centralized in five stages: scaling, foundation, smart contracts, governance, and so on. This token operates on a PoS consensus mechanism, which stands for proof of stake, and the Cardano cryptocurrency's abbreviated form is ADA.

source
The goal of the Cardano team is to establish a decentralised ecosystem that is not controlled by anyone. It will be based on blockchain technology and will be financially supported. Cardano has the firepower to carry out this financial gesture, as the team is stacked with talented programmers. Cardano is a decentralised cryptocurrency ranked #4 by coin-marketcap. Click here for additional information.
source
Investing in Cardano is a fantastic idea. You will agree with me that the positive now, but will still climax higher-high, because bitcoin is still storming up; bitcoin appears to be the father of all cryptocurrencies, and as it rises, other cryptocurrencies follow suit, and vice versa.
The ADA crypto token is valued at 54 billion dollars and is traded on a number of exchanges around the world, including the Binance controlled Exchange. It can be taxed in pairings with stable coins such as USDT.


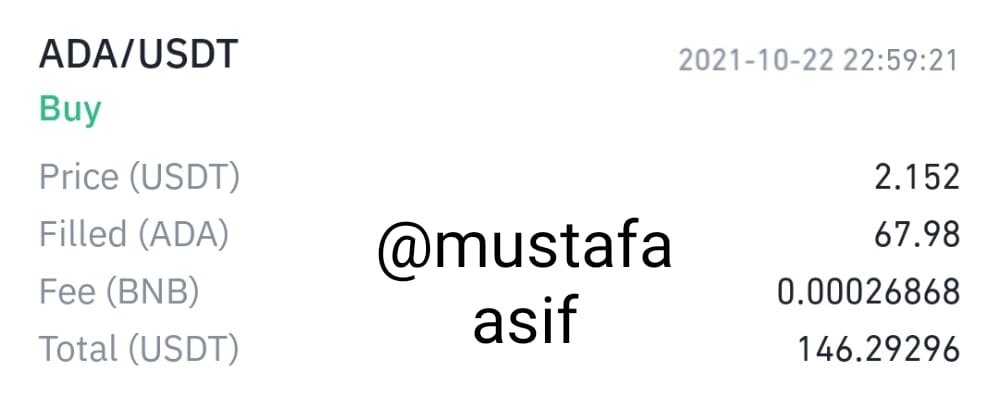
Make a purchase from your verified account of at least 10 USD of the currency selected in the previous point. Describe the process. (Show Screenshots)
Purchasing the Cardano token from my prior question is quite simple, and the ease comes from the fact that the token is listed on Binance, one of the world's most popular centralised exchanges.
I'll be buying ADA tokens with my USDT, which is roughly $10 USD, as the question requests. Keep following to see how the process proceeds.

We have long and long term investments, where an investor may opt to buy a coin and keep it for a long period in order for the coin's value to appreciate, and then sell it later for a large profit. This is referred to as HOLDING.
Short-term investment, such as trading, entails purchasing a currency and selling it after a small profit has been realised. An in-depth talk about investment took centre stage as I invested 10 dollars worth of my USDT currency to buy Cardano ADA, a coin I was introduced to with 23 worth of USDT, so I invested in fractions.
Apply Fibonacci retracements to the previously selected asset with a 4-hour time frame on the platform of your choice. Observe the evolution of the price at 24 and 48 hours, did it go up or down in value? Look to identify resistance and support levels.
Fibonacci retracement is a technical analysis system for determining support and resistance levels. It is associated with specific numbers, and to determine Fibonacci retracement, simply draw a horizontal line from the resistance level. Support and resistance may then be easily determined. 23.6 percent, 38.2 percent, 50 percent, and 61.8 percent are Fibonacci levels.
In Fibonacci, 0 percent is seen as the beginning point of retracement; you will agree with me that the market moves in a Zig-zag pattern; for example, if the market formed a higher-high, the next step is to retrace backwards; in Fibonacci, 100 percent is seen as a complete reversal, to the initial point before the reversal took canter stage. All you have to do now is create your trend line and keep an eye on it.

Fibonacci retracement is best seen when there are a lot of activity in the market, which indicates that the market is trending. Fibonacci's retracement provides traders with information on the direct phase of the market's next bounce.
What are Bollinger Bands? How do they apply to Crypto Technical Analysis? With which other tool or indicator do you combine Bollinger Bands to analyze a Crypto? Justify your answer.
Bollinger bands are one of many technical analysis tools. They are associated with numerous trend-lines that move in either direction as prices move away from the simple moving average. Bollinger bands were created by John Bollinger and are particularly popular in the crypto world since they can be used to characterize the state of assets, whether they are overbought or oversold.
Bollinger bands are important to use when conducting Crypto scientific analysis because they allow you to spot entry and thus know when to buy or sell based on the status of the assets, which is quite easy with the help of Bollinger bands. The procedures for using the Bollinger bands indicator on a cryptocurrency chart are outlined below.


Login in with any market of your choice (I used Binance), clicking on the symbol on the right side, and selecting Bollinger bands.
There are various indicators that can be paired with Bollinger bands as shown in the figure; however, I chose two indicators: MACD, RSI, and the BOLLINGER BAND.
You can see the whole screenshots below; the objective for employing numerous indicators is to confirm trends; the indicators must function in tandem to validate trends.
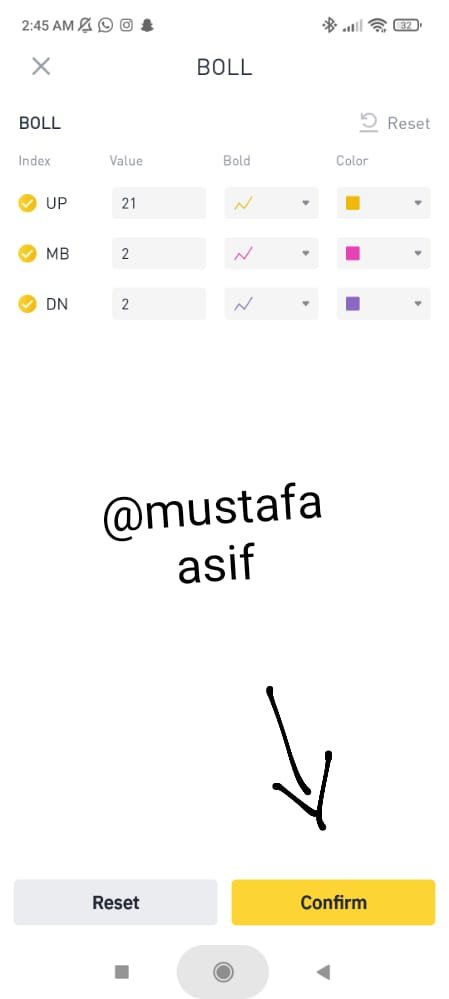

As you can see from the screenshot, all of the indicators are cooperating to confirm the trend.
Conclusion
Before committing to a cryptocurrency, both investors and traders research it. Investors frequently employ fundamental research, but traders frequently use technical analysis.
To get a holistic view of the project and its virtual financial assets, combining the two types of analysis is recommended. The main purpose of using these analytic tactics is to make money off of one's investment.
There are three main assessment areas in fundamental analysis. The project is evaluated, the asset's financial performance is examined, and on-chain data on the asset's performance is tracked.
On the other hand, technical analysis uses charts, price activity, and technical indicators to determine how well an asset has performed.
The indications given by the analysis can assist traders in determining vantage points for market entry and exit in order to maximize earnings.
This was a wonderfully immersive and educational experience. I am grateful to Professor @imagen for providing me with the opportunity to learn such valuable lessons.
#imagen-s4week7 #cryptoacademy #steemexclusive #imagen #blockchain #steemit
Gracias por participar en la Cuarta Temporada de la Steemit Crypto Academy.
Continua esforzandote, espero seguir corrigiendo tus asignaciones.