[How to Trade Cryptocurrencies Profitably Using TD Sequential]-Steemit Crypto Academy | S4W8 | Homework Post for @reddileep
Hello professor, @reddileep . I attended your lecture and found it to be very enlightening. Indicators are becoming very important in trading. I've come to present the task you've assigned to me.

(1)Define TD Sequential Indicator in your own words.
Indicators are critical in today's trading for determining buy/sell positions. Tom DeMark's TD Sequential Indicator is an indicator he created.
It's a useful indication for determining when an uptrend or downturn reaches the conclusion of its journey or makes a turnaround. Market reversals and corrections are easy to spot.
It aids in determining the best time to purchase and sell at the point of fatigue and reversal of an Uptrend or Downtrend.
The TD Sequential Indicator is used to identify early market turning moves in Japanese Candlestick Charts or Bar Charts.
The most crucial feature of this indicator is that it also displays Support and Resistance levels in the chart.
This indicator can be utilized in any time frame and in any market condition, although it is most accurate in a 4 hour or longer time frame.


(2)Explain the Psychology behind TD Sequential. (Screenshots required)
The TD Sequential Indicator has many features, including TD Support Levels, TD Resistance Levels, and two phases, TD Setup Phase and TD Countdown Phase.
In the charts, I'll use the Japanese Candlesticks Chart to depict this indicator. The TD Setup Phase is more crucial than the other two phases.
In the chart, there seem to be numbers above and below the Candles. The TD Setup Phase consists of two setups: TD Buy Setup and TD Sell Setup.
When the market moves in one direction, TD Buy Setup occurs, and when the market moves in the other, TD Sell Setup occurs.
The 9 numbers above or below the Candles in the TD Setup Phase. After 9 digits, the market may see a reversal or correction.
For the TD Buy Setup, when the market is trending downward and the numbers are below the Candles, there may be a correction or reversal after 9 numbers, at which point we can begin a Buy position.

When the market is trending upwards and the numbers are above the candles, there may be a correction or reversal after 9 numbers, at which point we can begin a sell position.

After 13 numbers, the TD Countdown Phase comprises of 13 numbers above or below the Candles, which often signify Support and Resistance levels.
(3)Explain the TD Setup during a bullish and a bearish market. (Screenshots required)
I'll go over the TD Setup technique in both a bullish and bearish market.
For Bearish Market
To begin, add the TD Sequential Indicator to the chart, and then, as we all know, TD Sell Setup occurs when the market is moving upward.
To do so, we must examine the Chart Candles for this Setup. For a Bearish Market or Setup, certain conditions must be met.
In TD Setup, there are numbers generated above or below the candles. So, we must examine the TD Number 1 Candle, which must be a bullish candle, and the closing of the TD Number 1 Candle must be higher than the close of the previous 4 Candles, all of which must be in a bullish direction, indicating that the market is overextended.
And, starting with the first candle, the next four candles should close above the previous four candles, and then, when 8 or 9 candles have formed, there will be a reversal, indicating a Bearish Market, where we can open sell positions.

For Bullish Market
When the market moves in the other direction, a Bullish Market Point or Buy Setup develops. When the market is trending downward, we can use TD Setup to determine the reversal point and hence indicate a bullish market.
To do so, we must examine the TD Number 1 Candle, which closing must be lower than the closing of the previous four candles, and then all candles from Number 2 should be in a downward direction.
There'll be a reverse in the marketplace after TD Number 8 or 9, which would be a Bullish Market, and we may begin a Buy Position there.
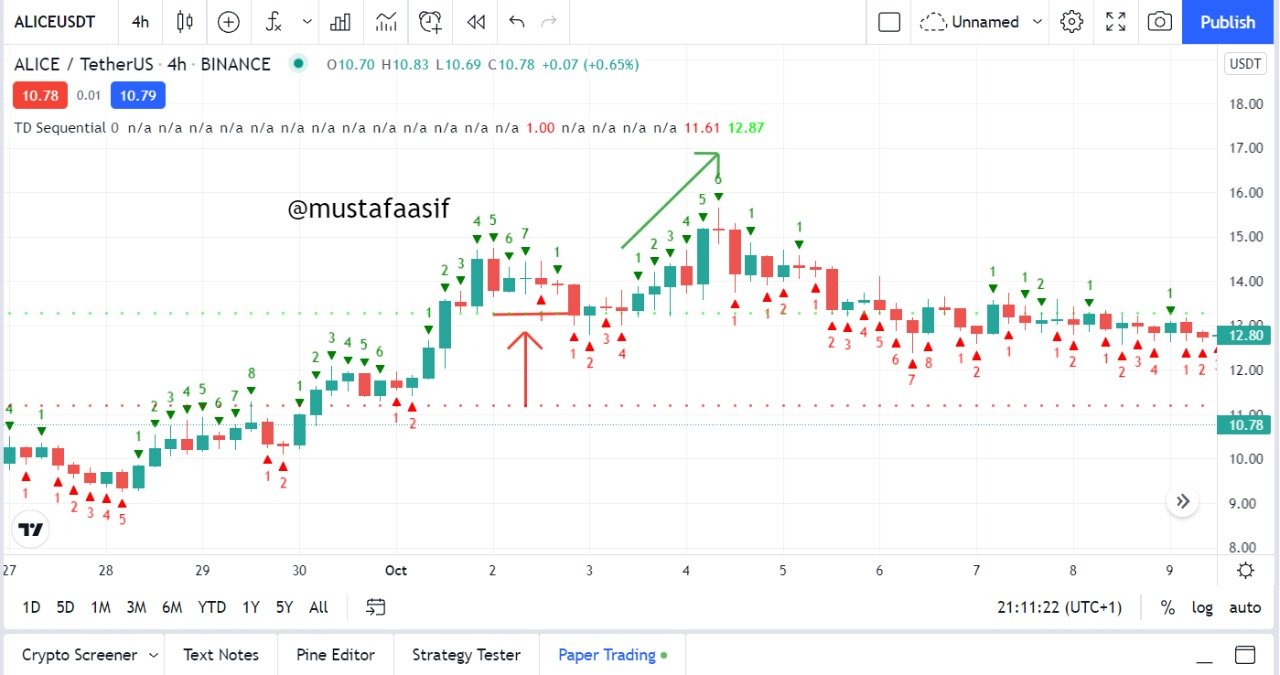
Here's an illustration of the TD Setup in a Bullish Market -
(4)Graphically explain how to identify a trend reversal using TD Sequential Indicator in a chart. (Screenshots required)
Well, the TD Sequential Indicator is used to spot market reversals and corrections. I'll demonstrate how to recognize Trend Reversal using the TD Sequential Indicator with an example of a chart.
Downtrend Reversal-
To begin, we must first insert the TD Sequential Indicator into the chart and then examine it. The market should be trending downward, i.e. its price should be falling.
Figures would be put to the Candles of the Chart after using the TD Sequential Indicator. We shall look for Candles to signal trend reversal if there is a continued downward trend.
We need to check at the TD Number 1 Candle, and its closure must be lower than the closure of the past four Candles.
As a result, the TD Number 1 Candle will travel downward, and it will continue to move downward until it reaches TD Number 8 or 9, after which there will be a Trend Reversal, and the market will go upward.
Here's an example of a trend reversal in action:

Uptrend Reversal
There should be a sustained uptrend before we look for Candles to indicate a trend reversal.
We must examine the TD Number 1 Candle, and the TD Number 1 Candle's closing must be higher than the closing of the past four Candles.
As a result, the TD Number 1 Candle will travel upward, and it will continue to do so until it reaches TD Number 8 or 9, at which point there will be a Trend Reversal, and the markets will go lower.
Here's an example of a trend reversal in action:

(5)Using the knowledge gained from previous lessons, do a better Technical Analysis combining TD Sequential Indicator and make a real purchase of a coin at a point in which TD 9 or 8 count occurs. Then sell it before the next resistance line. (You should demonstrate all the relevant details including entry point, exit point, resistance lines, support lines or any other trading pattern such as Double bottom, Falling wedge and Inverse Head and Shoulders patterns.)
A chart of HBAR/USDT derived from a trading view is shown below. I've pinpointed the entry and exit points for trade. I put a support and resistance line for that. For me, TD 8 is the starting point for trading. I need to get out before the major resistance level of 0.43. At that point, I'll leave the trade. The next resistance line may plainly be seen around 0.43.

therefore I bought it around 0.411 as TD 8 number has appeared which u can see in the chart and here is the ss that i bought.

Then I have a resistance at 0.43 which I thought will pull back the price so I placed the order and sold it at 0.43

That was the technical analysis utilizing the TD Sequential Indicator, which provided me with a considerable profit in a short period of time, indicating that this indicator is really useful in trading.
Conclusion
Professor @reddileep, thank you for this very useful presentation. Indicators are becoming very important in trading. The TD Sequential Indicator is also a highly useful trading indicator because it may offer us with Entry/Exit Points.
This indicator can be used to spot trend reversals, market reversals, and corrections.
#reddileep-s4week8 #cryptoacademy #club5050 #steemexclusive #indicator
@steemcurator02
@steemcurator02
@steemcurator01
#club5050 😀