[Heikin-Ashi Trading Strategy]-Steemit Crypto Academy | S4W2 | Homework Post for @reddileep
[Heikin-Ashi Trading Strategy]-Steemit Crypto Academy | S4W2 | Homework Post for @reddileep From @mustafaasif

Hello everyone, I am very excited to make a detailed overview on the Heiken Ashi technique in my homework.
♝Question no: 01

So, let’s start from the very beginning. Whenever a person decides to start trading in crypto, what is his/her ultimate goal? To earn profit, right? And in order to do so, that person must be aware of all the intricacies that the crypto market possesses. And how exactly can a person be aware of these intricacies? Yes, you guessed it right! By learning about multiple techniques or indicators through which he/she can analyze or predict the market trends. So, one of these techniques is Heiken Ashi (Average Bar in English) technique, which is very useful in trading, understanding market trends and predicting future prices if understood and applied correctly.
The basic purpose that the Heiken Ashi technique serves is that it makes the analysis of charts easier as it makes the chart more readable. As we all are aware that the crypto market yields the most profit when the market is trending, and it is a must to analyze these trends and trend reversals in order to make good profit. Many traders incorporate Heiken Ashi technique in order to analyze or spot the trends and trend reversals in order to analyze when to enter and when to get out.
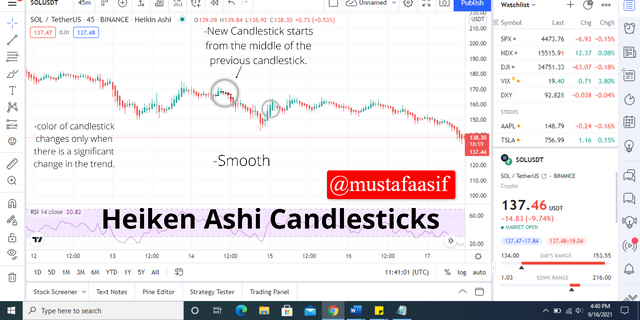
The Heiken Ashi chart is quite different from the normal chart because the candlesticks on the normal chart does not incorporate any information from the previous candle but in Heiken Ashi candles, the open, close, high and low prices of the previous candle are also incorporated. And this very fact makes the Heiken Ashi chart smoother and market trends are more readable in this chart as compared to the normal chart. It focuses more on the average to make analyzing easier. This Heiken Ashi chart tries to element certain unnecessary market noises to better understand, analyze and spot the market trends.
The unavailability of market noises allows for a clear depiction of market patterns and direction, which assists in predicting possible price moves. Heiken Ashi approach aids traders in determining when to hang on to a trade, freeze a trade, or determine if a reversion is imminent.
♝Question no: 02
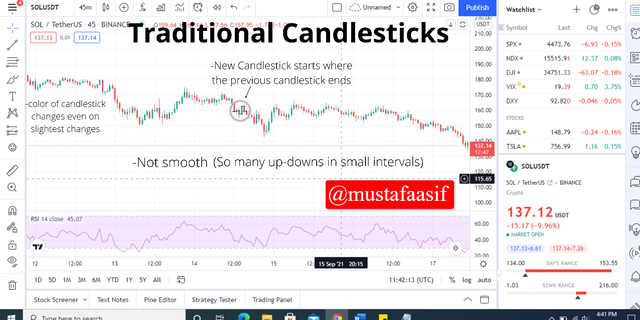
Although, the Heiken Ashi candlestick chart shares various characteristics with the conventional chart, but they both have significant differences. Let’s have a look around these differences and try to understand how the Heiken Ashi chart adds value to our trading. The key distinction between a typical chart and a Heikin-Ashi chart is that the Heiken Ashi chart employs an altered formula which is based on the averages of the current and the previous period meanwhile the traditional candlestick focuses on open, high, low, and close values. As a result, the approach produces a clearer chart that makes identifying trends and reversals simpler. Other than that, some of the price data and gaps in the Heiken Ashi chart are concealed meanwhile the traditional candlestick chart shows complete price data alongwith the gaps.
Other than that, every new candlestick on the heiken ashi chart starts from the middle of the previous candlestick, this is due to the fact that the data of the previous candlestick is also incorporated in the new candlestick, meanwhile on the other side traditional candlestick doesnot incorporate the data of previous candlestick so it mostly starts from the level where the previous candlestick is closed and sometimes it causes gaps as well. Heiken Ashi chart eliminates the market noises in order to make the chart smoother and to make the trends more identifiable. Moreover, the color of heiken achi candlestick changes only when there is a clear change in the trend as compared to traditional candlestick which changes colors even on slightest changes. These Heiken Ashi candlesticks portrays three main price action patterns which consist of bullish, bearish and indecision pattern, meanwhile traditional candlesticks possess various patterns.
♝Question no: 3
The formula for Heiken Ashi candlestick is different from the traditional candlesticks. This is due to the fact that the Heiken Ashi candlestick incorporates the data from the previous candlestick as well.
We are going to discuss the formulae for the Heiken Ashi Open, Heiken Ashi Close, Heiken Ashi High, and Heiken Ashi Low.
♝ Heiken Ashi Open:
Contrary to traditional candlesticks, a new Heiken Ashi candlesticks open from the middle of the previous candlestick. Which means that the formula for Heiken Ashi Open can be calculated by taking an average of the open and close of the previous candlestick.
♝ Heiken Ashi Close:
Heiken Ashi candlestick closes at an average of High, Open, Low and Close in order to make the chart smoother and easily readable, moreover it also makes the trends easier to be identified.
♝ Heiken Ashi High:
Heiken Ashi High is calculated by taking the maximum value of the High, Open and Close.
♝ Heiken Ashi Low:
Heiken Ashi Low is calculated by taking the minimum value of the Low, Open and Close.
♝Question no: 4
♝Trend Recognition:
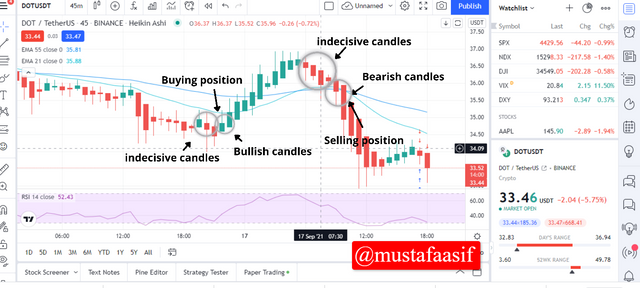
As we all are aware by now that the trends are easier to be identified in Heiken Ashi candlesticks as compared to the traditional candlesticks. The Heiken Ashi chart in the above figure demonstrates
• Bullish candlesticks. (Uptrend)
• Bearish candlesticks (Downtrend) and
• Indecisive candlesticks. (Trend reversal or trend pauser)
♝ Bullish candlesticks :
These suggest an upward trend of price, and these are usually identified by the position of wick i.e. if the wick positions itself above the candlestick, it portrays an upward trend.
♝Bearish candlesticks:
These suggest a downward trend of price, and these are usually identified by the position of wick i.e. if the wick positions itself below the candlestick, it portrays a downward trend.
♝ Indecisive candlesticks:
These suggest a trend reversal or trend pause of price and these are usually identified by the position of wick i.e., if the wick positions itself both above and below the candlestick, it is considered an indecisive candlestick.
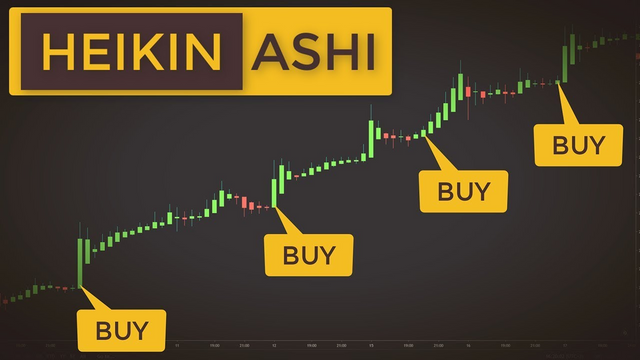
♝Buying Opportunities:
Now we know how to identify the trends in the Heiken Ashi chart. Now let’s have a look at the buying opportunities that this chart portrays. When the market is in an indecisive phase which can be identified through the indecisive candlestick and later a clear bullish trend is identified, we can take it as a buying opportunity or signal. Similarly, When the market is in an indecisive phase and later a clear bearish trend is identified, we can take it as a selling opportunity or signal.
♝Question no: 5
No, these signals don’t guarantee the said trend and market can move in any unpredictable direction. Moreover, the price in the Heiken Ashi chart sometimes varies from the actual market price, these discrepancies are common in faster time frames. Therefore, it is not suggested to use Heiken Ashi solely to make an entry or exit. However, it gives the base to the understanding. And by incorporating various other indicators such as 55-EMA and 21-EMA we can increase the reliability of our observations and trade more efficiently.
♝Question no: 6
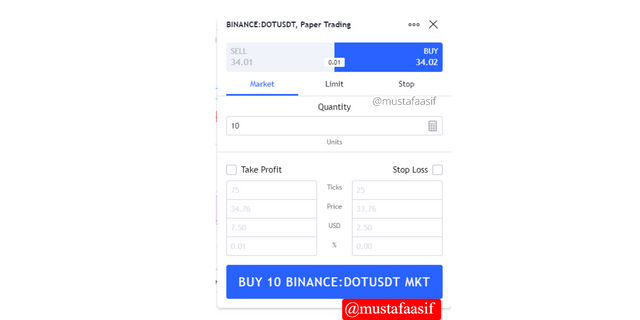
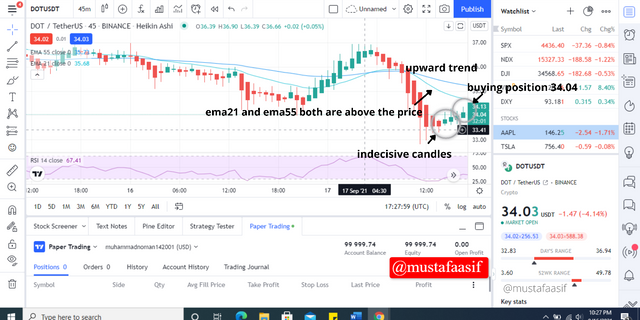
After analyzing the Heiken Ashi chart of Dot/Usdt by incorporating both EMA21 and EMA55, I realized that both the EMA21 and EMA55 are above the market price. I also witnessed the indecisive candlesticks and then bullis candlesticks right after that which indicated an upward trend. So, I placed a buying order at 34.01, after the bullish candlestick was spotted.
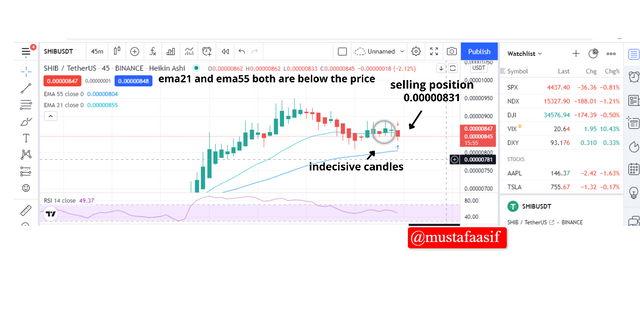
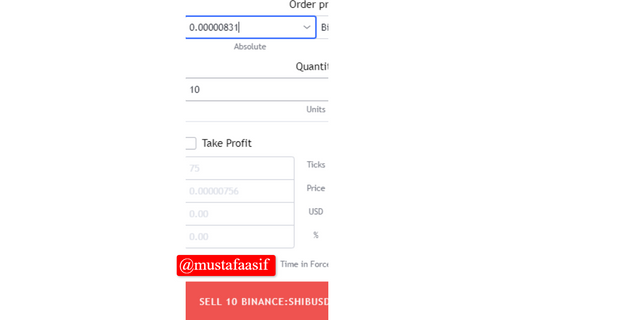
In the chart of Shib/usdt, I spotted that both EMA21 and EMA55 were below the price and there was an indecisive candlestick which was then accompanied with a Bearish candlestick displaying a downward trend, at that point I placed a sell order.
♝CONCLUTION
First of all, I have mentioned the basic overview of Heiken Ashi trading and how it works. And later, I mentioned the factors that make it different from traditional japanese candlestick chart along with graphical explanations. And after that, I have mentioned the formulae for calculating the high, low, open and close for the Heiken Ashi candlesticks and also mentioned why these formulae are modified. Moreover, with the help of graphs, I have mentioned the trend recognition concept in the Heiken Ashi chart and where do the buying positions lie and how to determine them. And after that I have made trades in buying and selling position by using the Heiken Ashi technique. I really appreciate the effort put in by reddileep to get us this wonderful piece of information. Waiting for more such homeworks from Professor @reddileep
#reddileep-s4week2 #cryptoacademy #pakistan #heikin-ashi #trading-strategy