Double Top and Wedge Trading - Crypto Academy S6W2 - Homework Post for @imagen
Hello, everyone!
Hello everyone, and welcome to season 6 week 2 of the steemit cryptoacademy. It's an honor to be a part of Professor @imagen's fantastic speech. The lecturer discussed how to trade with double tops and wedges. This is my submission for this assignment post.

Q1. EXPLAIN IN YOUR OWN WORDS THE CONCEPT OF DOUBLE TOP, DOUBLE BOTTOM AND WEDGES. HOW TO INTERPRET EACH ONE?
There are several technical analyses that traders use in order to forecast the market's future behavior. I'll go through the **Double Top, Double Bottom, and Putters. Let's get started.
DOUBLE TOP
A double top is viewed as a technical analysis tool that investors will use to forecast market action in the future. The letter M is commonly indicated by a double top. The double top is now considered a bearish movement or trend because when the market climbs high and hits your resistance level, falls down a little, and then hits the resistance level again and reverses, this is the optimum opportunity for a trader to enter a short place in the industry.
While not all double tops provide an accurate negative indication, some are misleading signals, and some may spin back to the uptrend after reaching the resistance level the second time, by which time a trader would have entered. So, in my view, when this pattern forms, a trader should wait for the trend to be confirmed before entering. Waiting for at least three red candles to appear is all that is required to confirm the trend. We may easily detect double top without any difficulty. Let's have a look at the screenshot I've included below.
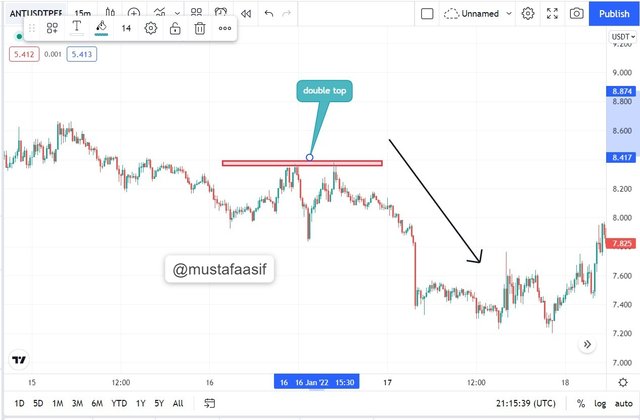
So, based on the chart above, this is a double top pattern that indicates a bearish trend. The market was heading upward until it reached a point when it began to fall. This point acts as a level of resistance. When the market begins to trend downward, it rises again, hits the resistance level for the second time, and then begins to trend downward. Traders are advised to take a short position at this time.
DOUBLE BUTTOM
Double bottom is the inverse of double top. The double bottom is viewed as a technical analysis tool that traders use to forecast market action in the future. The letter W is generally informed by the double buttom. Now, the double bottom is considered a bullish movement or trend because when the market goes down and hits its support level, then rises up a bit and hits the support level again and reverses, this is the optimum opportunity for a trader to establish a long place in the industry.
Although not all double bottoms produce an accurate bullish signal, some are false signals, and some may revert back to the downtrend after reaching the support level the second time, by which time a trader would have entered. So, in my view, when this pattern forms, a trader should wait for the trend to be confirmed before entering. Waiting for at least three green candles to appear is all that is required to confirm the trend. We can easily distinguish double buttom without any difficulty. Let's have a look at the screenshot I've included below.

So, based on the chart above, this is a double button pattern that indicates a bullish trend. The market was heading downhill until it reached a point when it began to rise. This point acts as a degree of assistance. When the market begins to rise somewhat, it falls again, hits the support level for the second time, and then begins to rise again. Traders are advised to take a long position at this time.
WEDGES
Wedges are another type of technical analysis that traders use to forecast the market's future movement. Wedges are drawn with either two descending trendlines or two rising trendlines. The rising wedge and the falling wedge are the two types of wedges. I'll go through the two kinds of wedges we have.
RISING WEDGE
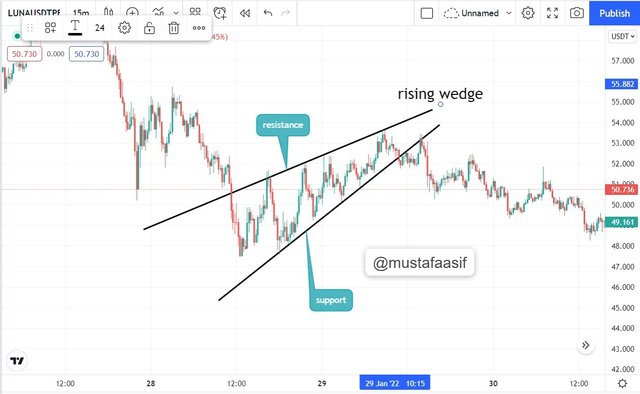
The rising wedge is an analysis that predicts a downward movement. Traders are predicted to take a short position in the market as a result of this study. This pattern has two rising trendlines that serve as support and resistance points, with the market hitting both lines moving up and down until a breakout happens at the support level, at which time the market begins to bearish. Let's take a look at an example of a rising wedge pattern.
FALLING WEDGE
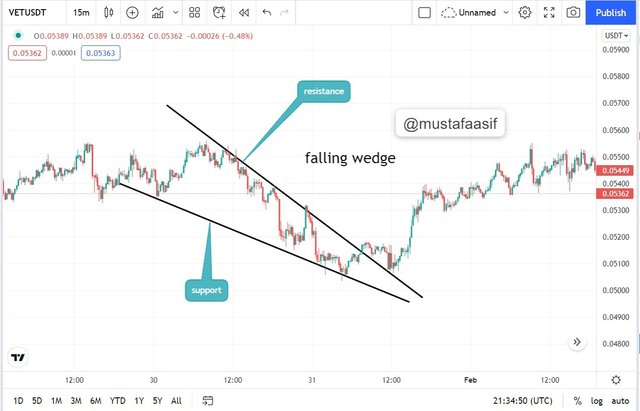
The reverse of the rising wedge pattern is the falling wedge pattern. The falling wedge is an analysis that predicts an upward movement. Traders are likely to take a long position in the market after conducting this study. This pattern has two falling trendlines that serve as support and resistance points, and the market will hit both lines moving up and down until a breakout happens in the resistance level, at which time the market will begin to bullish. Let's take a look at an example of a falling wedge pattern.

Q2. MAIN DIFFERENCES BETWEEN THE DOUBLE TOP AND THE DOUBLE BOTTOM. SHOW SCREENSHOTS.
Double Top
M informs of a double top when the price advances up to the resistance level, then comes down a bit and trends up again, hitting the resistance level for the second time. When this pattern forms and a reverse happens, we usually take a short position in the market.

Double Buttom
The double bottom is an indicator of W, in which the price drops down to the support level, then rises somewhat before trending down again and reaching the support level for the second time. When this pattern forms and a reverse happens, we usually take a long position in the market.
Q3. EXPLAIN AND HIGHLIGHT THE MAIN DIFFERENCES BETWEEN A BULLISH WEDGE AND A BEARISH WEDGE. SHOW SCREENSHOTS OF EACH.
Bullish Wedge
To begin with, a bullish wedge is also a falling wedge pattern, because the market tends to trend bullish when a falling wedge pattern forms.
This falling wedge pattern is generated by two downward sliding trendlines. The breakout always occurs at the resistance level, and the market begins to rise. The market will first trend downward, touching both trendlines, before rising and breaking the trendline at the resistance level. Let's look at the screenshot below.
Bearish Wedge
To begin with, a bearish wedge is also a rising wedge pattern, because the market tends to go bearish when a rising wedge pattern forms.
This rising wedge pattern is composed by two trendlines that are travelling higher. The breakthrough always occurs at the support level, and the market begins to decline. The market will first trend upward, reaching both trendlines, before falling and breaking the trendline at the support level. Let's look at the screenshot below.
Q4. EXPLAIN THE VOLATILITY THAT USUALLY EXISTS WITH RESPECT TO THE VOLUME IN THE WEDGES. WHEN IS THERE USUALLY MORE VOLUME? WHAT HAPPENS IF A PULLBACK BREAKS THE SUPPORT OF A WEDGE?
As previously noted, wedges come in two varieties. Which wedges are increasing and falling?
Now, rising wedges indicate a downward movement once the price has gone up and buyers are no longer strong enough to drive it higher, then there will be a reversal from uptrend to downtrend and this is when the support point is broken.
As the falling wedge happens, there is little volume when the market begins to trend upward. This indicates that rising wedges have higher volume when heading down shortly after a breakthrough than falling wedges.
Q5. FIND AND ANALYZE THE DOUBLE TOP PATTERN ON AT LEAST 2 CHARTS. SHOW YOUR OWN SCREENSHOTS.
First analysis on double top
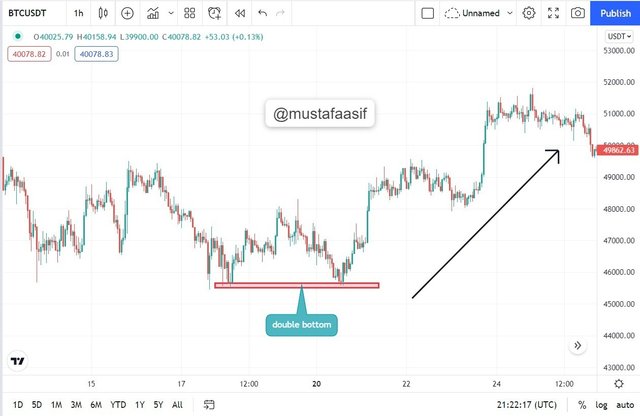
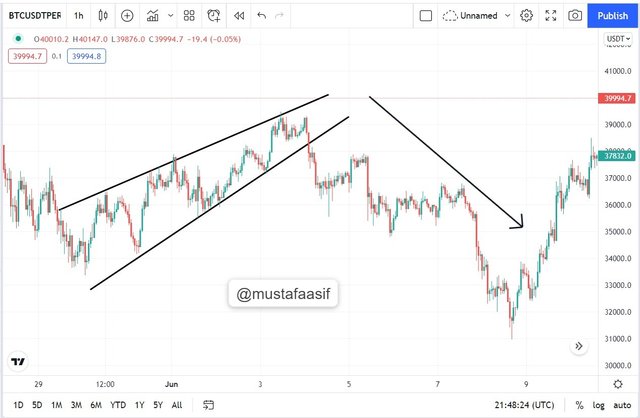
In this section, I'll look at the double top pattern on the BTCUSDT chart. Let's have a look at the image below.
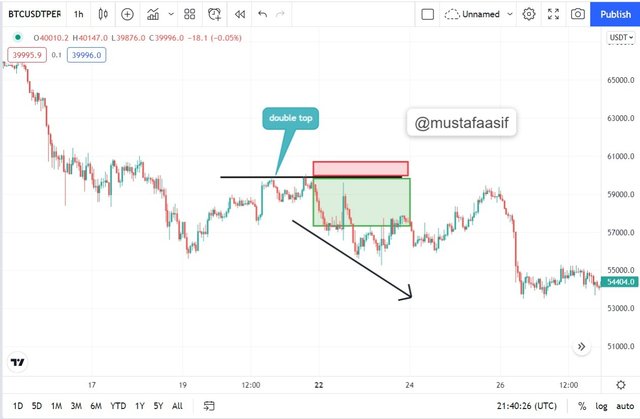
Let's have a look at the graphic I posted above. This is a BTCUSDT chart that I used to examine a double top pattern. In a particular timeframe, a double top indicates a bearish trend. I was able to locate the double top on the chart now. We can observe how the market trends up a little and then drops a little before trending up again. When it reaches the resistance level, it begins to turn bearish, and here is where I entered. As we can see, the market witnessed a big negative trend, and traders profited greatly from this research.
Second analysis on double top
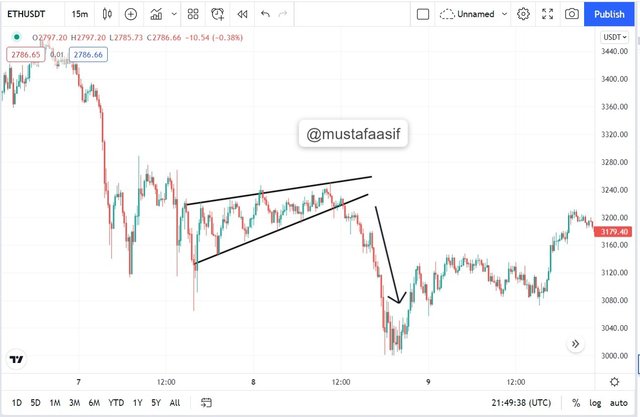
Using the ETHUSDT chart, I conducted another analysis based on a double top. This is comparable to the initial analysis I performed. To demonstrate that a double top indicates a negative trend. Let's have a look at the image below.
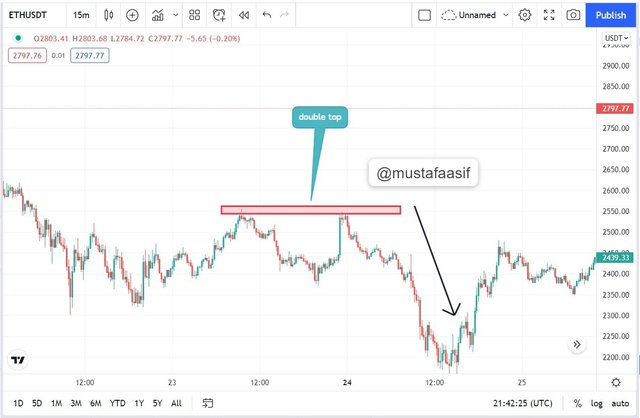
As we can see in the chart above, double tops are frequently in the shape of an M. The market is likewise trending in the same direction as the BTCUSDT chart. At least two points must strike the resistance level. This allows us to validate the trend and enter the market.
Q6. FIND AND ANALYZE AT LEAST 2 RISING WEDGES AND 2 FALLING WEDGES ON AT LEAST 2 CHARTS. SHOW YOUR OWN SCREENSHOTS.
First analysis on rising wedge pattern
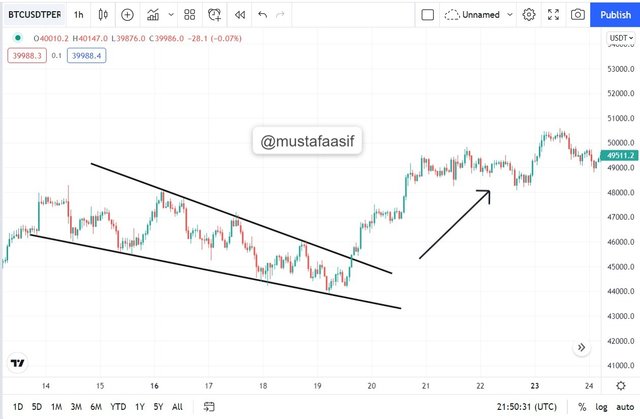
In this section, I will look at the rising wedge pattern using BTCUSDT. Let's have a look at the image below.
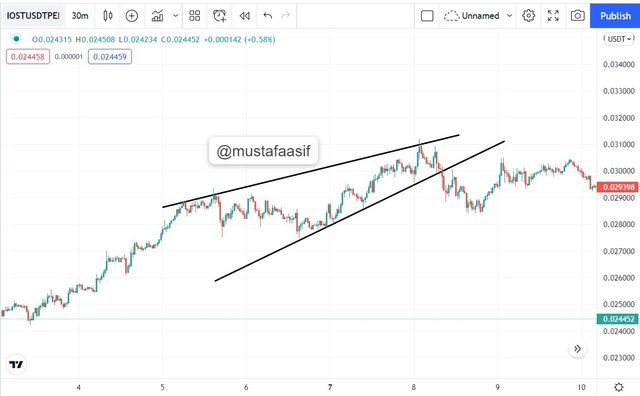
Let's pay attention to the chart I showed above. This is a rising wedge pattern, which often indicates a negative trend in a specific timeframe. Now, I'm using the BTCUSDT chart to assess the market using this pattern. The two uptrending trendlines that I sketched are visible. This trendline serves as a point of support and resistance. The market was drifting slightly upward, hitting both trendlines but failing to break out. Now, until it reaches the place where the breakout occurred at the support point, this indicates a downward movement, and traders are advised to take a short position at this moment.
second analysis on rising wedge pattern
This time, I'll be using ETHUSDT to do the analysis. Take a look at the image below.
This is similar to the first study in that it shows that employing a rising wedge pattern signifies a negative movement in a certain period of time to traders.
Analysis on falling wedge pattern
I shall do another examination of the falling wedge pattern. Let's look at the screenshot below.
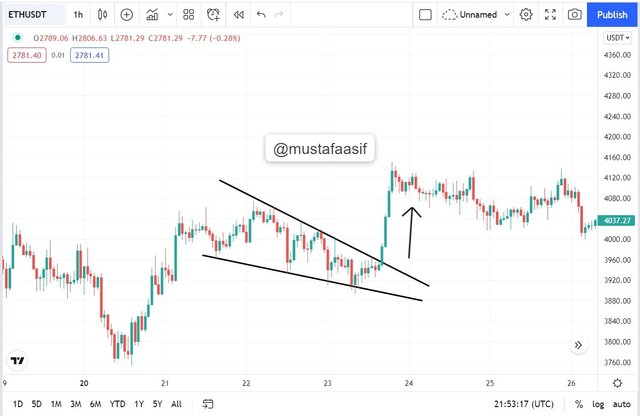
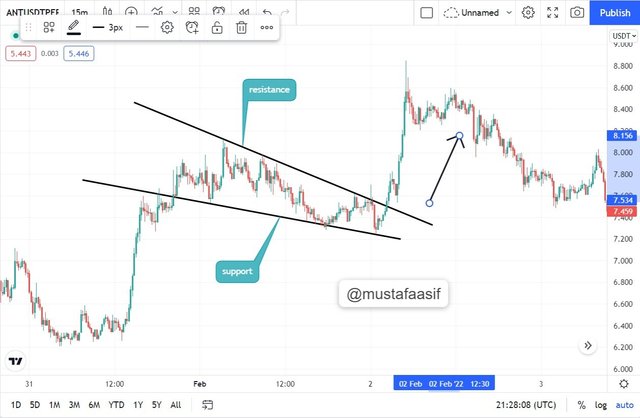
The falling wedge pattern is the inverse of the rising wedge pattern. The chart above shows the BTCUSDT and ETHUSDT exchange rates. The two downtrending trendlines that I created are visible. This trendline serves as a point of support and resistance. The market was drifting slightly downward, touching both trendlines without breaking out. Now, until it reaches the place where the breakout occurred at the resistance point, this indicates an upward movement and traders are advised to take a long position at this moment.
Q7. IMPORTANCE OF PATTERNS IN TECHNICAL TRADING.
We should be aware that while trading, patterns are really crucial. We also have different types of trading patterns that traders use. Chart patterns and candlestick patterns are examples of these patterns.
Candlestick stick patterns are frequently employed by traders to forecast market movement over a certain time period.
Chart patterns are the results of technical analysis performed by traders in order to forecast the future direction of the market, such as the double top, rising wedge, and falling wedge patterns taught by professor @imagen.
We have many different types of chart patterns, which may be accomplished by using a technical instrument to study the market. Trendlines and other tools are included in this category of technical tools. Using patterns in technical trading allows us to reduce our losses when trading. It is crucial to understand the optimal moment to enter and exit the market.
A trader can use patterns to forecast what the market will do next in a certain time frame. Patterns assist traders in trading breakouts. However, in order to get an accurate result, we should also add additional indicators to it in order to make a successful trading decision.
Q8. DO YOU FIND IT EFFECTIVE TO USE THESE PATTERNS IN TRADING? JUSTIFY YOUR ANSWER
For me, the answer is yes, because not all patterns are 100 percent correct. Because the market is so unpredictable, these patterns can only assist us forecast and limit our losses while trading. As a result, not every trade pattern is 100 percent accurate; some may go against our prediction, resulting in a loss of money.
For me, trading with confluence is preferable than trading with simply one pattern since it allows me to validate a trend by including both indicators as well as the pattern. When trading, a trader should not rely on a certain pattern. Trading using confluence allows us to choose the optimal timing to join the market while also being confident in the transaction we are about to enter.
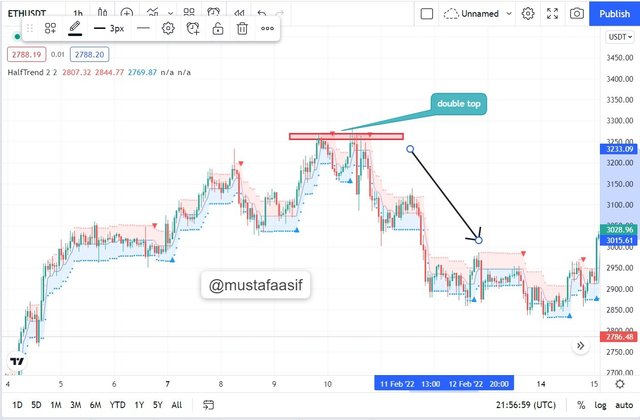
The screenshot above demonstrates this. To assess the market, I used a half trend indicator and a double top pattern. We know that the formation of a double top pattern indicates the beginning of a downturn. As a result, the indicator I created now also indicates a downturn by displaying a red arrow at the top of the chart. As a result of this, I have confirmed a market decline.
CONCLUSION
Trading with the double top and wedge patterns is an excellent strategy for traders to employ. It aids in forecasting future marketplace price action over a specific time period. Although these patterns are not perfect, we should strive to supplement them with indications to corroborate the trend. Thank you so much, professor @imagen, for a very informative and beneficial talk.
Cc-
Professor @imagen.
#imagen-s6week2 #cryptoacademy #club75 #patterns #pakistan #steemexclusive #steemitblog
Gracias por participar en la Sexta Temporada de la Steemit Crypto Academy.
Espero seguir corrigiendo tus futuras asignaciones, un saludo.
@steemcurator02