Crypto Trading Strategy with Triple Exponential Moving Average (TEMA) indicator - Crypto Academy / S6W2 - Homework Post for @fredquantum
.png)
What is your understanding of Triple Exponential Moving Average (TEMA)?
The Triple Exponential Moving Average
Moving averages have long been regarded as one of the most consists of standard, ideal for both novice and experienced traders. Simple moving averages, exponentially weighted moving averages, and graded moving averages are examples of different kinds of moving averages.
I'll go through the triple exponential moving average in further detail. The overall three - dimensional moving average is a sort of quantitative measure in the moving average branch that acts as an enhances skills of moving average that removes the delays and disturbances that other types of moving averages cause.
As compared to certain other positive signs like the chaotic indicator, ordinary moving averages also have the feature of many noise and that they are trailing signs that tend to send out warnings quite late whenever the pattern must have begun and traveled some distance. In general, the triple moving average overcomes this problem.
Patrick Mulloy invented the Three Exponentially Moving Average, which was originally employed in stock trading and was later used in cryptocurrency trading. It really takes three Exponential Moving Averages into account for its computations, and the lag is eliminated.
In this sense, we may state that the Triple Moving Average possesses the following characteristics:
It may be used to spot clear trends as well as pattern reversals.
It may also be used to define zones of support and opposition.
Through the crossings under two TEMA indicators of various periods, the Triple Exponentially Weighted Average (TEMA) may be utilized to identify buy and sell zones.

How is TEMA calculated? Add TEMA to the crypto chart and explain its settings. (Screenshots required).
Calculating the TEMA Indicator
The TEMA indicator will be calculated using three Exponentially Weighted Averages.
As the computation proceeds below, this will result in the reduction of sounds and delays.
TEMA = [ 3 * EMA 1 - 3 * EMA 2 + EMA 3 ]
where EMA1 is the Exponential Moving Average
EMA3 is the Exponential Moving Average of EMA1
EMA3 is the Exponential Moving Average of EMA2
The value of the Elastic Moving Average is 3 in the preceding calculation, and the products of the corresponding EMAs are 1 and 2. In addition, all of the EMAs are calculated using the same timeframe.
Adding TEMA on a chart
To add TEMA, I'll be utilizing the [tradingview.com](trading view.com) platform. We'll start by logging in and selecting on the indicator interface.

After clicking, we put Triple into the search field and then choose the Triple EMA, as seen below.

Settings
For its settings, I'll start by selecting on the setting button on the indicator tap and adjusting the usual duration from 9 to 25, as well as configuring the style to my preference.

Generally, the bigger the number of the period, the simpler it is to notice the price fluctuations. Increasing the time to 25 will provide a clearer sense of pricing movements.
Compare TEMA with other Moving Averages. You can use one or two Moving Averages for in-depth comparison with TEMA.
Comparing TEMA with the simple and Exponential moving average
The TEMA and the SMA

When we first compare the TEMA and the basic moving averages, we observe that the simple moving average takes into account the average data for a certain time. In relation to the TEMA indication, we have some sophisticated computations.
In terms of noise, the basic moving average is known to create some noise in its movement, but the TEMA indication produces less noise.
In conclusion, most moving averages are lagging indicators, with the simple moving average being one of them, however the computations in the TEMA indicator remove that feature, making it simpler to notice signals.
The TEMA and the EMA

When the TEMA indicator and the Exponential Moving Average are compared, they are both trend-based indicators used to discover trends as well as fund entry and exit locations in crosses when two are employed at the same time with a higher and a lower period.
Getting on to the economy, the TEMA is believed being more effective than that of the exponentially moving average since it reduces noise and lag in its signal output.
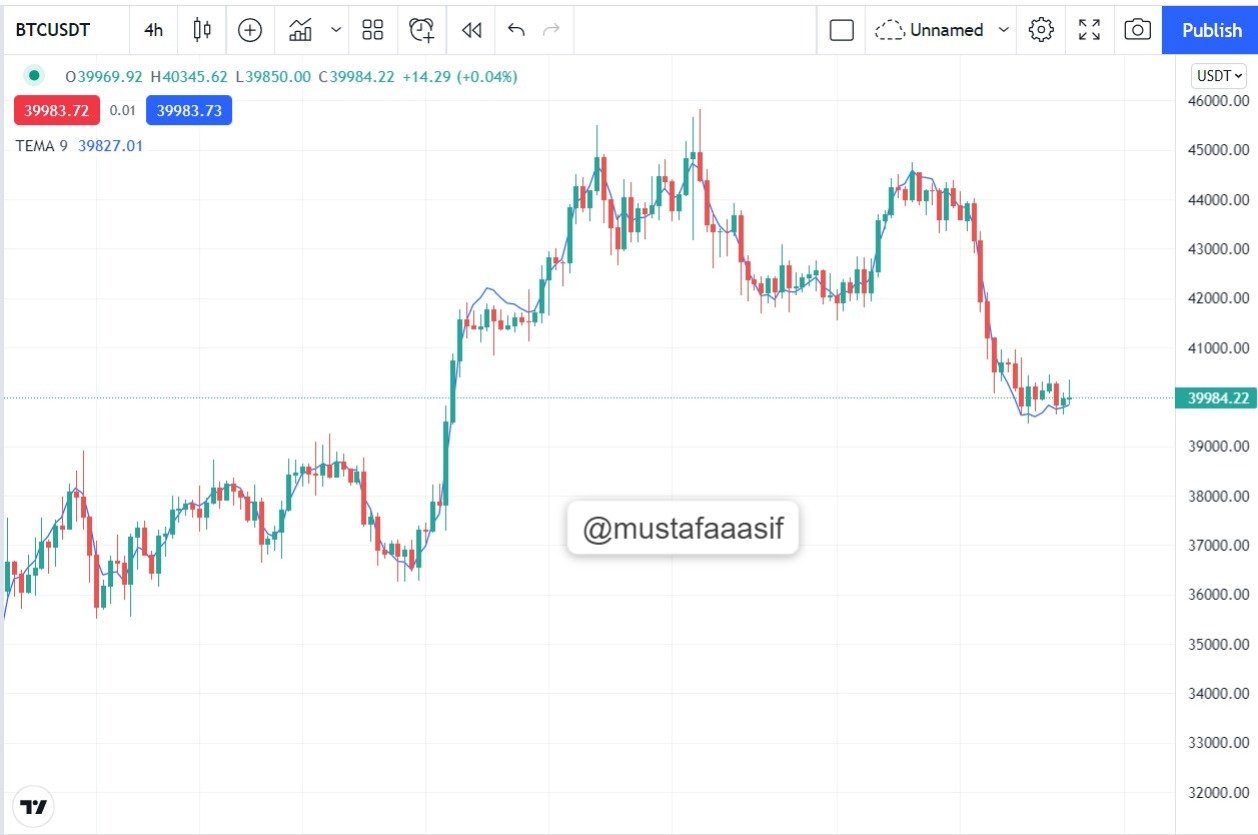
The EMA indication is known to function as a fluid support in an upswing, whilst the TEMA indicator functions as a dynamic resistance in an uptrend.
Explain the Trend Identification/Confirmation in both bearish and bullish trends with TEMA (Use separate charts). Explain Support & Resistance with TEMA (On separate charts). (Screenshots required).
Using TEMA for Trend Identification and Confirmation
Bullish Trend Identification
The TEMA indicator is a leading indicator indication that may be used to determine a stock's trend. Starting with the bullish trend, a bullish trend is visible when the prices and the TEMA Indicator angles are both pointing higher.
Following identification, the price of that asset will trade above the TEMA signal for additional confirmation. Prices are moving above the TEMA indication in the xrp/usdt 15min timeframe, as seen in the figure below.

Bearish Trend Identification
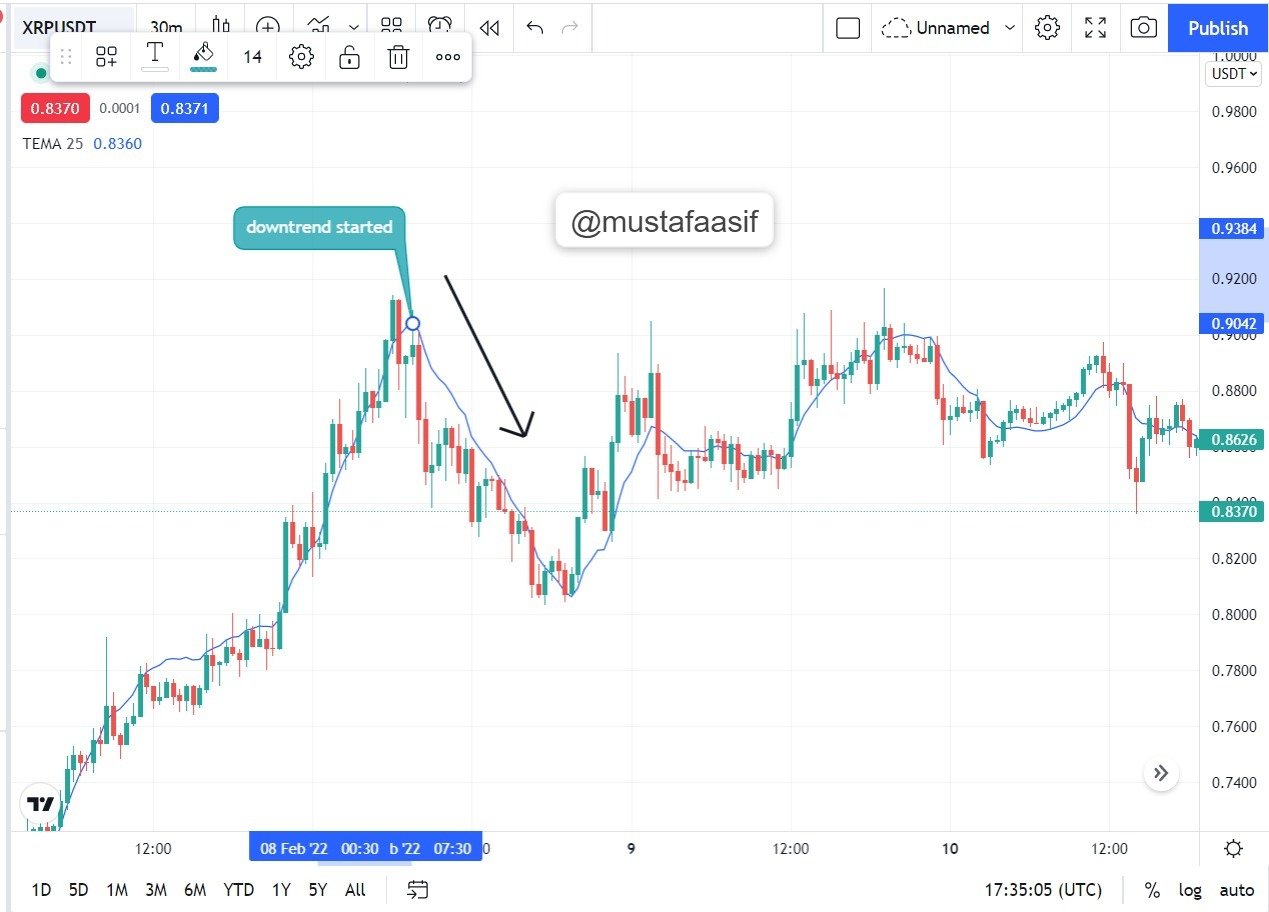
The TEMA indicator is a leading indicator indicator that may be used to determine an asset's negative trend. When the prices and the TEMA Indicator angles are pointing downward, we have a negative trend.
Following identification, the price of that asset will trade below the TEMA signal for additional confirmation. Prices in the xrp/usdt 15min timeframe are moving below the TEMA signal, as seen in the figure below.
Support and Resistance with the TEMA Indicator
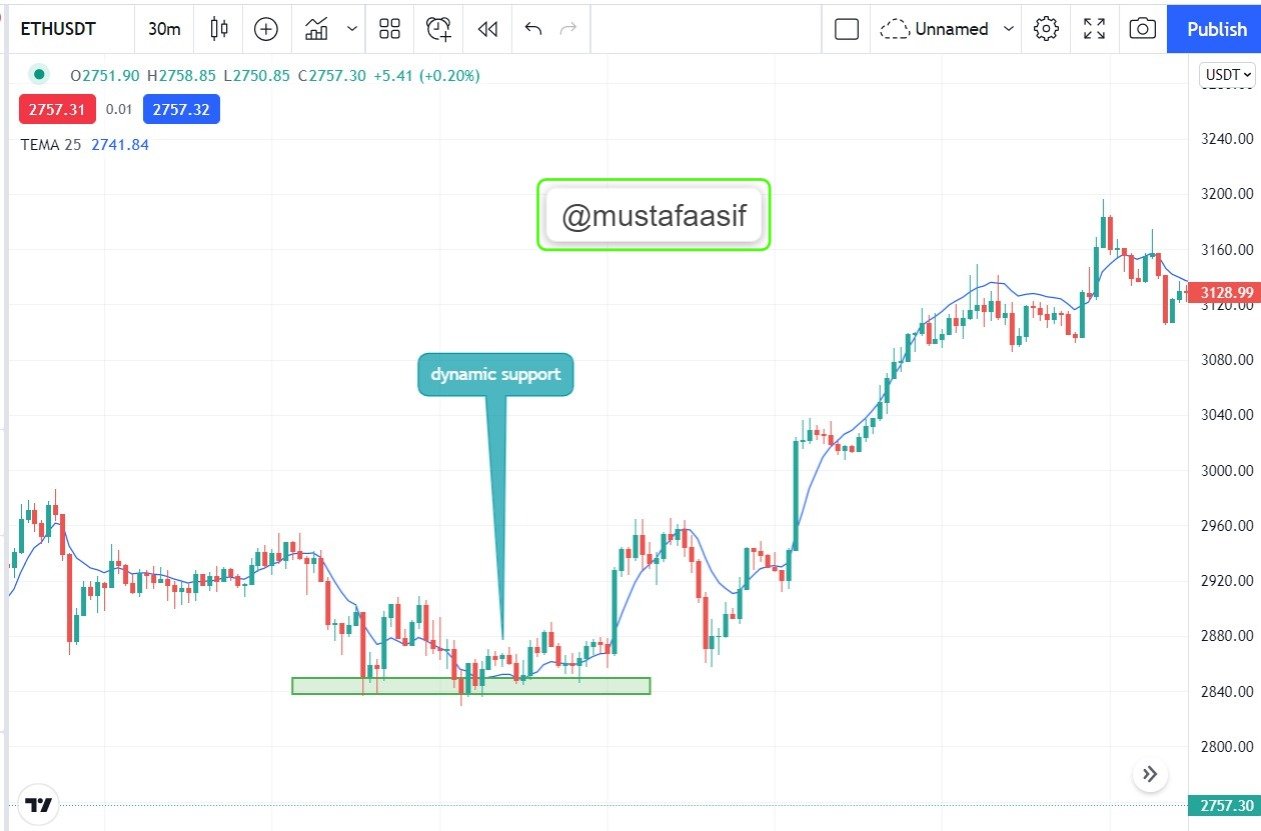
Dynamic Support
The TEMA signal may be utilized as a dynamic support level, and when combined with other confirmations, it can serve as a valid entry. The variable current value denotes a trend change from a downtrend to an uptrend.
In a negative trend, the dynamic support level is visible, and prices bounce off it.
In this sense, we might use this chance in a buy entry together with other signal confirmations.
Dynamic Resistance
The TEMA indication may also be utilized as a dynamic resistance level, and when combined with other affirmations, this can act as a valid entrance. The dynamic resistance level denotes a loss of momentum from up to down.
In a positive trend, the dynamic resistance level is visible, and prices rebound off it.
In this sense, we may use this chance to enter a sell trade with additional signal confirmation and adequate risk management.

Explain the combination of two TEMAs at different periods and several signals that can be extracted from it. Note: Use another period combination other than the one used in the lecture, explain your choice of the period. (Screenshots required).
The Combination of 2 TEMA trading strategy
One intriguing element of the TEMA Indicators is that we may utilize their varied durations and crossings to locate market entrance and exit points. This criterion is based on selecting one with a longer duration and one with a shorter time. In this case, the crossings will occur when the lower period TEMA crosses the higher period TEMA, resulting in signals.
I'll go with the TEMAs of 20 and 40 periods. Typically, the 20 period will be the fast moving TEMA, and the 40 period will be the slow moving TEMA, with its crosses providing distinct signals. Furthermore, the period selection is indicated to be a range for short term traders, while extending up to 100 and 200 would take a longer time in creating signals, which is especially suitable for long term traders.
Using the above eth/usdt chart, we start by determining the current trend, which should be a downtrend with no sideways movement. When the 20 TEMA crosses over the 40 TEMA, we have reached the conclusion of the downtrend. This indicates a trend change from a downtrend to an uptrend, and a purchase order can be placed.

Using the same eth/usdt chart as before, we start by determining the current trend, which should be an uptrend with no sideways movement. When the 20 TEMA crosses below the 40 TEMA, we have reached the conclusion of the uptrend. This indicates that the trend has shifted from an uptrend to a downtrend, and a sell order can be put.

What are the Trade Entry and Exit criteria using TEMA? Explain with Charts. (Screenshots required).
Trade Entry and Exit for a Buy Order
For such trade demonstration, I will use the two TEMA indicators, the 20 and 40 TEMA, as previously mentioned. With that decision, I shall follow the processes outlined below;
I'll start by putting the 20 and 40 TEMAs on my chart.
Because I'm searching for a buy entry, the current trend should be a downtrend, as shown by prices falling below the indications.
We then place a buy order when the 20 TEMA crosses over the 40 TEMA with at least two candlestick formations.
Setting a stop loss below the crossing, or preferably below another swing low point, and taking profit at a risk-to-reward ratio of 1:1 to 1:2 is the trade exit.

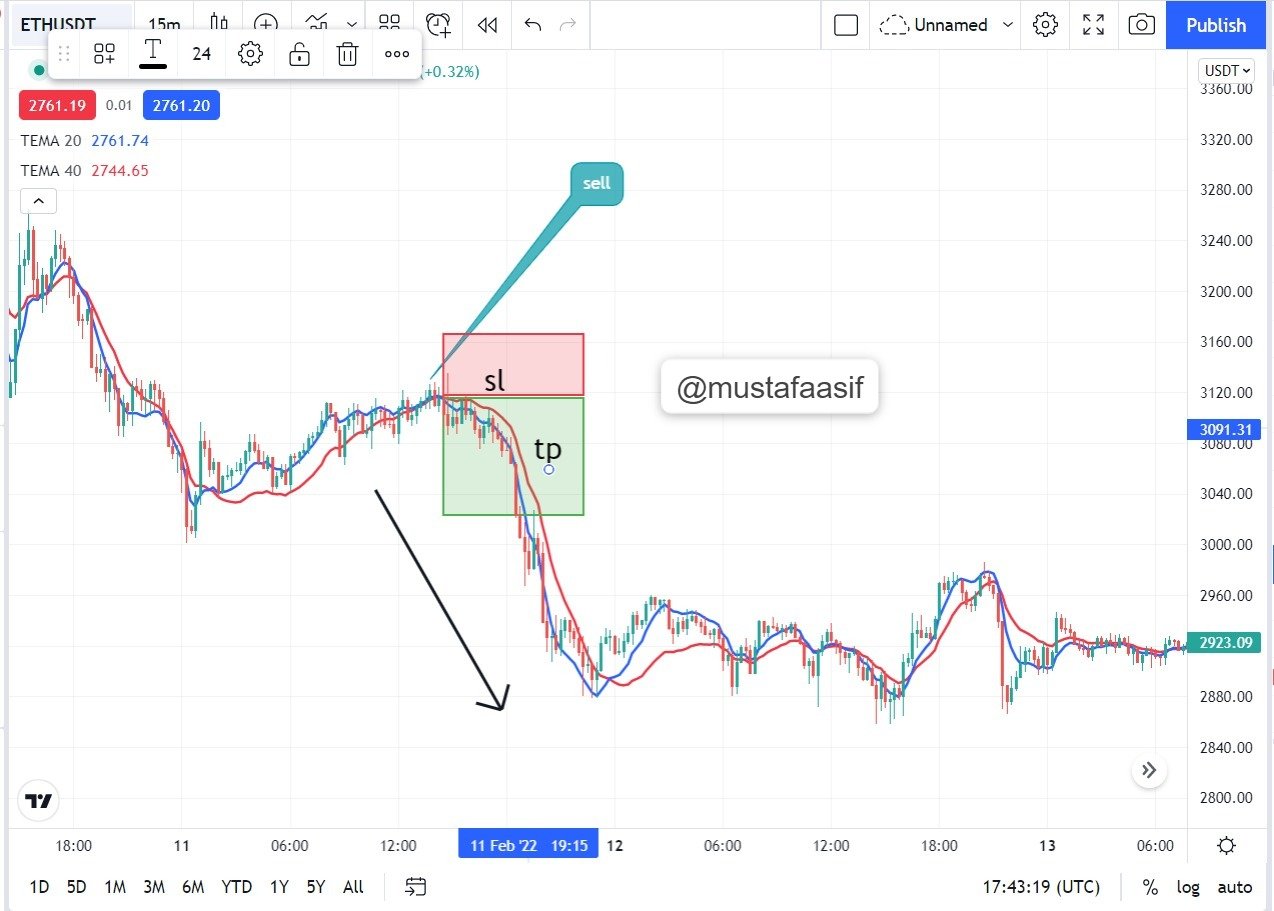
Trade Entry and Exit for a Sell Order
For such trade demonstration, I will use the two TEMA indicators, the 20 and 40 TEMA, as seen above. With that decision, I shall follow the processes outlined below;
I'll start by putting the 20 and 40 TEMAs on my chart.
Because I am aiming for a sell entry, the current trend should be an upswing, as shown by prices above the indications.
We then place a sell order when the 20 TEMA crosses below the 40 TEMA with at least two candlestick formations.
Setting a stop loss above the crossing, or preferably above the last swing's high point, and taking profit at a risk-to-reward ratio of 1:1 to 1:2 is the trade exit.
Use an indicator of choice in addition with crossovers between two TEMAs to place at least one demo trade and a real margin trade on an exchange (as little as $1 would do). Ideally, buy and sell positions (Apply proper trade management). Use only 5 - 15 mins time frame. (Screenshots required).
Real Sell order Trade with xrp/usdt
I'll start by putting the 20 and 40 TEMAs on my chart.
Because I am aiming for a sell entry, the current trend should be an upswing, as shown by prices above the indications.
We then place a sell order when the 20 TEMA crosses below the 40 TEMA with at least two candlestick formations.
Setting a stop loss above the crossing, or preferably above the last swing's high point, and taking profit at a risk-to-reward ratio of 1:1 to 1:2 is the trade exit.

I'll utilize the Simple Moving Average with a period of 25 for additional confirmation. As shown, when prices fall below the MA, it indicates the beginning of a downturn.

The deal is executed using #Binance Exchange, with an initial margin of $24usdt.


Demo buy trade with ltc/usdt
I'll start by putting the 20 and 40 TEMAs on my chart.
Because I'm searching for a buy entry, the current trend should be a downtrend, as shown by prices falling below the indications.
We then place a buy order when the 20 TEMA crosses over the 40 TEMA with at least two candlestick formations.
Setting a stop loss below the crossing, or preferably below the last swing low point, and taking profit at a risk-to-reward ratio of 1:1 to 1:2 is the trade exit.

A simple moving average with a period of 25 is used for further confirmation. When the price rises above the indication, it indicates a buy entry.


What are the advantages and disadvantages of TEMA?
Advantages and Disadvantages of TEMA Indicators.
Advantages of TEMA Indicator
Because it filters out noise and lagging in its computations, the TEMA Indicator produces more dependable signals than other moving average indicators such as the basic and exponential moving averages.
Through its crosses between higher and lower period indications, the combination of two TEMA indicators can provide strong entry and exit options.
Though, in actuality, its math for signal creation is difficult yet highly efficient.
The TEMA indicator is simple to use and may be used to spot trends by both novice and expert traders in the market.
This is a leading indicator, meaning that it delivers signals long ahead of time.
By adjusting the parameters, it may be utilized by both scalp and swing traders.
- Disadvantages of TEMA Indicator*
Because the TEMA indication is a leading indicator, it will need a great level of focus and patience in order to find the ideal position, which will be determined by the crossings of the dynamic support and resistance levels.
With the quick responsiveness of price change as a leading indicator, one may enter a trade too soon when it was a false indication.
Conclusion
The Triple Exponential Moving Average is an excellent indicator that may be used in place of the others. The triple exponential moving average accounts for the reduction of lagging that occurs in other moving averages.
The TEMA may be used to identify trends as well as levels of support and resistance. We can also utilize to locate entry and exit positions by using various crosses with greater and lower times.
#fredquantum-s6week2 #club75 #cryptoacademy #steemexclusive #pakistan #crypto #binance
Unfortunately @mustafaasif, your article contains Spun/plagiarized content.
The Steemit Crypto Academy community does not allow these practices. On the contrary, our goal is to encourage you to publish writing based on your own experience (or as per the mission requirements). Any spam/plagiarism/spun action reduces PoB's idea of rewarding good content.
Note: Any other try will mute you in the academy.