REPOST : Reading Special Bar Combinations –Crypto Academy / S5W8 - Homework Post for @sachin08
Here's the link to the expired post (https://steemit.com/hive-108451/@mukky23/reading-special-bar-combinations-crypto-academy-s5w8-homework-post-for-sachin08)

Image made by me on flyer maker

Explain Price Bars in your own words. How to add these price bars on Chart with proper screenshots?
In trading, we have various chart tools used for analysis. All these chart tools helps us one way or another in reading the markets movement. Today we'll be discussing about the Price bar. Price bar is a chart tools that helps traders perform analysis on any cryptocurrency pair within a specific period of time. The time range could be 1 minute, 5 minute, a day or even a month. The price bar consist of both vertical and horizontal lines in which traders can interpret in order to get meaningful information.
The horizontal lines found on the vertical lines are two in numbers usually called the open and the close. The close is usually located at the right hand of the price bar line and the open is located at the left hand side of the price bar line. The vertical line on the price bar chart is a straight line that consist of a it's highs and lows respectively. The upper part of it is it's high while the bottom of the line is it's low.
With that being said, the price bar provides all the information a trader needs to make his entry and exit of a trade. The main reason we trade is to make profit. The price bar doesn't just enhance our chance of increasing our profit but helps us minimize our losses as well. With that being said, we all can agree that the price bar is a vital tool and it provides all information needed for a trader to become successful.
The bar chart usually comes in two colours, green and red. If the market is heading in a bullish trend, the bar is in green colour. If it's moving in a bearish direction, the price bar is in red colour.
Adding the price bar on a chart is very easy. I'll be demonstrating this using screenshots.
I'll be logging in to tradingview for this demonstration.
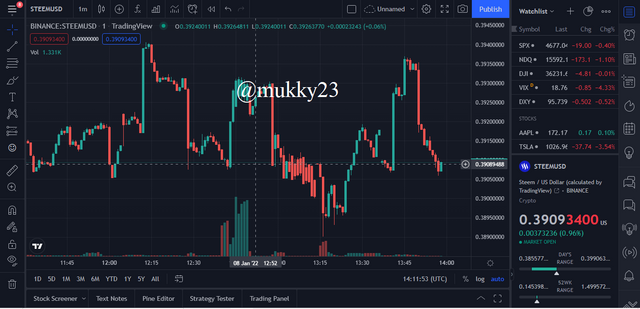
Upon display of your chart, click on the The candle signs on top of your screen. It'll give you a list if options to choose from.
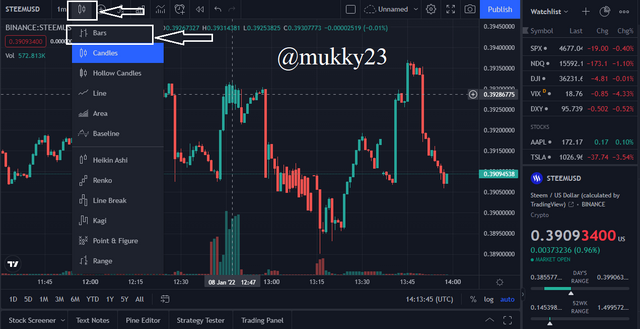
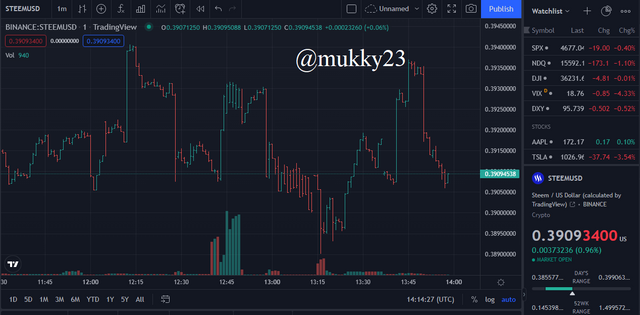
Go ahead and click on The "bar" option and the price bar will be automatically added to the chart.
Just like we have mentioned earlier, the price bar can contribute immensely to the success of every trader as it helps identify entry and exit points in a trade. The following image provides you with the full anatomy of the price bar.
Open: This is the opening part of the price bar. It is the small horizontal line by the left hand side of the vertical line.
Close: The closing point of the price bar is where it's formation ends. It is seen at the right hand side of the vertical line.
Low: This is the lowest point in which price of a particular assest can go within a specific period of time. It is the bottom of the vertical line.
High: This highest point is the top of the vertical line It is the highest point that price of an assest can go.
How to identify trends using Price Bars. Explain for both trend. (Screenshots required)
Identifying trends using the price isn't that difficult. It's almost similar to that of the candlestick pattern. Let's take a look at how to identify uptrend and downtrend using price bar.
Higher high: This is considered when the high recorded on the present day is higher than that of the previous day.
Higher low: This means that the low of the present day is higher than the low of the previous day.
Lower high: Lower high is when the high of the present day is lower than that of the previous day.
Lower low: Lower low occurs when the low of the present day is lower than that of the previous day.
Uptrend Identification
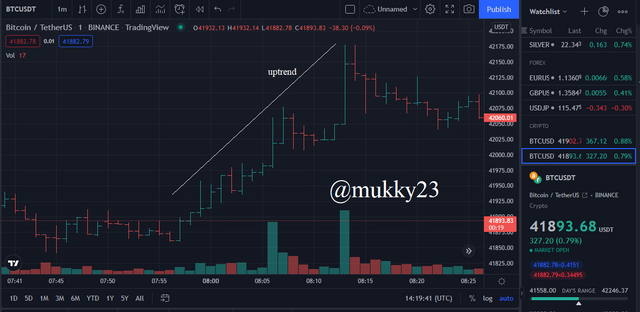
An uptrend (bullish trend) can be spotted by combinations of higher highs and higher lows. A healthy uptrend can easily be spotted because the price bar continues to create higher highs and these price bars are in green colour.
But in some scenarios, the uptrend sometimes is a combination of higher highs, higher lows and a few lower lows. With this combination, you get to see a series of green bars and red bars together but still in an uptrend direction.
Downtrend Identification
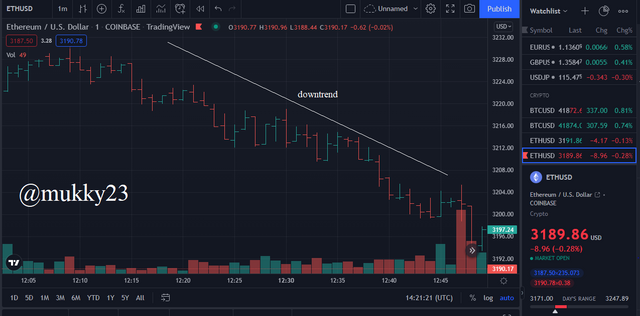
A downtrend can also be easily identified by a series of lower highs and lower lows. What makes it more of a downtrend is that as lower lows are being formed, each close is lower than the previous bar. So Whenever this is spotted on a price bar, it is said to be a downtrend.
Just as the uptrend, there is also combinations of lower highs, lower lows and highs as well. This would be a combination of red and green colour bars as well. Whenever a downtrend is about to start, that would be a perfect time for a trader to put in a sell order.
Explain the Bar Combinations for Spending the Day inside for both conditions. (Screenshots required)
Spending the Day Inside Bar consist of two conditions:
First of all, the high recorded on the second bar should be lower than the high of the first bar.
Secondly, the low recorded on the second bar should be higher than tthe low of the first bar.
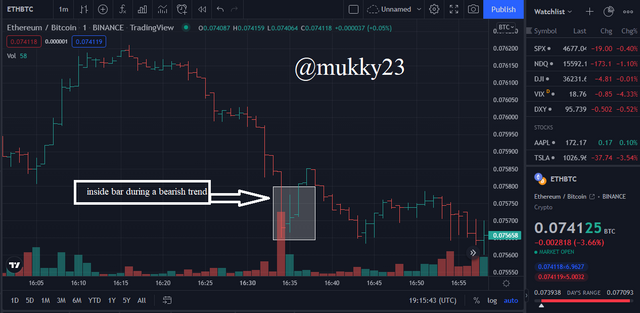
Inside Bar For Bearish Trend
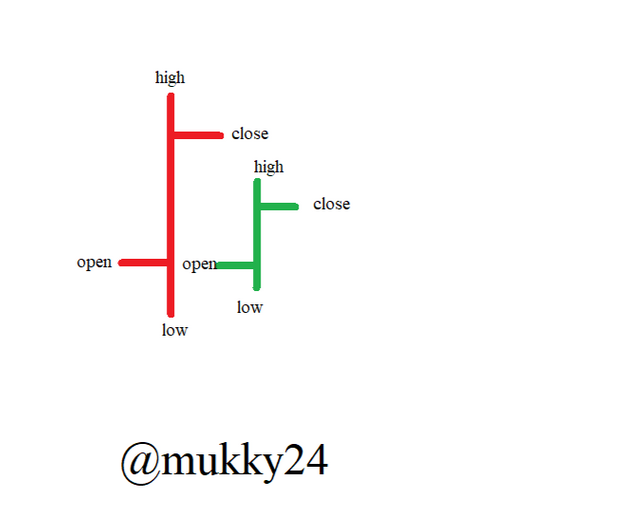 image made by me on flyer maker
Spending the day inside bar is a bar that has been completely covered by it's previous bar. If we pay attention to the image provided below, we can see that the bearish bar completely covers the bullish bar. In this case, the bigger bar can be referred to as the superior bar because it totally covers the bullish bar. We can also see that the low of the inside bar is higher than that of the superior bar.
Inside Bar for bullish Trend
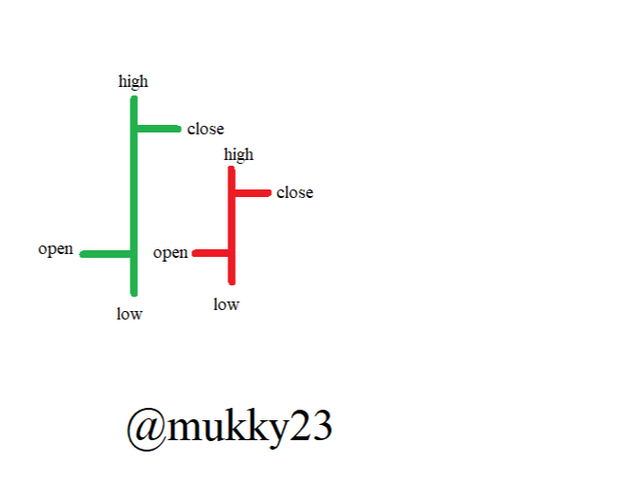 image made by me on flyer maker
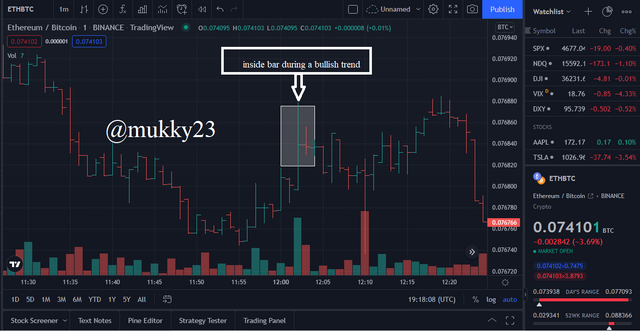
When an inside bar is formed when trading, it could mean a trend reversal. If a market is in a bullish trend and an inside bar occurs, then there might be a bearish reversal coming up. The inside bar also signifies indecision in the market and might not be necessary mean a trend reversal. As we can see in the image provided below, the bullish bar completely over shadows the bearish bar.
The superior bar here is the bullish bar as seen in the image provided below while the inside bar is the bearish one. In this case, the close if the bearish bar must be lower than the close if the bullish bar.
Explain the Bar Combinations for Getting outside for the Day for both conditions. (Screenshots required)
The bar combinations required for getting outside for the day might just be a trend reversal bar combination. In this scenario, the high and low of the present bar is outside the range of the previous bar.
Bullish Condition
For the bullish trend condition of getting outside for the day, the opening price of the bar will be located at the bottom of the bar while the close of the price will be located at the top of the price bar. When this happens, it only signifies the buying of an assest of that particular period of time.
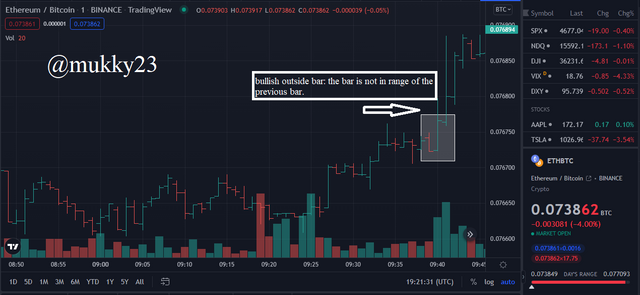
When we pay attention to the image provided above, we can see that the bar is just outside the range of the previous price bar and the bar and the open of the bar highlighted in the screenshot is at the low of the price bar and the close at the high.
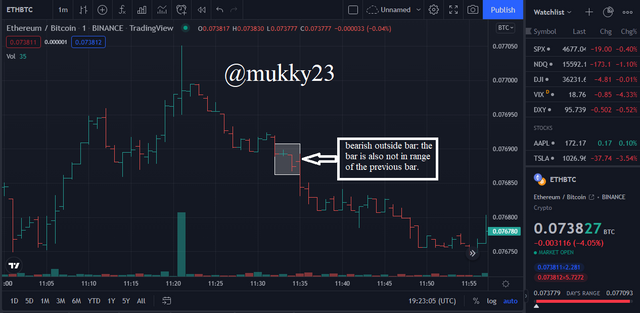
Bearish Condition
The same method literally applies for the bearish Condition as well. In this case, the opening price of the bar will be at the high and closing price will be at the low. When this happens, it means the overall salenof an assest if that particular period. Which means the the sellers in the market are stronger than the buyers.
Explain the Bar Combinations for Finding the close at the open for both conditions in each trend. (Screenshots required)
When we're talking about bar combination for close at the opening price, it usually occurs when the close of a price bar is nearly at the open of the bar or the low of the bar. When this happens during a bullish trend, it might mean a reversal of market direction to the bearish trend but when it happens during a bearish trend it means also means change of market direction to bullish trend. .
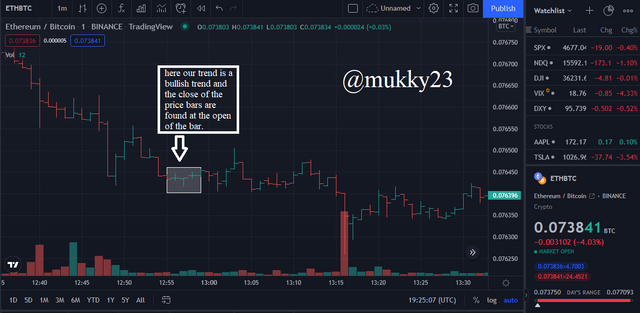
Uptrend Condition
This price bar combination may occur during a bullish trend to show a trend reversal might happen or to show continuation of that particular trend. Now, when the close and open of the bar are close to the high, this signifies that there might be a continuation of trend but when the close and the open of the price bar is new the low of the bar, then trend reversal might occur.
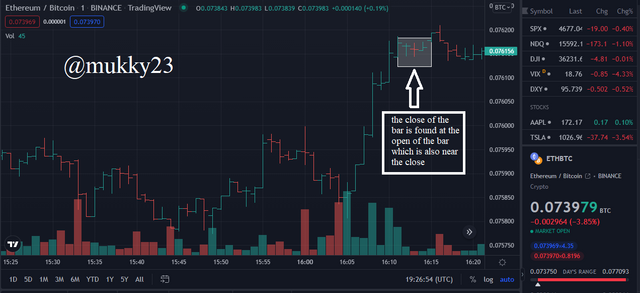
Downtrend Condition
Just like the uptrend, the close at the open bar normally happens during the bearish movement and can signify trend reversal or trend continuation. When the close and open is close to the low of the bar, it shows that there's going to be a trend continuation. But when the close and the open are close to the high of the bar, it tells us that there might be a trend reversal.
Conclusion
The importance of the price bar to traders can not be overemphasized. During the course of this lesson, I've discussed identifying trends using the price bar. We've also discussed price bar combination in order to spot trend reversal or trend continuation.
The main reason why traders trade is to make profit. In course of doing that, they do encounters losses as well. Using the price bar can minimize a traders chances of loosing and maximize thier profit making as long as the trader in questions knows how to source his/her information from the price bar. A very big thank you to @sachin08 for this wonderful lesson. Thank you.
Note: ALL SCREENSHOT WERE TAKEN FROM tradingview.com
@steemcurator01
@steemcurator02
Well done in your understanding of technical analysis. This, together with emotion and financial management have the potential of taking you to the next level.
Keep up!