Understanding Trends II - Crypto Academy / S5W3- Homework Post for @reminiscence01


Introduction

Hello Crypto Lovers,
I am happy that the academy is progressing in this season 5. This week marks the 3rd week in this season, and I hope you enjoyed the past weeks. I am Kehinde Micheal and my username is @msquaretwins here on this platform. I have gone through the lecture presented by professor @reminiscence01 on "Understanding Trends II" which is the continuation of the topic he taught in the first week of season 5 in the beginners class. Prof has explicitly explained the concepts of the said topic. Therefore, in this post, I will be answering the questions posted in the homework section. Happy reading!

Question 1
1a. Explain your Understanding of Trend Reversal. What is the benefit of identifying reversal patterns in the Market?

In finance trading, market may either be trending or ranging. When market is ranging, it means there is no clear direction at that particular period of time. But when market is trending, it means market has a clear direction. Now, a trending market has two possible direction; it may either be going in an upward direction or in a downward direction. During an upward direction in market, the forces of buyers at that time is stronger than that of sellers present in market and therefore the price is forced to move up. The otherwise is the case when market is trending in a downward direction.
Like a popular saying, "no condition is permanent", that is also true for any trending market. A trending market does not go in a certain direction forever. In fact, during a dominant direction, say bullish trend, price often stop for a while to retrace before it continue in it direction. This is called trend continuation. But the opposite is for Trend reversal. Trend reversal occurs when price turns and reverses totally from it current trend to the opposite direction.
Let's take a look at the picture uploaded below to explain a trend reversal.
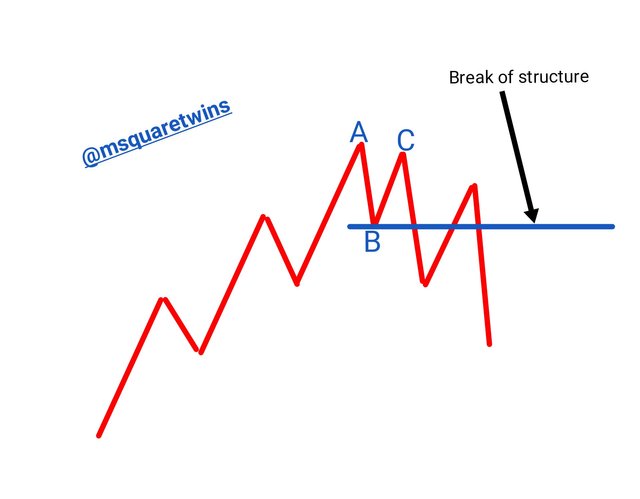
From the picture uploaded above, price has been in an uptrend making series of higher highs and higher lows but when it got to a point, the last high A formed and price retraced to form a low B. After which, another high C formed but could not go above the previous high A and then fell to break the last low B downward. At this point, price has moved from up trend to the downtrend because of the violation of the last low. This is bearish trend reversal. When this forms when market is in downtrend, it is called bullish trend reversal.
Benefit of Identifying Trend Reversal
Identification of trend reversal is very important to traders because;
• It helps traders to know when to exit current trend. Trend reversal identification plays an important role in market because it helps to determines the end of a current trend and this will help traders to know when exactly to leave the market.
• It makes early entry possible. Identifying reversal pattern helps traders to enter market at the beginning of a trend. Entering market at the middle or when market is almost at the end can be very dangerous, but a trader who can identify reversal pattern very well can take advantage of this to enter market at the beginning of a trend.
• It helps traders to secure profit. A Trader who do not understand trend reversal may think price is retracing when price is really making reversal of the current trend and as such he may lose the profit he has already made as a result of lack of understanding of trend reversal. So understanding reversal pattern will help traders to secure profit in market.

1b. How can a fake reversal signal be avoided in the market? (Screenshot needed).

There are different ways fake reversal can be avoided in market. Some of these ways are explained below.
i. Double confirmation Method
Ideally, traders normally wait for a last low to be violated in case of a bullish market to identify trend reversal. But a times, this is not always the case, we may have a last low violated and still market may not reverse, instead it will continue it bullish trend.
For instance, a chart of DOT/USD uploaded below is making a series of higher highs and higher lows but at some point, the price make a high as indicated by "m", and thereafter, it made a low b. The next high made could not break the last high "m". Then, the low "b" was broken downward for a while. But it was a surprise that price later continue upward trend despite the fact that there was a violation of low "b".
What happened here is a fake reversal. Now, how do we use double confirmation method to know if a reversal is fake or not? Double confirmation method is simply waiting for the low of the last high to broken before before entering market. For instance, to use double confirmation method for the example below, we will wait for the break of "k" which is the significant low of of "m" to be broken. It is after the break of "k" that we will be so certain of trend reversal, although, there might have been a break of structure before this, but this will give double confirmation.
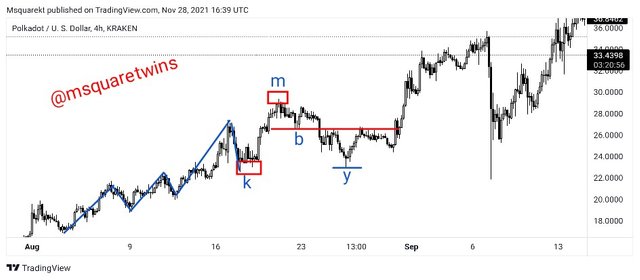 source
Now let's see another chart uploaded below. As we can see, the high "m" was the last high before a break of structure. In this case the low "w" which is the low of "m" and the target for our double confirmation was broken by low "g" and the market went in a downward direction. Therefore, a trader can avoid fake reversal by using double confirmation method.
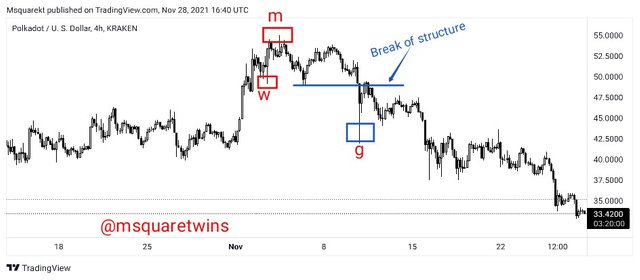 source
ii. Confirmation with Indicators
Another way to avoid fake reversal in market is to use indicator to confirm it. For instance, in the chart above, price is making a series of higher highs and higher lows, but at some point, there was first break of structure but this was a fake reversal as the price later continue in a bullish trend.
Now, one would have known with the use of indicator that the reversal is a fake one because if there is going to be real reversal, when price makes higher high formation, a lower low is expected from the indicator. But as seen in the left demonstration in the screenshot, both price and indicator made the same formation.
Now, see the second demonstration with blue lines at the right side in the image. Here, there was a break of structure and price made higher high formation and indicator made lower low formation which signifies a real trend reversal. The market went in a bearish direction. Therefore, with indicator in conjunction with trend reversal, one can avoid fake reversal pattern.
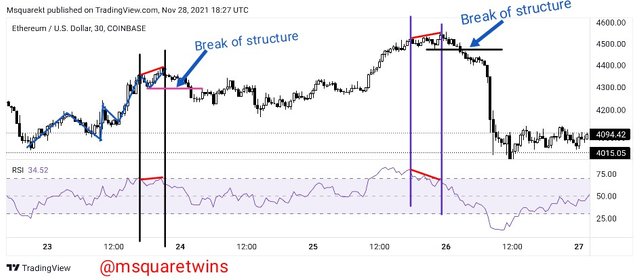 source
Question 2
Give a detailed explanation on the following Trend reversal identification and back up your explanation using the original chart. Do this for both bullish and bearish trends (Screenshots required).(a) Break of market structure.(b) Break of Trendline. (c) Divergence (d) Double top and Double bottom

(a) Break of Market Structure
When a market is trending either in upward direction or downward direction, there is always a retracement. For a trend continuation in a bullish direction, the new high must be higher than the previous high and the new low must must go beyond the previous low. In case of a bearish trend, the new low must be lower than the previous low and the new high must not go beyond the the previous high.
When the rule listed above fail, in case of a bullish market, it means the buyers could not continue to dominate the market and that the force of sellers outstrip that of the buyer and then, there will be a break of market structure, and in that case, price will reversal of trend from bullish trend to the opposite side. But the failure of the criteria for a bearish trend will cause a break of bearish market structure to the upside.
Now let's consider the violation of this criteria mentioned above for both bullish and bearish trend.
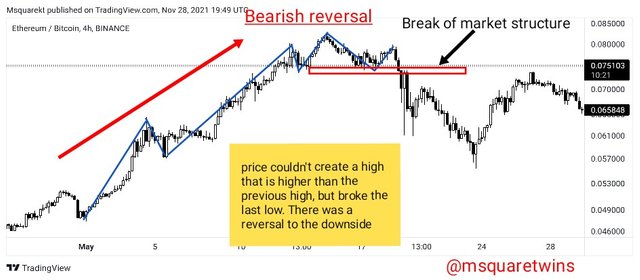
The chart uploaded above is a chart of ETH/BTC on a 4h Timeframe. As we can see, the price was creating a series of higher highs and higher lows which indicated that the market was in an uptrend. But at a point, price failed to create a new high higher than the previous high. At this point the buyers could not drag the price up beyond this level and this shows the weakness in the forces of buyers in the market at that particular period of time.
Then, in due time, the seller dominated the market and dragged the price downward to cause a break of the last low and this caused a break of structure of the current trend. This therefore means that the sellers have taken control of the market. After a break of structure, the price fell heavily to the downside.
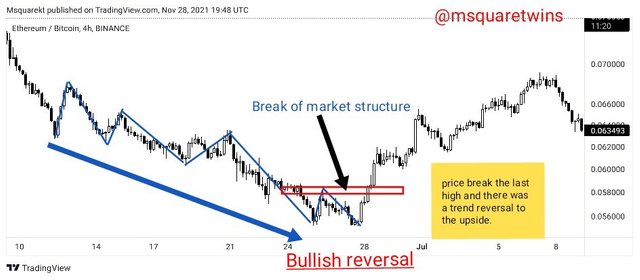
The chart uploaded above is the chart of ETH/USD on a 4hours Time frame. Price was creating a series of lower lows and lower high as seen in the screenshot. This means that this asset was on a bearish trend at that period. But at a point, the sellers' forces has started to be reducing and the price could not make a new low that goes beyond the previous low.
Then, shortly after this, there was a break of structure and this caused a violation of trend continuation to the downside. This means that buyers have hijacked the market from the sellers. Traders at this point who understand the market structure would have secured profit and exit a sell order to look for an opportunity to take a buy order. After the break of structure, the price traded in an uptrend.
(b) Break of Trendline
Trendline is an important tool that can be used to detect trend reversal in market. It is a line that is drawn to connect at least two lows for a bullish trend and at least two highs for a bearish trend. When price reaches the trendline, it often bounces back and continue in it direction. Violation of this means that the structure has been broken. That is if price gets to the trendline and does not reject from there, there will be break of trendline and this signifies trend reversal in market
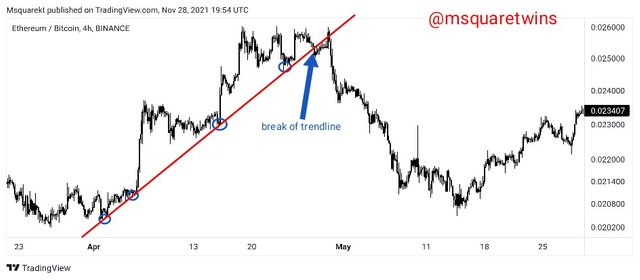
Looing at the chart uploaded above, we see how price keeps makimg series of higher highs and higher lows. It keeps bouncing back at the trendline which is drawn to act as dynamic support. As price keeps touching the trendline, it keeps rejecting that dynamic support line and this continue for a while. At a point, price approaches the trendline but it could not reject it as it previously did, but instead, breaks the trendline. After the break of this trendline, sellers took charge from buyers and there was a massive sell to the downside.
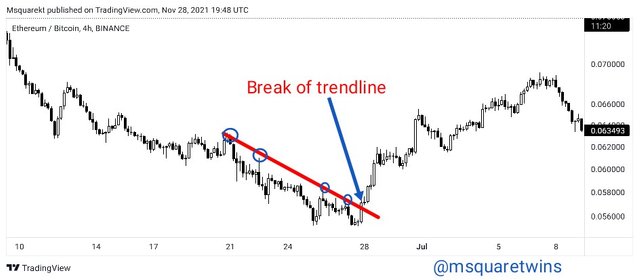
The chart uploaded above shows a bearish break of trendline. As we can see in the chart, price keeps making series of lower highs and lower lows and the price keep rejecting the trendline as every retracement leg approaches the trendline. Then after some time, the trendline which serves a dynamic resistance was broken to the upside. This shows a trend reversal from a bearish trend to the bullish trend. The price then traded in a bullish direction. A trader with an understanding of how to ise trendline to detect trend reversal would have taken advantage of that.
(c) Divergence
Divergence is another unique way traders use to detect trend reversal in market. This strategy is the combination of indicator and price action at the same time. Divergence is often occur when an indicator is doing opposite of what the price action on chart is doing. For instance, during a bullish trend, if price makes higher highs and the indicator makes lower low, this may signifies trend reversal. This means that the indicator is signalling a trend reversal. Traders who understand this, will close position on the current trend and position himself for a sell order. The two types of divergence we have in trading are bullish and bearish divergence.
Bearish Divergence
Bearish divergence occurs when price makes higher highs and the indicator makes a lower low. This indicates weakness in the bullish trend which has been displayed by early indication from the indicator. Bearish divergence shows a reversal to the downside. Traders with this knowledge will use it to exit all the current buy order while positioning themselves for a sell order.
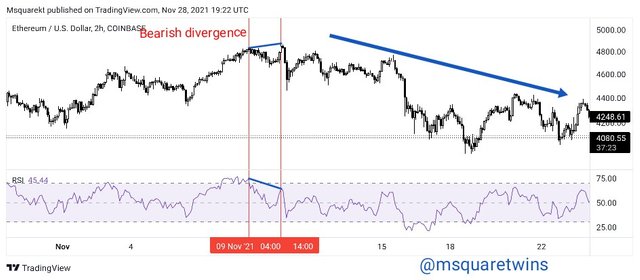
The picture above is a chart of ETH/USD on a 2H timeframe. As seen in the picture, the price was making higher highs and higher lows. But at a point, price makes higher high point but the RSI indicator makes lower low point. After the formation of this, we see how price reversed from bullish trend to bearish trend. Bearish divergence gives traders opportunity to exit a buy order and to position themselves for a sell order.
Bullish Divergence
Bullish divergence is the opposite of bearish divergence. It occurs when price action makes a lower low formation while the indicator makes a higher high formation and this shows the weakness in the current trend. It signifies trend reversal. Bullish divergence occurs at the end of a bearish trend. That is, when an asset has been trading in a downward direction for a while in such a way that the sellers force has weaken and that buyers have taken control .
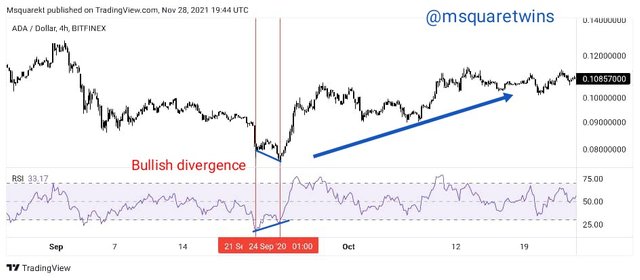
The picture uploaded above shows a bullish divergence between price and the indicator. As we can see, from the screenshot uploaded above, the price keep making series of lower highs and lower lows. But at a point, price makes lower low formation but the RSI indicator makes higher high formation. This signifies a trend reversal. There was a massive reversal to the upside after the divergence.
(d) Double top and Double Bottom
Double tops
Double tops is another way to detect trend reversal in market. Double tops occur during a bullish market. This forms after a new high retest the previous high without breaking the the previous high. This shows weakness in the forces of buyers and as such they couldn't push the price above the previous high.
For double tops to occur, these criteria must be met
• Price must not go beyond the previous high.
• The closing price of the new high must not be higher than the previous high.
The image uploaded below shows an example of double tops on a chart.
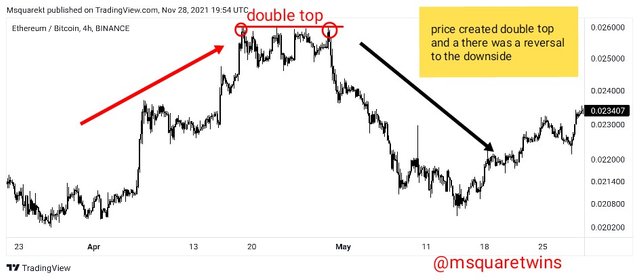
Double Bottoms
Double bottoms is the direct opposite of double tops. While double tops occur during a bullish trend, double bottoms occur during a bearish trend. In double bottoms, price fails to create a new low that is lower than the previous low. This means that the previous low is retested. This chart pattern signifies a trend reversal from a bearish trend to a bullish trend.
For double bottom to be valid, the following conditions must be met.
• The new low must not go beyond the previous low.
• The closing price of the new bottom must not be lower than the previous low.
The image uploaded below shows an example of a double bottom on a chart.
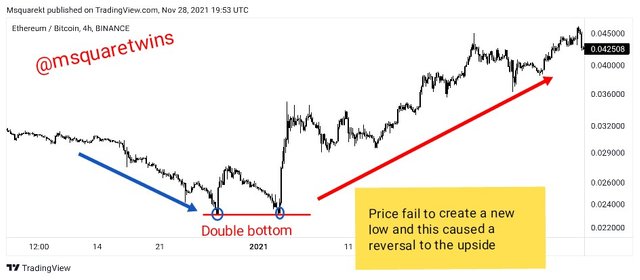

Question 3
place a demo trade using any crypto trading platform and enter a buy or sell position using any of the above mentioned trend reversal/continuation pattern.

For this question, I am going to be using MT4 platform to perform the demo trade.
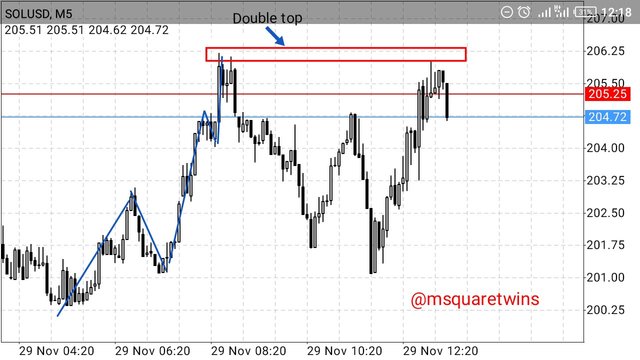
The chart below is a chart of SOL/USD on a 5 minutes time frame. As seen in the screenshot, the double top was spotted on this time frame as marked by a red box in the screenshot below.
• A sell order trade was taken after the close of the second top with an entry price of $204.75 and a stop loss order was place slightly above the high at $206.86. The take profit order was set at $201.63
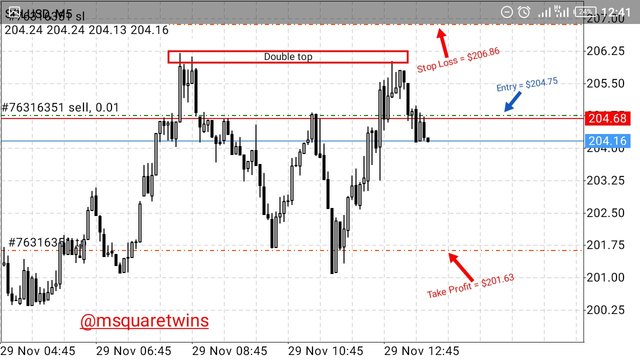
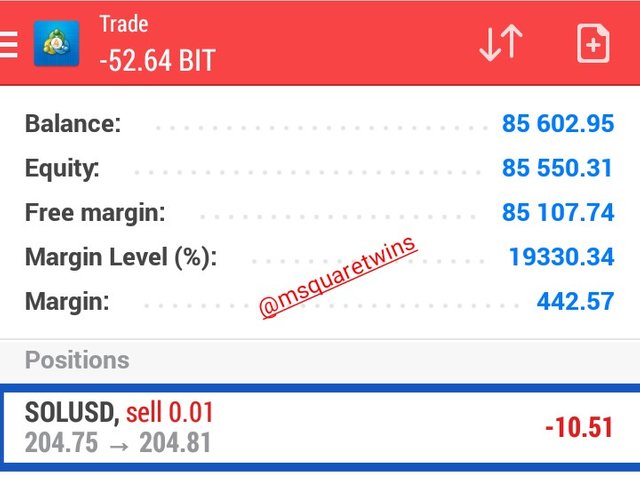
The picture below shows the running order of SOL/USD on MT4 platform.
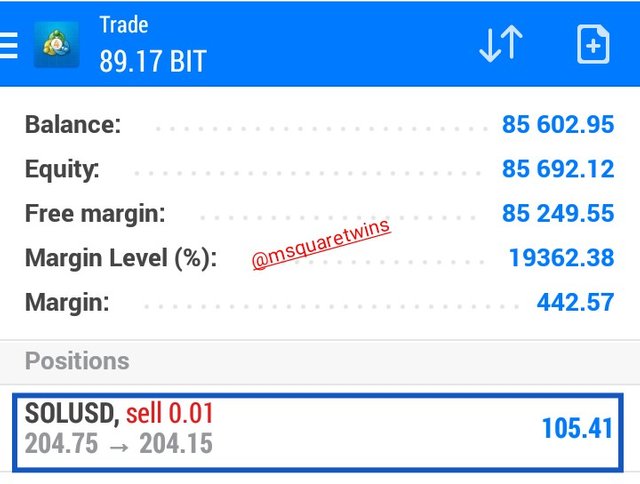
After sometime, I checked what price is doing and I found out that the trade is moving in my direction. We are almost at the middle of the Take profit as displayed below.
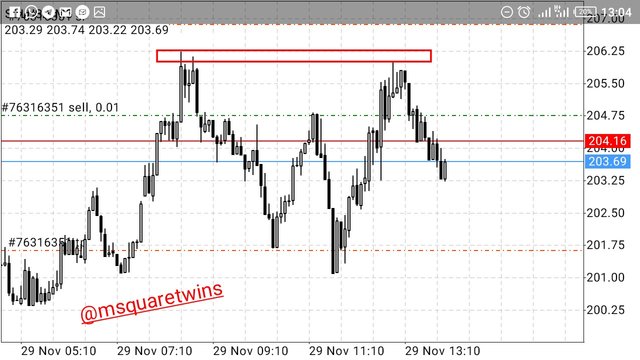
The picture below shows progression of SOL/USD sell order.

Conclusion

The best and the most basic thing a trader needs to know before taking a trade is to understand the current trend in market. Like a popular saying in trading "Trend is your friend". Honestly the say is very correct. This is because, knowing the direction of price in market will put a trader at least 30 to 40% in line of winning a trade. But it is not enough to know the trend an asset is currently riding. It is important to know when the trend is likely going to change so as to exit the current trend and secure profit that might have made during the current trend and to know where to take a good entry of the next trend. And this is where trend reversal pattern comes in.
In this post I have explained four different trend reversal pattern. I have explain reversal pattern in form of a break of market structure for both bullish and bearish trend with necessary screenshots. I also explain the use of trendline in detecting reversal. I did this for both bearish and bullish case. Not only that vivid analogy for bearish and bullish divergence chart pattern was clearly given in this post. And lastly, I explained the use of double top and double bottom for detecting price reversal pattern.
Special thanks to professor reminiscence01 for this great and wonderful lesson.
Thank you for reading
Cc:- reminiscence01
Hello @msquaretwins , I’m glad you participated in the 3rd week Season 5 of the Beginner’s class at the Steemit Crypto Academy. Your grades in this task are as follows:
Observations:
That's correct. Understanding trends and trend reversal is a crucial technical analysis key for traders.
Recommendation / Feedback:
I'm impressed with your submission. Thank you for participating in this homework task.
Thank you Professor @reminiscence01 for the review. I hope to participate in your next lecture.