Understanding Trends - Crypto Academy / S5W1- Homework Post for @reminiscence01

Introduction
Hello Crypto Lovers,
It is another great season already. Once again, I welcome you all to week 1 of season 5 in Steemit Crypto Academy. I am Kehinde Micheal and my username is @msquaretwins here on this platform. I hope you have been enjoying your week. I have gone through the powerful lecture presented by Professor@reminiscence01 on the topic "Understanding Trend" in the Dynamic Beginners' Course. Therefore, in this post, I will be answering the questions posted in the homework section. Happy reading!
Question 1
1a. What do you understand by a Trending market?
In a finance trading, market may either be trending phase or ranging phase and this has to do, most of the time with the forces of demand and supply, and this often occur based on the strength of buyers and sellers in market at a particular period of time. A trending market is a market that has clear direction of price while a ranging market is a market which has no clear direction.
Simply put, trending market occurs when there is a clear trend of an asset either to an upward direction or to a downward direction. This means that price of an asset is moving specifically toward a particular direction.
For a trending market in an upward direction, the price of an asset tends to be making significant upward movement such that the next high keep creating a high that is higher that the previous ones along the direction it is trending. Similarly, during a trending market for a downtrend, the price keeps moving in a clear down movement such that the price keep closing lower than the previous lows.
1b. What is a bullish and a bearish trend? (screenshot required)
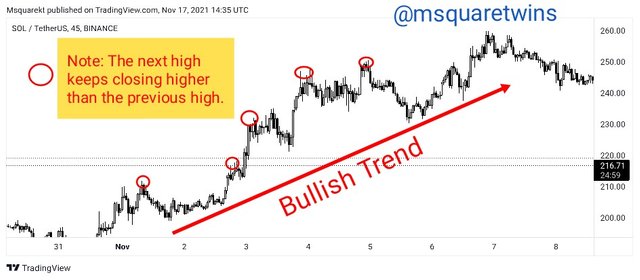
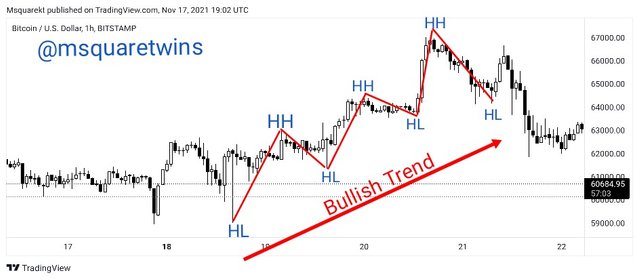
A bullish trend is a trend in which price moves specifically in an upward direction. It is a trend that is largely dominated by buyers. This means that the forces of demand is greater than the forces of supply and as such, the strength of the buyers in the market overpowers that of the sellers and consequently, buyers tend to move market upward causing the trend to be in upward movement. In bullish trend, price of an asset keeps closing above the previous high
 source
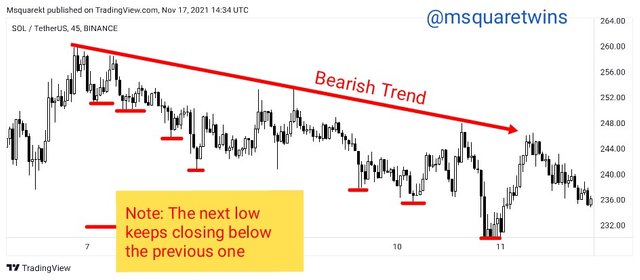
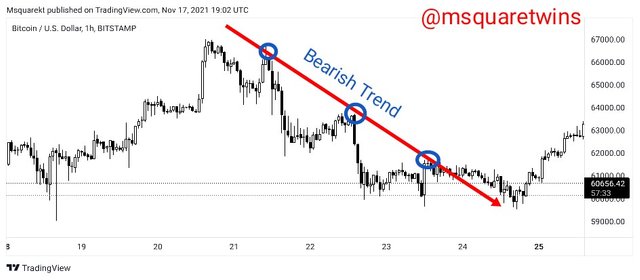
A bearish trend on the other hand is the direct opposite of a bullish trend. In bearish trend, the price of an asset move in a clear downward direction. For a bearish trend to occur, the market must be dominated by sellers or the supply forces in a market must outstrip the force of demand and this will cause the market to experience downward movement. Also, it should be noted that in bearish trend, the price of an asset keeps closing lower than the previous low.
 source
Question 2
Explain the following trend identification and give an example of each of them. (Original screenshot needed from your chart). Do this for a bullish and a bearish trend. i) Market Structure. ii) Trend lines
2i. Identification of Trend Using Market Structure
Market structure is another unique way to identify the trend of a market. We can detect the phase of a market through market structure. It can clearly tells us whether the market is in downtrend, uptrend or the market is ranging. The candlestick pattern or the bar chart is used most of the time in determining the trend of a market through structure. Although, some traders used line chart in this case as well.
For Bullish Trend, the market structure will have upward movement. In this case, the price will be forming high that is higher than the previous high which is often regarded as Higher High (HH) and at the same time forming low that is higher than the previous low which is known as higher low (HL).
The formation of this series of higher highs and higher lows shows that the force of demand is stronger than the supply and that the buyers dominate the market at that point in time and this causes the price to shut up and as such the trend experiences upward movement which is known as bullish trend.
The great knowledge of bullish trend with market structure will enable traders to position themselves to know the exact time to take a trade and to decide the right time to close positions.
 source
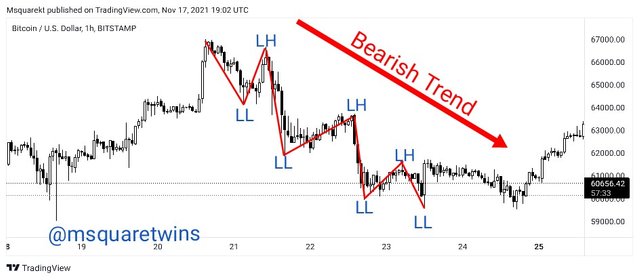
Similarly, For Bearish Trend, the market structure tends to move in a downward direction. This means that the price at this time keep creating high that is lower than the previous high which is often called Lower High(LH) and also forming lows that are lower than the previous low which is often regarded as Lower Low (LL).
The constant formation of Lower Highs (LHs) and Lower Lows(LLs) indicates that sellers have strong power against the buyers. I.e The forces of supply are greater than that of demand at that point in time and consequently, the trend experience a downward movement which is otherwise known as bearish trend.
 source
2ii. Identification of Trend Using Trendline
Another wonderful tool employed in market to determine the current phase in market is trendline. Trendline is a line drawn to connect two lows or two highs for a bull or bear market respectively. It aids in identification of market direction at a particular period of time.
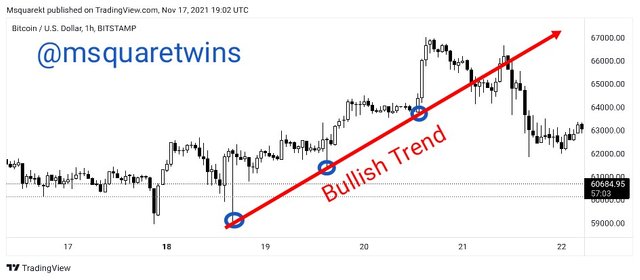
Trendline can be used to detect Bullish Trend. To identify bullish trend with trend line, we connect at least two previous lows that the price has made in market. For this to be valid, the price must keep trading above the trendline drawn such that the trendline will act as dynamic support for price.
 source
Similarly, Trendline can also be used to identify bearish trend. In this case, the line is drawn to connect at least two previous highs. The trendline drawn acts as dynamic resistance and the price keeps trading below the trendline.
 source
Question 3
Explain trend continuation and how to spot them using market structure and trendlines. (Screenshot needed). Do this for both bullish and bearish trends.
Market does not operate on a straight line. Even the trend that is perceived to have clear direction doesn't move exactly the way we think. There is often fluctuation in market. Therefore, during a trending market, market often pause and reverse in an opposite direction before it continues in it direction, and this is normal foe a healthy price action.
During a trending market, market will make impulse move in a direction and pause a bit move in opposite direction of the impulse move. The opposite movement against the dominant trend is called retracement. The retracement is always lower than the impulse move. This means that the retrcacement leg is always less than 100% of the impulse leg. After retracement, then another impulsive leg will be created and as such there will be continuation of the trend. This continuation of trend can be spotted using market structure and trendline
Spotting Trend Continuation Using Market Structure
We already know that price creates series of higher highs and higher lows and series of lower highs and lower lows for a bullish and bearish market respectively.
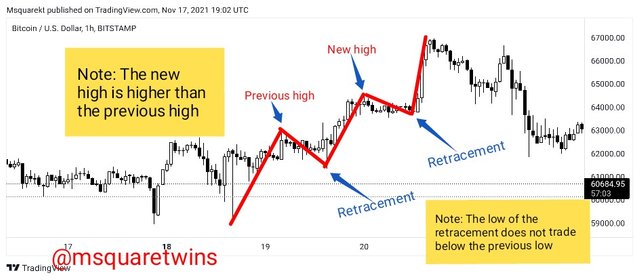
For a Bullish Trend, After an impulse move, a retracement leg follows and the retracement leg creates a low that is higher than the low of the impulse move. Thereafter, the next impulse move starts and the trend continues.
For a continuation of Bullish trend to be valid, the following point must be met;
• The low of the retracement leg must be higher than the low of the impulsive move
• The next high point must be higher than the high of the previous impulsive move.
 source
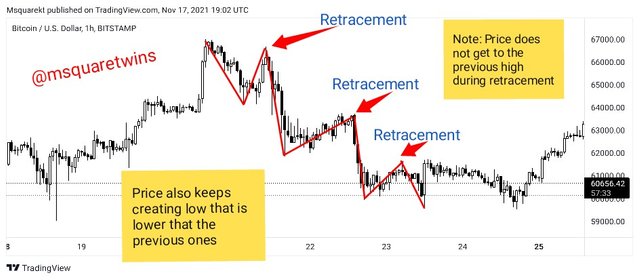
For a Bearish Trend on the other hand, After an impulse move to downside, the price retraces back and the retracement is less than 100% of the impulse move. This means that the retracement create a high that is lower than the previous high. After which, the trend continue in a downward movement. For bearish trend continuation in this case to be valid, the following point mus be met;
• The high point of retracement must be lower than the previous high
• The new low must be lower than the previous low.
 source
Spotting Trend Continuation Using Trendline
Just as we have said earlier, trendline can be used to identify the trend of a market. Not only this it can be used to determine whether the current trend will continue or not. It is such a powerful tool that every trader must learn to use.
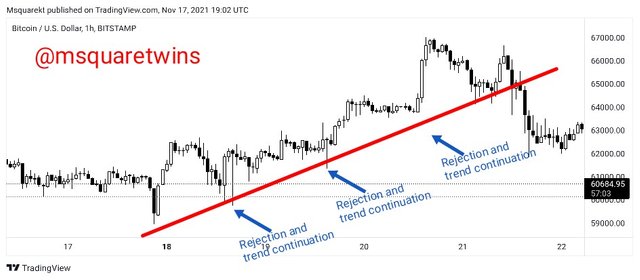
For a Bullish trend, we can see that the market keep trading above the trendline and that the price keeps bounces back every time it touches the trendline to keep moving in it direction. A break of this trendline to the downside would me that the trend has reverse and in that case, the trend no longer continues.
 source
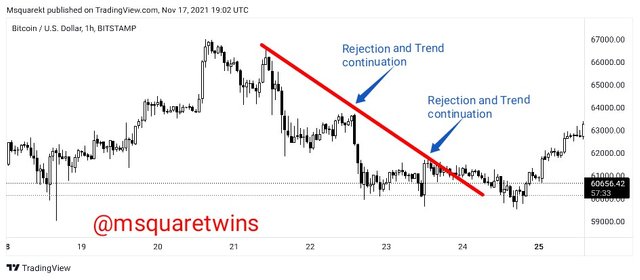
In the same way, we can spot trend continuation for bearish trend as well. We know that for bearish trend, the price must be trading below the trend line. And as we see in the picture below, the trendline act as dynamic resistance such that as price keeps touching the trendline, it reverses and continue in its downward trend. A violation of this would mean that the trend direction is no more valid.
 source
Queation 4
Pick up any crypto-asset chart and answer the following questions -(i) Is the market trending? (ii) What is the current market trend? (Use the chart to back up your answers).
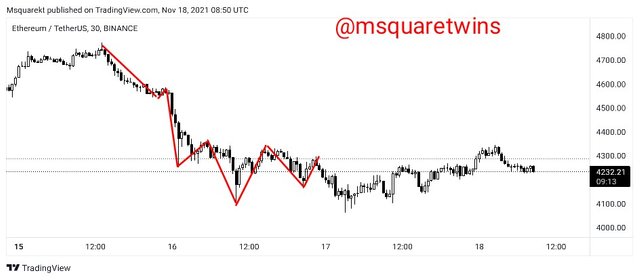
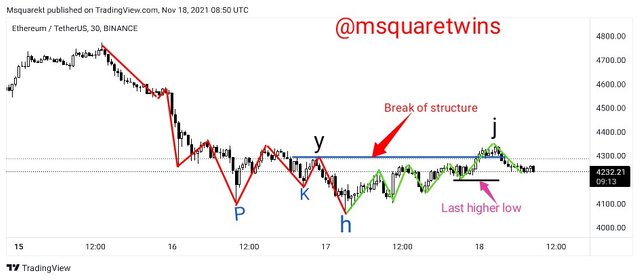
(i) For this question I will be using ETHUSDT to perform the operation given. To answer the question "Is the Market Trending?", I will give my capital YES that the market is trending currently. Why? As seen in the picture below, ETHUSDT on 30min Time frame was having a very clear trend as marked by market structure, we can see that the price of an asset is having series of highs and lows.
 source
(ii) Current Market trend of ETHUSDT
 source
As seen from the image uploaded above, we can see that ETHUSDT keep forming lower highs and lower lows as the asset is seen to be on a downtrend as marked by market structure indicated by a red line in the screenshot. But at a point, the low indicated by point p in the screenshot created a high and which later gives a low k. The low k could not break the previous low, p. Although another low was created after this which slightly broke the low p by a fake move.
After this, the very last low, h, created a high and since then, the price has not broken h and the price kept creating higher highs and higher lows till the significant previous high y was broken to the upside. The high that broke y is indicated in the screenshot as j. After this, the price created the higher low which has not broken the previous low of "j". This therefore mean that the immediate structure of ETHUSD is bullish for now. For the market to be bearish again, the last significant low h must be broken to the downside.
Therefore, the immediate current trend is bullish, although the overall bias is bearish.
Conclusion
The first and the basic knowledge in trading crypto is to understand the trend. This is because without good understanding of trend, a trader can not have successful analysis of chart. And the popular saying in market is " Trend is your friend" and that you must not trade against trend. A trader with good knowledge of trend has a great chance of winning in market.
In this post, I have explained the concept of trend for both bullish and bearish trend. Not only that I have also explained how a trader can identify and detect trend by using market structure and trendline tool.
Lastly, I discussed trend continuation and how to use both market structure and trendline to spot them. Also, I analysed the current trend of ETHUSDT on 30 minutes time frame. Special thanks to Professor @reminiscence01 for this great lecture. Thank you Prof!
Thank you for reading.
Written by: @msquaretwins
Cc:- @reminiscence01
Hello @msquaretwins , I’m glad you participated in the 1st week Season 5 of the Beginner’s class at the Steemit Crypto Academy. Your grades in this task are as follows:
Observations:
You were instructed not to use BTC/USD chart for your assignment. Please always pay attention to homework guidelines.
Recommendation / Feedback:
You have submitted a good content. Thank you for participating in this homework task.