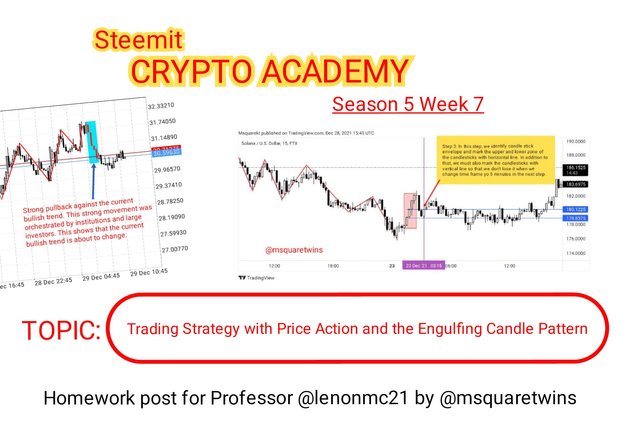
Trading Strategy with Price Action and the Engulfing Candle Pattern - Crypto Academy/S5W7 - Homework post for @lenonmc21

Introduction
Hello Crypto Lovers,
It is another great week in the steemit crypto academy. This week marks the 7th week in season 5. I hope you have been enjoying different lectures from our crypto Professors. I am Kehinde Micheal and my username is @msquaretwins here on this great platform. I have gone through the lecture presented by Professor @lenonmc21 on the topic "Trading Strategy with Price Action and the Engulfing Candle Pattern" in the beginners class. Therefore in this post, I will be answering the questions posted in the homework section. Happy reading!
1. Say in your own words that you understand about the Trading Strategy with “Price Action and the Engulfing Candle Pattern, also describe each step to be able to execute it (Place at least 2 examples in clear cryptographic assets and with your own charts mandatory)
As it name implies, Trading Strategy with price action and the Engulfing candle pattern is a strategy used to place either a buy or sell order in market by using price action with the help of engulfing candle pattern. The strategy is solely based on price action because the execution of the strategy requires that price makes a clear movement. That is, price must have a very clear direction and a clean harmonic trend to be able to use the strategy with great result.
Trading Strategy with price action and the Engulfing candle pattern simply means observing a clean direction of trend to a particular direction and then wait for a very counter movement to the current dominant trend. Then if this happens, we can be rest assured that the trend is about to change and then wait for perfect opportunity to take an entry in market. Then in the new direction that the price is making, we wait for price to gather liquidity toward the new direction and this is where Engulfing candle pattern is employed. The engulfing candle pattern in this case is used as entry zone, that is, the zone where we will look for entry.
It should be noted that the execution of this strategy requires more than one time frame. However, lower time frame like 30 minutes, 15 minutes and 50 minutes are used for great result. In the next paragraph, I will clearly illustrate steps to be taken for the execution of trading strategy with price action and the Engulfing candle pattern.
Step by Step for the execution of trading strategy with price action and the Engulfing candle pattern.
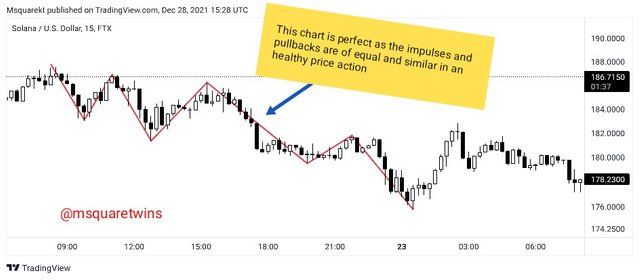
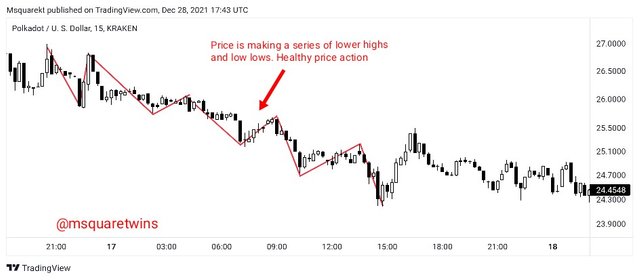
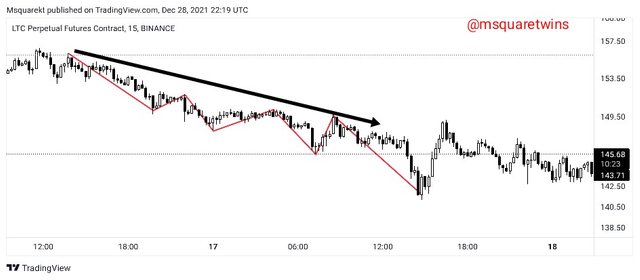
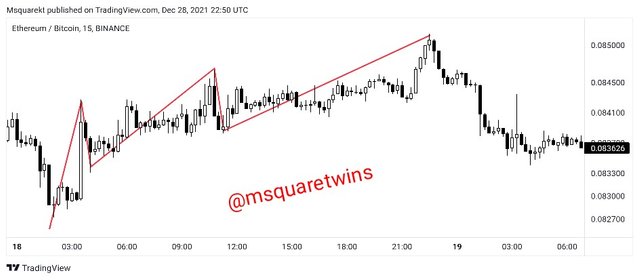
Step 1 — Look for Chart with Clear and Harmonic Trend: The first step in the execution of trading strategy with price action and the Engulfing candle pattern is to identify clear trend in market, since price must make clear trend in market to be able to execute this strategy. There must be correct harmony of price both in an impulsive move and retracement. If this is not so, we must not make reference to it. This means any trend that is not in line with what is mentioned above should not be considered since the purpose of the strategy is clean price action.
In this case, 15minutes timeframe is recommended so as to find a very clean trend with clear and harmonic price action. This is the first step that must be established and this must be satisfied to have a successful ride in this strategy.
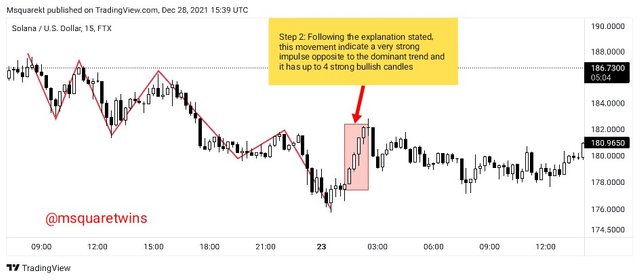
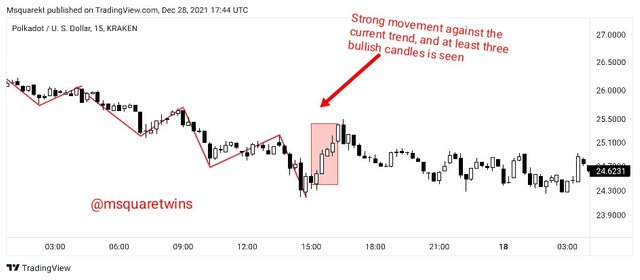
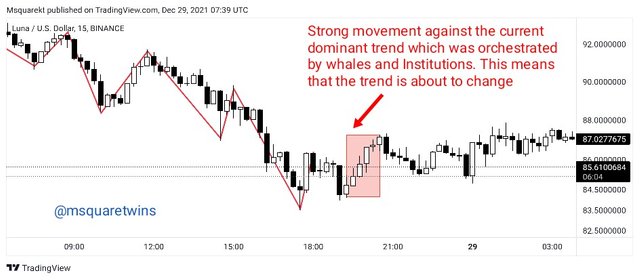
Step 2 — A strong Movement Opposite to the Current Direction : After the identification of a clean and clear harmonic trend as identified above, the next step is to identify a strong movement opposite to current trend that we have already established in the first step above. The presence of a strong movement toward the opposite side of the dominant trend would mean that large investors and institution have already entered the market and that they are ready to drag price to the opposite direction. Therefore, we also must think along with them and position ourselves for trade opportunity by identifying this.
In the strong movement of price that is opposite to the dominant trend, we must candles of great strength with great body and at least there must be 3 to 4 candles in the new direction that trend is about to go.
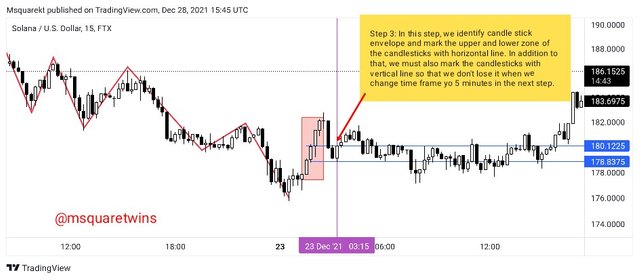
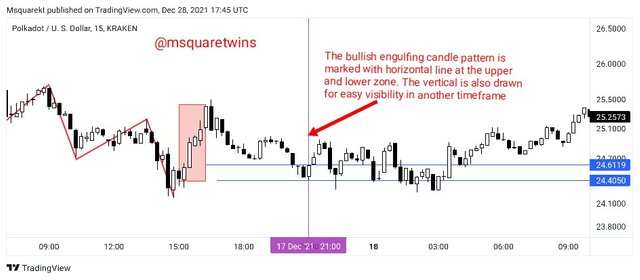
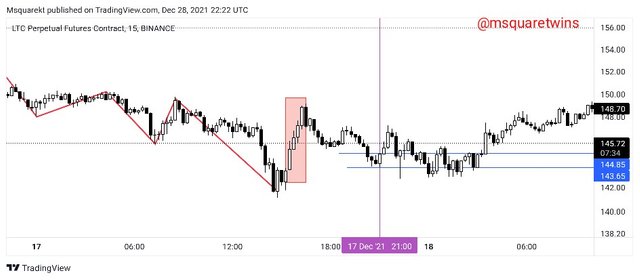
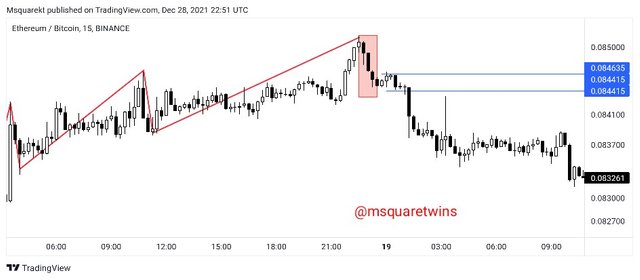
Step 3 — Identify a break in the price and the Engulfing Candle Pattern: The next step is the recognition of break after the identification of strong movement explained in step 2 above. The break in price is nothing but a retracement of price of a strong impulse leg that is explained in step 2. This retracement will be in the direction of the previous dominant trend. In this case, the retracement is bullish as seen in the screenshot below.
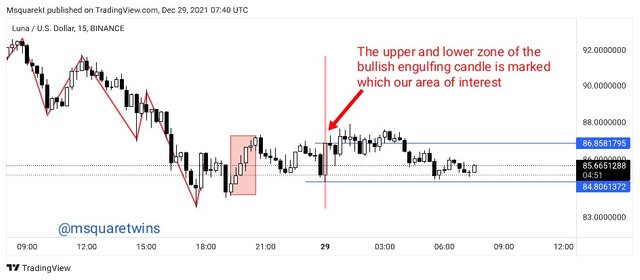
The engulfing candlestick we will use in this case is bullish engulfing candlestick. Practically, as the previous trend is bearish and our opposed strong movement is bullish, we then wait for for price to candlestick pattern to form after the bearish retracement of the strong impulsive move. This candlestick must cover the previous bearish candle as seen in the screenshot below. The engulging nullish candle is indicates in the screenshot by a vertical red line.
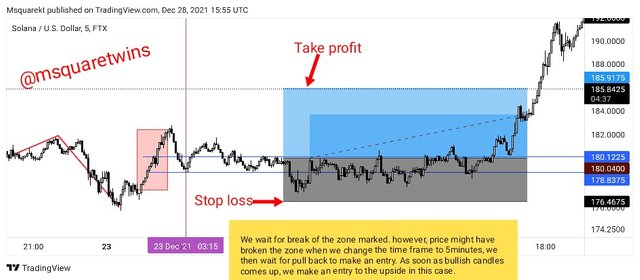
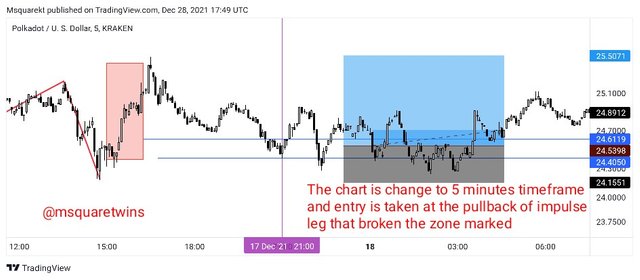
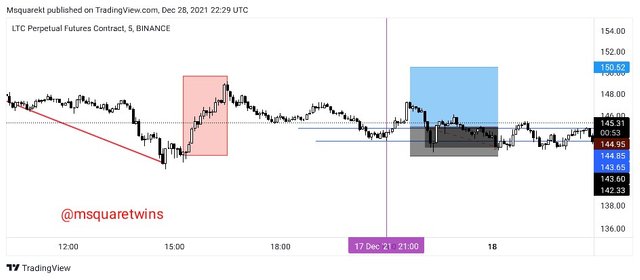
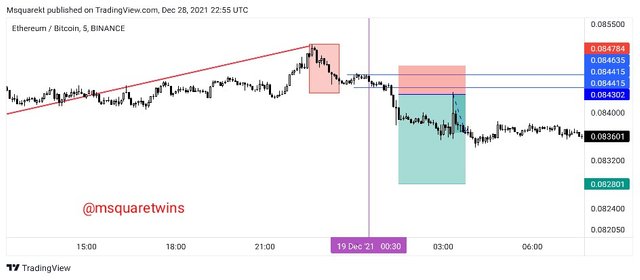
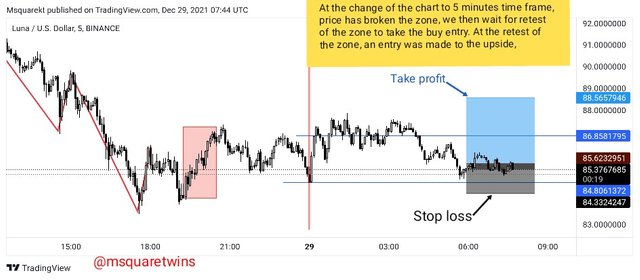
Step 4 — Change the Chart to 5 minutes Timeframe : The next step is to change the chart from 15 minute to 5 minutes to look for entry. After changing to 5 minutes, we then look for a break of the area we marked by the two horizontal line by the engulfing candle on the 15-minutes timeframe. However, if at the change of the chart to 5 minutes, the zone has already been broken, we must wait for price to do pullback to that place and then when bullish candle has shown we make an entry to the upside with the stop loss below the last retracement and the the take profit near the last resistance level.
To finish this Question 1, I will live a clear another clear example
Step 1
Step 2
Step 3
Step 4
2. Explain in your own words the interpretation that should be given to a large strong movement in the market. What does the price tell us when it happens?
When price is making a series of higher high and higher lows with clear and clean direction of price harmony which means that the trend is bullish, and it get to a certain point that price fails to create a high that is higher than the previous high but instead, makes a strong move in the opposite direction, it indicates that there will be a change of current trend in market.
In short, a large strong movement in market means the presence of whales and institution in market. This means that institution and large investors are putting a lot of money in market at a particular time. If the the current dominant trend is bullish and the large strong movement is to the opposite side of the dominant trend, it may indicate reversal of the dominant trend. But if the current trend is bearish, the large strong movement opposite to this trend may signify reversal to the upside.
The strong large movement is also called the foot prints of whale, large investors and institution in market because they are the ones behind strong large movement in market. These individuals always pump a lot of money into the market so as to haunt the retail traders. When a large strong movement happens, it signifies a change in the direction of a current trend and price tells us that the current trend is about to change.
3. Explain the trade entry and exit criteria for the buy and sell positions of the trading strategy with Price Action and Engulfing Candlestick Pattern in any cryptocurrency of your choice (Share your own screenshots taking into account a good ratio of risk and benefit)?
The exit and entry criteria for the buy and sell positions of trading strategy with Price Action and Engulfing Candlestick Pattern is not difficult. We just have to follow the rules that I will mention in the next paragraph to have a successful trade.
We must make sure, as I have stated earlier that price is in a very clear trend and that the impulse and the pullback are very clean with clear price harmony. That is the price is in either clear upward or downward trend. If this is not satisfied, then we must loom for a clear trend.
The next step after identification of a clear trend is strong movement. It must be noted that, there must be 3 to 4 strong force candle with good body in the opposite direction of the dominant trend. Then we can look for the engulfing candle at the pullback of this strong movement. The pullback will be in the direction of the previous dominant trend. If this is not met, we have to look for another opportunity in market. Strong candle are very important to this strategy since they shows that the footprint of whale which in turns means that the trend is about to change.
Another important thing to note is the engulfing candle which create the envelope candle. We must identify this candle in 15 minute and the mark the upper and the lower zone of this envelope with horizontal line. That will be our area of interest. Then we change the chart to 5 minute time frame. If at the change of time frame the zone has not be broken, we then wait for clear break with strong force to make our entry. If at the change of time frame, the zone has been broken, we wait for price to retrace back to the zone before will take entry.
After the zone (The engulfing candle marked with horizontal line in 15 minute timeframe) has been broken, the we make entry, our stop loss must be below the bullish candle and the take profit must be at the nearest resistance in case of strong move against the previous bearish trend. But in case of strong movement against the previous bullish trend, the stop loss must be above the bearish candle and the take profit must be at the last support. If we don't see clear support and resistance in 5 minutes, we can switch to 15 minutes or higher time frame to check support or resistance. The profit target must be at least 1:2 risk to reward ratio.
Buy Entry and Exit Criteria
Sell Entry and Exit srrategy
PRACTICE
1. Make 2 entries (One bullish and one bearish), using the “Price Action and Engulfing Candlestick Pattern” trading strategy. These entries must be made in a demo account, keep in mind that it is not enough to just place the images of the execution, you must place additional images to observe the development of these operations to be able to be correctly evaluated and see if they really understood the strategy.
Buy Entry
The chart uploaded below is the chart of LUNAUSD on a 15 minutes timeframe. As seen in the screenshot below, the price was making a series of lower highs and lower lows with equal and similar impulses and pullback. This confirms that we have a perfect chart for the strategy.
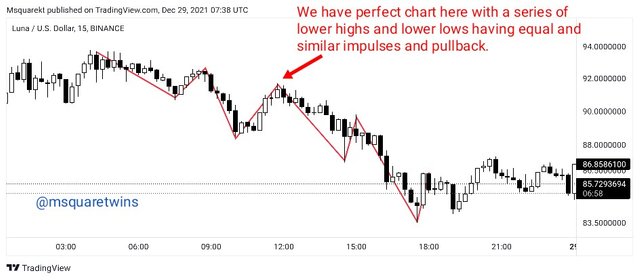
Then, we can see a strong move against the current dominant trend as market by a faint red box in the screenshot. This movement was orchestrated by large investors and institution and this tells us that the current bearish trend is about to change.
Then, I waited for price to gather liquidity. At the pullback of the strong large movement, the bullish engulfing candle formed and I marked the upper and lower part of the candle to form our area of interest.
Then, I change the chart to 5 minutes time frame fromb15 minutes time frame to make an entry. At the change of the time frame, I saw that the zone has already broken upward. I then wait for a pullback to this zone to take a buy entry. At the pull back of price to that zone, I made a buy entry at $85.623 with stop loss just below the bullish engulfing candle at $84.33. The take profit order was placed at $88.567 which is near the last resistance.
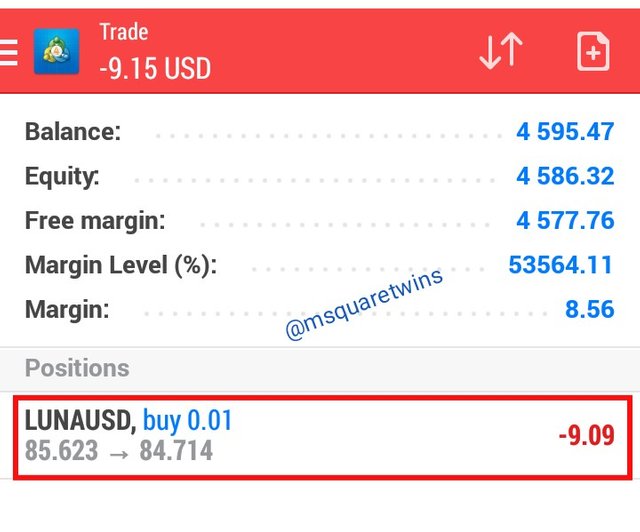
Then I open my MT4 APP to take the buy order. The screenshot of the order made on MT4 is uploaded below.
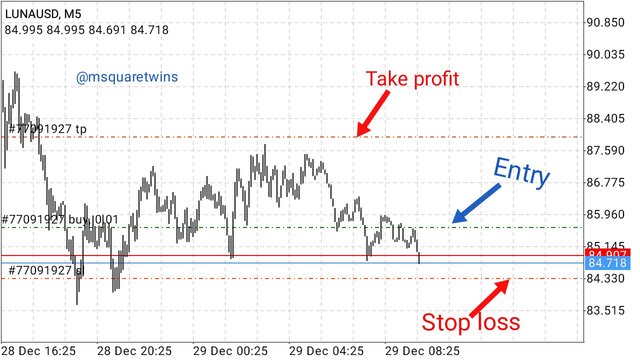
Below is the screenshot of the running order of LUNAUSD which was taken almost immediately after the buy entry.
Then after some time, I check theorder and I saw that it is moving in our direction as seen in the screenshot below. This order is still running.

Sell Entry
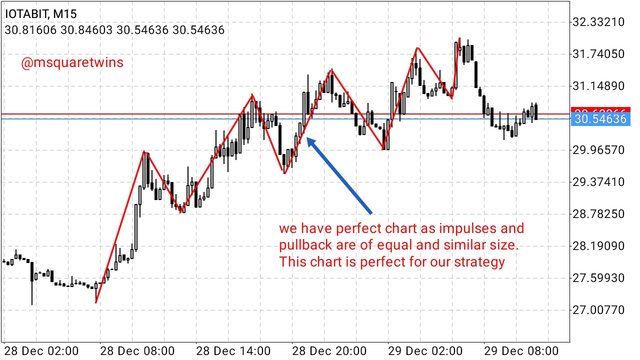
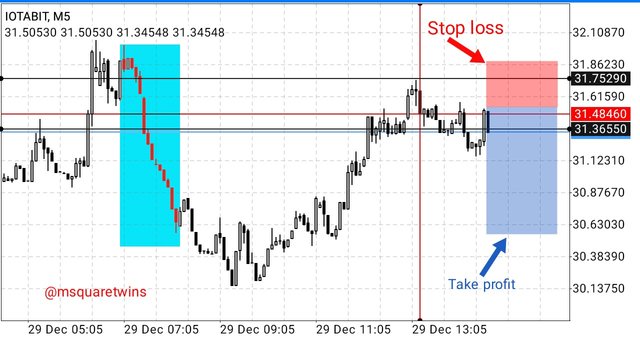
The chart uploaded below is a chart of IOTABIT on a 15 minutes time frame. As seen in the screenshot below, we have perfect chart for this strategy as impulses and pullback are of equal and similar size with clean price harmony. The price was making a series of higher highs and higher lows, This shows that the current trend is bullish.
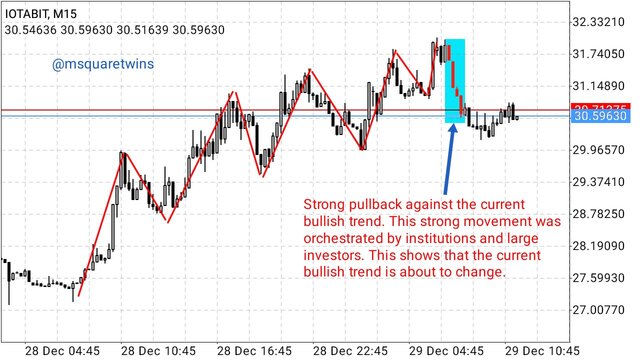
Then, there was a strong large movement against the current bullish trend. This movement was orchestrated by large investors and institution and this shows that the current bullish trend is about to change.
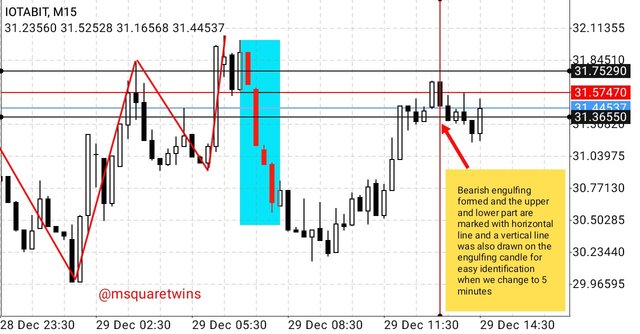
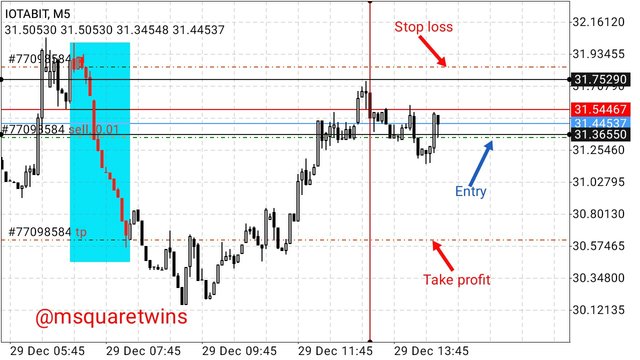
Then at the pullback of the strong large movement , a bearish engulfing candle form giving rising to our envelope candle. The upper and low part of the engulfing pattern were marked with horizontal lines seen in the screenshot below. In addition to that, the engulf candle pattern is also marked with vertical line for easy identification when changing the timeframe.
At the change of the chart to 5 minutes, price has already broken the zone marked downward. I waited for pullback back to the zone and then took an entry to the downside. The stop loss was placed slightly above the engulfing candle and take profit was set at last support.
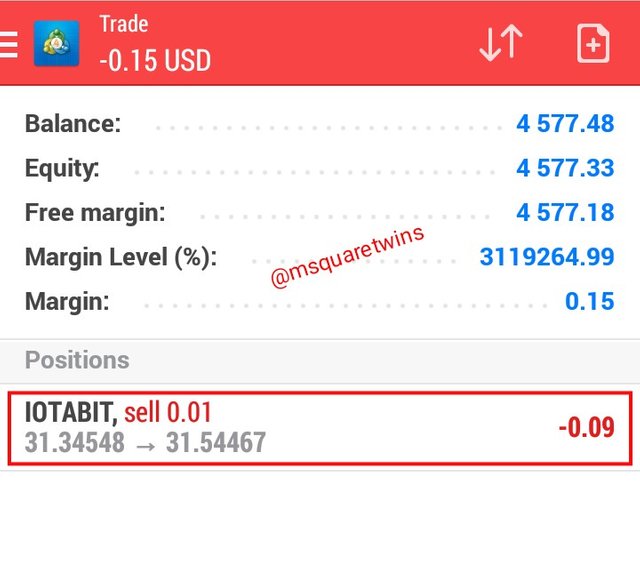
Then screenshot below shows the sell order taken on the MT4 platform.
The screenshot below shows the running order of IOTABIT which was taken immediately after the order was executed.
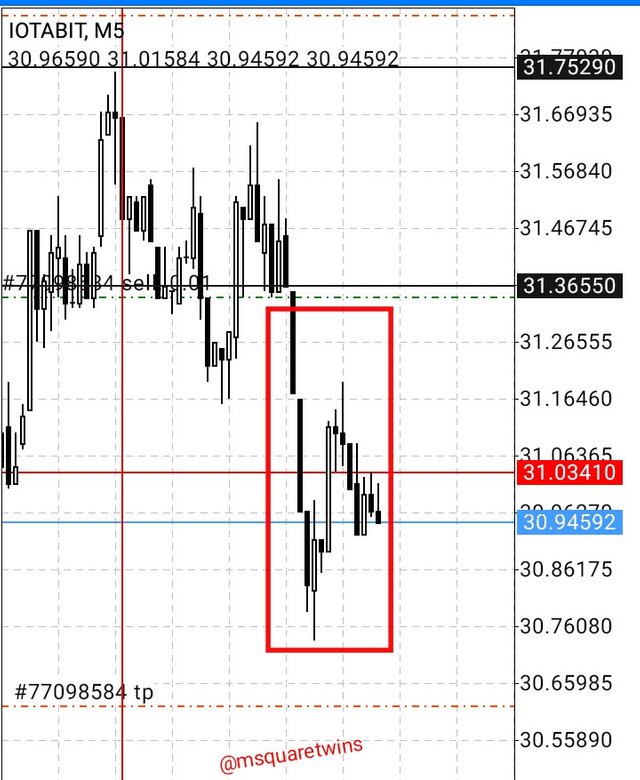
Then after sometimes, I checked the sell order and saw that it has almost hit my take profit before a little retracement. The order is still running as seen in the screenshot below.
Conclusion
Trading Strategy with Price Action and the Engulfing Candle Pattern requires a lot of patience from traders. This is because, it takes time for price to develop and meet necessary conditions for the strategy to be valid. To effectively use this strategy for great result, traders must analyse a chart with a very clear trend and must identify a very strong movement against the current trend in market. Thereafter, traders must make sure that bearish or bullish engulfing candle pattern form after a pull back of the strong move to mark area of interest.
In this post, I have explained my Trading Strategy with Price Action and the engulfing Candle Pattern based on my understanding. I also explain step by step to be taken for correct execution of the strategy with clear examples from charts. More so, I also discussed entry and exit criteria that are employed for the strategy. Finally I took two demo trades one for buy entry and the order for sell entry.
Special thanks to Professor @lenonmc21 for this great lecture. Happy new year in advance Prof.
Thank you for reading
Cc:- @lenonmc21