Strategy and use of Donchian Channels - Crypto Academy / S5W1 - Homework post for @ lenonmc21

Introduction
Hello Crypto Lovers,
It is a great privilege to be alive and to be attending lectures in steemit crypto academy after a short but glorious break. I am Kehinde Micheal and my username is @msquaretwins here on this great platform. I welcome you all to the week 1 of season 5. My prayer is that, this season will be far glorious than the previous ones for you. Again, I have gone through the lecture presented by professor @lenonmc21 on " Strategy and use of Donchian Channels" in the beginners class. Therefore, in this post, I will be answering the questions posted in the homework section. Happy reading!
THEORY
1. Explain and define in your own words what the Donchian Channels are?
Donchian channels are one of the the powerful indicators that are used by financial analysts or traders to analyse the crypto assets. This indicator is similar to Bollinger bands indicator in that it is made up three lines which help traders to determine how volatile an asset is at a particular period of time. Not only that, it also has a power to detect trend reversal or a break of trend. Moreso, this indicator can also be used measure how overbought or oversold an asset is or simply put, to know the overbought or oversold region of an asset.
Donchian Channels was developed and created in 1950 by a man called “Richard Donchian”. He's often regarded as the father of trend monitoring because of his work which focused mainly on trend determination. The creation of this indicator was birthed by him because it was recorded that he needed a good but complicated strategy to measure the volatility of an asset in market and hence, he developed the so called indicator.
 source
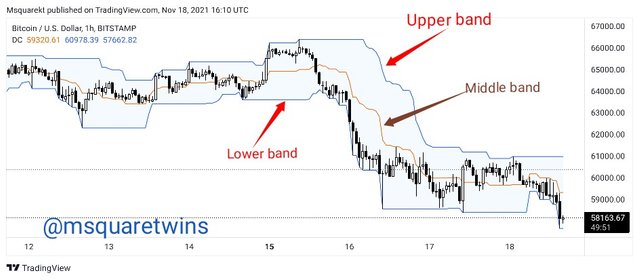
As we can see from the above image, the Donchian channels indicators, just like Bollinger band has 3 separate lines. The lower band, the middle band and the upper band. This lines are gotten from the moving average calculations. The middle band is the average of the lower and the upper bands. The upper and the lower band show the highest and the lowest point the price of an asset attain at a particular period of time.
2. Explain in detail how Donchian Channels are calculated (without copying and pasting from the internet)?
The calculation of Donchian channels is very simple. To do this, we need to calculate the value for upper channel, lower channel and middle channel over a period of time. The time we use here depend on the choice of the traders. We then use the calculation gotten to plot the chart of the Donchain channels.
Let's present this mathematically for more clearity.
High channel - We check for the highest point the price make over the period under consideration.
Lower channel :- We record the lowest price of an asset under the same time period.
Middle channel: The middle channel is the average of High and lower channels. There fore, it will be result of high channel plus lower channel divided by 2.
For instance, take a look at the picture below.
 source
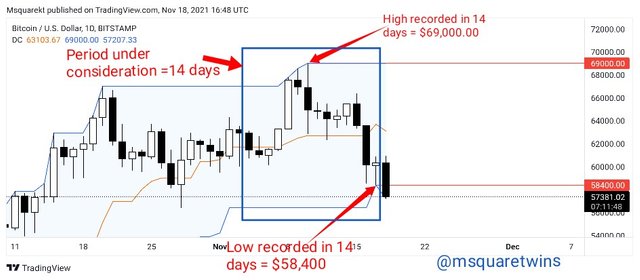
The picture above shows the chart of BTCUSD on a daily time frame. 14 days period is considered as indicated by a blue box in the picture. During this period the following parameters are recorded for Donchain channels;
Lower channel recorded $58,400
Upper channel recorded $69,000
Therefore, the Middle channel = (upper channel + Lower channel)/2
= ($69,000 + 58,400)/2
= $63,700
Therefore the lower channel, middle channel and upper channel recorded in 14 days period are $58,400, $63,700 and $69,000 respectively.
These three values are used to plot Donchain channels.
3. Explain the different types of uses and interpretations of Donchian Channels (With examples of bullish and bearish trades)?
As I have mentioned earlier, Donchian channels can be used to know how volatile the market is, the overbought and oversold region and of course the reversal or breakout. Let's take it one after the other.
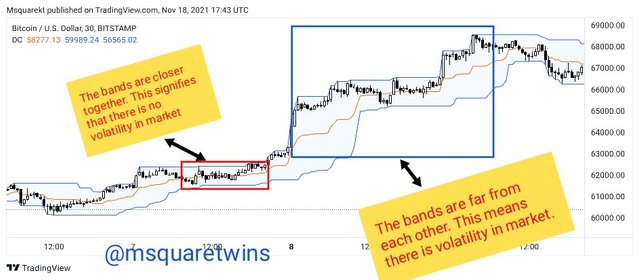
Donchian Channels — Volatility Use:- This is the main aspect of the use of donchian channels. When market is very volatile, the upper band and the lower bands tend to become very wide. The reverse is the case during non volatile market. I.e, the bands become very close yo each other when market is not volatile and at this point, the market may be ranging without any clear trend at that period.
The picture showing the volatility period and non volatility period for both bullish and bearish trends are uploaded below.
 source
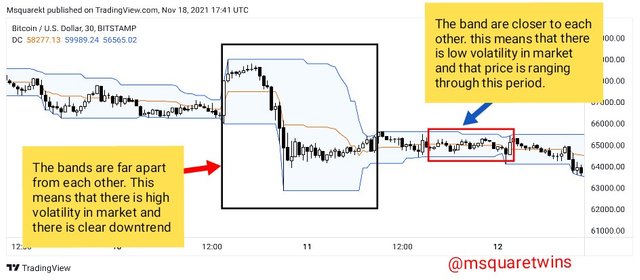 source
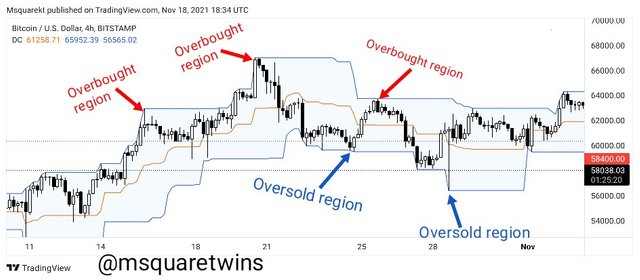
Donchian Channels — Overbought and Oveversold Use: Another important use of Donchian channels is overbought and oversold region that can be detected by using the upper and lower band respectively. When the prices touches the upper band, it is often regarded as the overbought region and price is likely to reverse around this place. This helps trader to position themselves for a sell order at the upper band level. Conversely, when the price touches the lower band, it is sand to be oversold and price is likely to reverse around this region. At this point, traders often envisage a buy order.
 sources
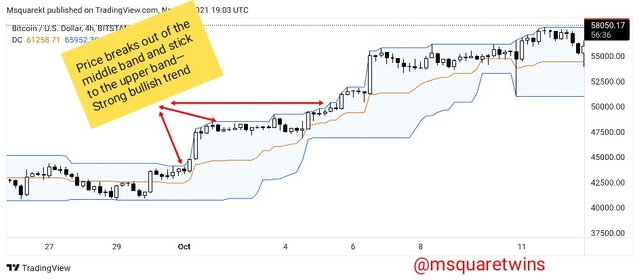
Donchian Channels — Strong Trend and Breakout Use: Another unique way donchian channels can be used is to identify strong trend and a breakout. As I have mentioned earlier, in case of overbought or oversold level, price may touch the upper or lower bands and then reverses back. But this is not only the case, at times, price may reach this level and stick to the band for a long period of time. When price gets to a upper band and stick to it for long time, this indicate a strong bullish trend. A strong bearish trend would be that the price stick to the lower band for long time.
Also, there may be break out of these bands and this may indicate a buy or sell order as the case may be. Below is the screenshot showing the strong bullish and bearish trend and a breakout of the band.
 source
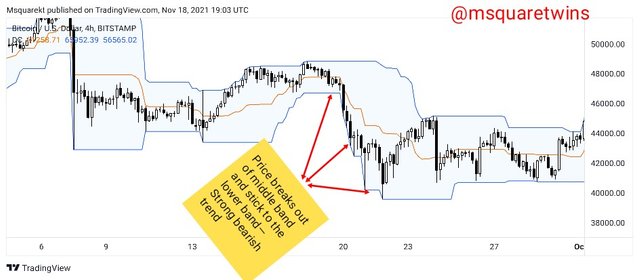 source
PRACTICE
1. Make 1 entry using the "Donchian Channel Breakout Strategy" and make 1 entry using the "Reversal and Retracement Strategy". You must explain the step by step of how you analyzed to take your entry and make them into a demo account so I can evaluate how the operation was taken.
Trade Entry Using Donchian Channel Breakout Strategy.
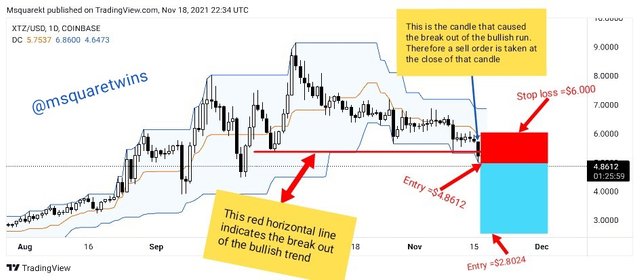
The first entry I am going to make is for breakout strategy. The graph below shows a chart of XTZ/USD on a daily time frame. The Donchian channel is added to the chart having a upper, lower and a middle band.
From the chart, we can see that the asset XTZ/USD has been bullish from around August this year till around mid of October, last month, where he made the highest high between this period. Then after this period, XTZ/USD could not make a high higher than the one recorded around the middle of October and it experienced a downward movement and the asset keep falling till the price broke the previous low as indicated by a red horizontal line in the screenshot below.
The candle that caused a break of the bullish trend is indicated by a blue arrow in the screenshot. The order is placed at the closed of this candle giving the entry price of $4.8612 and the stop loss was slightly placed at the top of this candle at a price of $6.000, and a take profit of $2.802 which gives 1:2 risk to reward ratio.
 source
The picture below shows the sell order of XTZ/USD on MT4 App. The stop loss and the take profit is displayed on the screenshot.
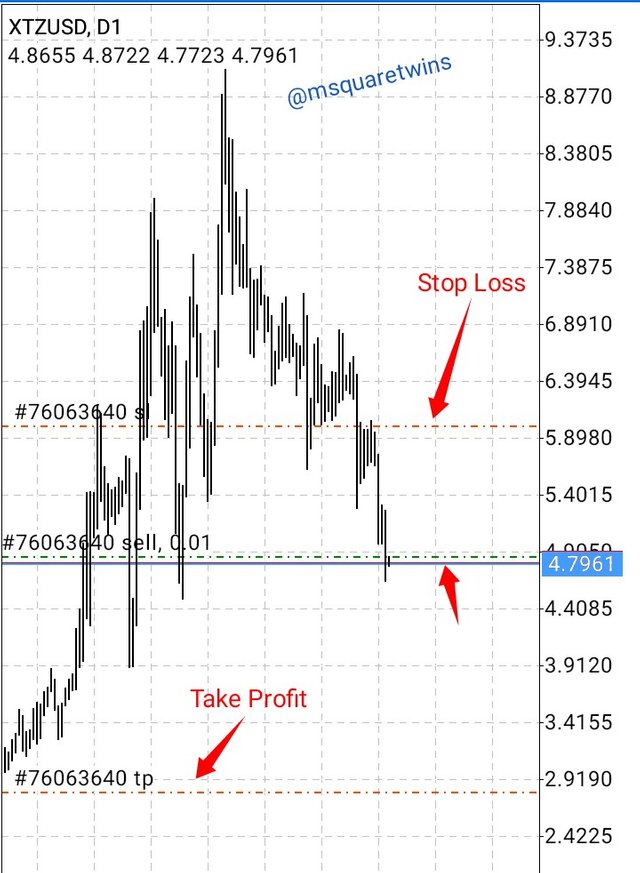
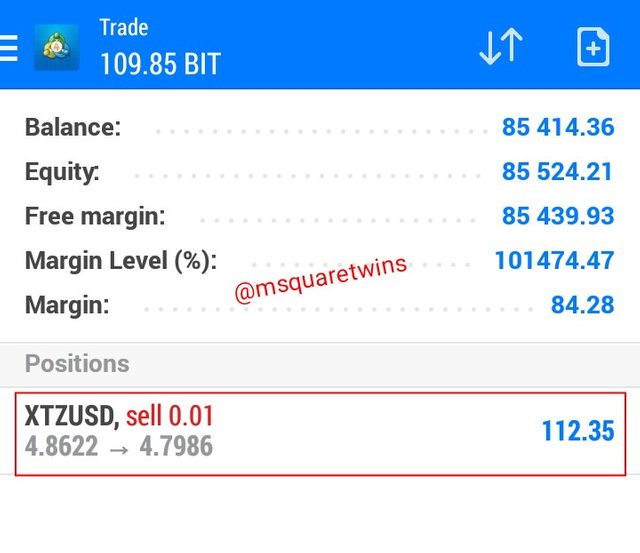
• Also, the screenshot below shows the running order of XTZ/USD on MT4 Platorm.
Trade Entry Using Donchian Channel Reversal and Retracement Strategy
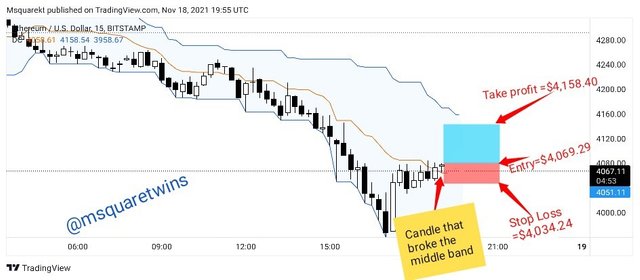
For this part, I will be using reversal and retracement strategy to make a trade entry. The image below is a chart of ETH/USD on a 15 minutes time frame.
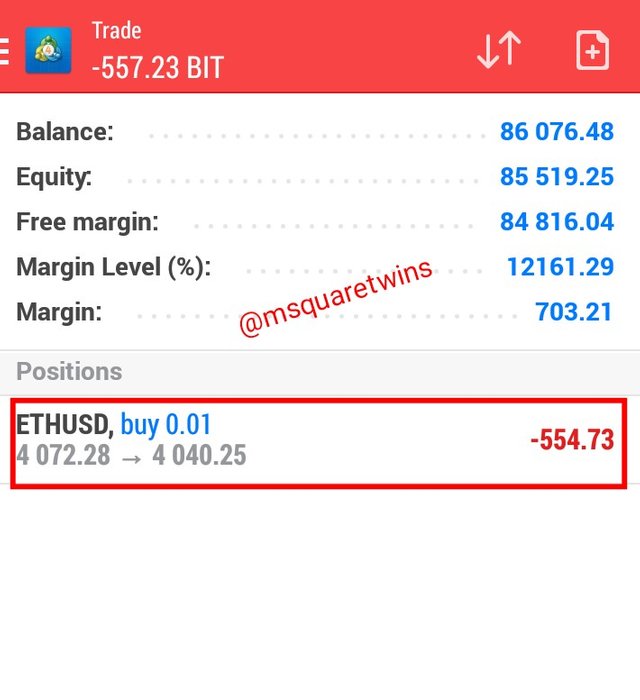
From the chart, we can see that the asset is currently on a downtrend base on this time frame. But at a point, the price of this asset retraced and broke the middle band as seen in the picture below. The candle that broke the band is indicated in the picture below. An entry was made at the close of this candle giving us an entry price of $4,069.29 and a stop loss order was placed below that candle at a price of $4,034.24 and the take profit is $4,158.40
 source
The picture below shows the running order of ETH/USD on MT4 platform.
Conclusion
It is indubitable that indicators are a great technical tools that help trades to make good analysis and to take good market decision in finance trading. However, it should be noted that no indicator, not even Donchian channel is 100% efficient in market. Therefore, it is advisable that traders or financial analysts add one or two indicator to their favourite one for more confirmation and confluence. No indicator should be used in isolation.
In this lecture, I have been able to explain Donchian channels and how it is employed in financial market. I also give clear explanation of how it is calculated. And lastly, I made two trade entry using breakout strategy and reversal and retracement strategy of Donchian channels.
Special thanks to Professor @lenonmc21 for this wonderful lecture. I hope to participate in your next class.
Thank you for reading
Written by : @msquaretwins
Cc:- @lenonmc21