[REPOST] Perfect Entry Strategy using Stochastic Oscillator + 200 Simple Moving Average - Crypto Academy/S5W3 - Homework post for @lenonmc21


Introduction

Hello Crypto Lovers,
It is another wonderful time again in the Steemit crypto Academy. This is the 3rd week corresponding to the season 5 in the academy. I am Kehinde Micheal and my username is @msquaretwins here on this great platform. I have gone through the lecture presented by Professor @lenonmc21 on Perfect Entry Strategy using Stochastic Oscillator + 200 Simple Moving Average in the beginners class. Therefore, in this post, I will be answering the questions posted in the homework section. Happy reading!

THEORY
1. State in your own words what you understand about the Perfect Entry Strategy (Place at least 2 examples on crypto assets)?

In trading, it is not enough to know the direction of price at a particular period of time. The knowledge of where and how to enter a trade is very important because the fact that you know the direction of a trend does not mean you will have a successful trade of your entry is not perfect and accurate.
The concepts of perfect entry according to how Prof explained it in class is very simple, it is just the understanding of the exact point where market has high probability to reverse or to turn regardless of the current trend of the market. This strategy of perfect entry is achieved with help of an indicator called stochastic indicator. With the help of thus indicator combined with the price action on chart and with the moving average, perfect opportunity for trade order can be gotten with high success.
The perfect entry strategy takes into account three unique components The first thing is the price action as evident by market structure and price harmony at a particular period of time. The second component that is taken to consideration is the 200 moving average indicator which helps in filtering the market trend simultaneously with the market structure and lastly, the great stochastic indicator is also part of the components. This indicator helps us to confirm how oversold or overbought and asset is, which if oversold, there is high tendency that the price may turn bullish and if overbought, bearish movement may be around the corner.
Now for more clarity, let's see detailed steps to follow for carrying out Perfect entry strategy.
Steps for Carrying out Perfect Entry Strategy
As mentioned above, there are three important components used for the perfect entry criteria. These criteria is explain in steps below.
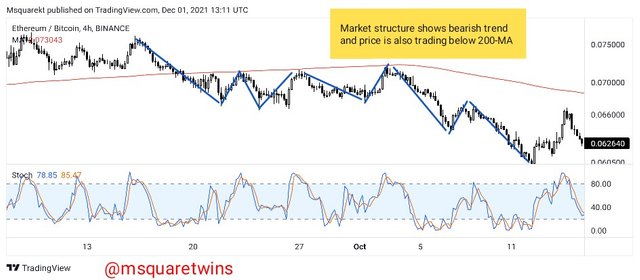
1. Determination of Market Trend: In perfect entry strategy, and in fact, in any trading strategy, the first thing to do is to determine the market bias or the current dominant trend. So in this strategy, this is where 200 Moving Average (200-MA) comes into play. We will use 200 moving average to determine the trend, noting that when the price is trading above moving average, the market is in bullish trend and when price is below MA, the trend is bearish. In this strategy, trend determination is not based only on 200 MA, the strategy also employed price action inform of market structure and price harmony to determine market trend. In that case, we can be certain of the current bias as establish by both MA and market structure.
For more clarity, a picture that shows illustration of step 1 is uploaded below.
 source
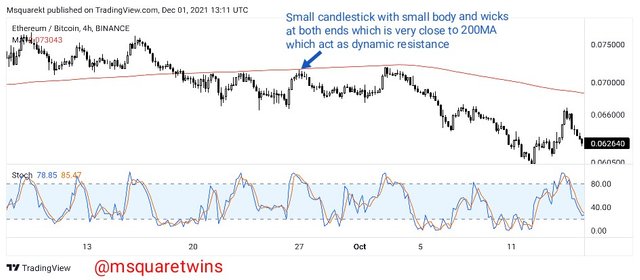
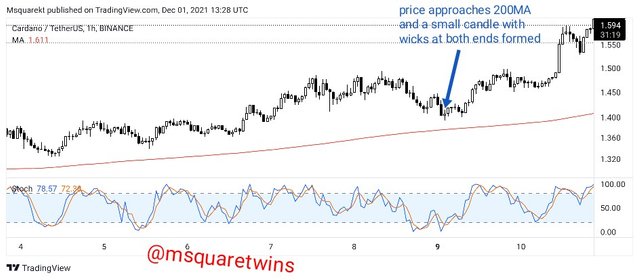
2. Candlestick Confluence with 200 MA: After the determination of market trend and we are certain of where price is going, the next step is to find "reference candle or trigger candle". The trigger candle is the candlestick that tells us the validity of perfect entry strategy. It is a small candlestick with a small body and with wicks or shadow up and down. So, how do find this trigger candle? We find this candle by observing the candlestick that forms every time price approaches the Moving average line.
For example, if after our step one above, we determined that the trend is moving in a bearish direction. Then the price is trading below the 200 Moving average, and price then retrace to create a lower high and the approaches the 200 Moving Average as if it wants to touch it, and then at this point if a candle forms having a small body and wicks both side as explained above, it means we have our "trigger candle" already. The formation of the trigger candle shows the strength of the buyers is weak and that the buyers couldn't push the market upward beyond this point. As we have it for bearish trend, we can also have the same case for bullish trend.
For more, understanding, pictures that explain the step 2 is uploaded below.
 source
 source
3. Stochastic Oscillator Signal: The last step that complete the perfect entry strategy is the stochastic oscillator signal. This is very important because the signal from stochastic oscillator must match the one step 1 and and step 2 give. Otherwise, we leave it and wait for another one. Now for this to be valid, stochastic oscillator must also give the same thing we see in step 1 and 2.
For instance, let's say the trend is bearish and that the price action and the price harmony is also in line with the trend as confirm by market structure, also the price is trading below the moving average. Besides waiting for price to approach the 200 MA to get the trigger candle which signifies that there is no more strength for current small buy, the stochastic oscillator must also give overbought signal, in this case, the stochastic oscillator must be in the range 80 to 100. For the opposite side of this, the stochastic oscillator must be in range 0 to 20 which signifies oversold.
For more clarity, the step 3 has been illustrated in the screenshots below.
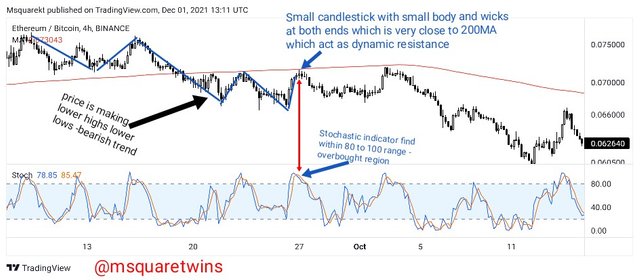 source
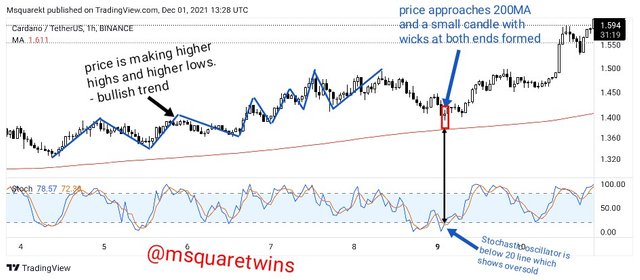 source
2. Explain in your own words what candlestick pattern we should expect to execute a market entry using the Perfect Entry Strategy.

Candlestick pattern also plays important role in executing a trade order for perfect entry strategy. The candlestick pattern that we should expect is a small candle with a small body having wick at both ends. This means that when we have determined our trends and we are waiting for price to approach the 200MA, we should always be at a look out for this small candle. This candle is a trigger candle. If this candle does not show up when price approaches 200 MA, we wait for perfect opportunity.
The small candle with small body and wicks at both ends at the approach of 200 Moving average shows rejection and that price has no intention of going up or down at that point and as such reverse to continue in the direction of the dominant trend.
For instance, in the picture uploaded below, we can see that the price is making a series of lower highs and lower lows as determined by price action, market structure and price harmony. Also, price is trading below 200 Moving Average which also confirms that the trend is bearish. Then, we wait for price to retrace and approach the 200 moving average. We must then wait for candlestick pattern to form.
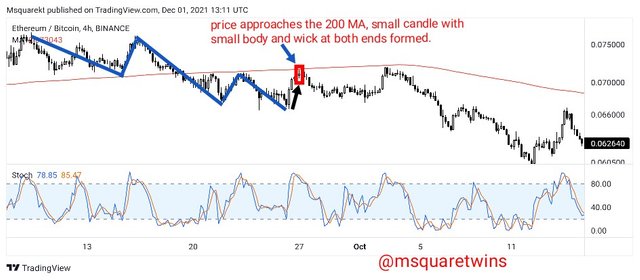 source
For perfect entry strategy to be valid, the candlestick pattern that must be see at the approach of 200 MA must have small body and wick at both ends. This candle will be in form of evening star when a sell order is envisaged. This means that during a bearish trend, a short buy retracement that approach the 200MA will have a gap up to form the first candle of eveing start pattern, then a small candle will form which is our trigger candle , then follow buy the last candle of eveing star pattern that will engulf the small candle. But the morning star pattern can be expected if the trend is bullish.
Another candlestick pattern we can expect is bullish engulfing or bearish engulfing pattern. In this case, the trigger candle which approaches 200MA will be engulfed be next candle which will indicate that, buyers or sellers have taken over for bullish and bearish trend respectively.
And as we can see, the retracement leg indicated by a black arrow in the screenshot approaches the 200 MA and a small candle with some body and wicks at both ends formed as indicated by a red box in the screenshot. This therefore indicates that the short buy that happen against the dominant bearish trend couldn't go beyond that point, and that the force of buyers has been exhausted. And the price reversed back and continued in it bearish move as seen in the screenshot.

3. Explain the trading entry and exit criteria for buy and sell positions in any cryptocurrency of your choice (Share your own screenshots)

Trading Entry and Exit Criteria for Buy Position.
• To have a perfect entry we must first determine that the condition 1, 2 and 3 explained above is met and fulfilled.
• If any of the step 1 to 3 discussed above is not met, we then discard and wait for all conditions to be met.
• For buy position, we must see clear market trending upward and then diligently find the conditions and make sure they are all met.
• The stop loss order must be placed just below the small candle and we must take profit immediately stochastic oscillator enter overbought region, starting from 80 level.
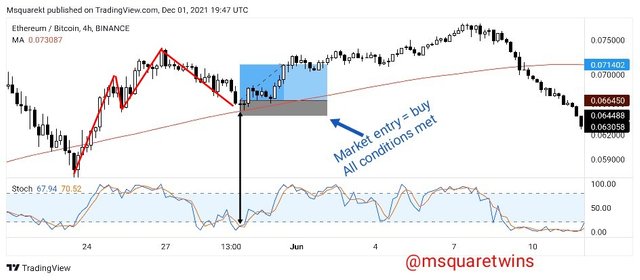 tradingview.com
As we can see, the trend is bullish as price keeps making higher highs and higher low and also, the 200MA confirm the current trend. Then the price approaches 200 MA as indicated by a black arrow in the screenshot. At this point the stochastic oscillator was also below 20 level which shows that the asset is oversold. Spotting this, a buy order was placed after the close of the small candle, and a stop loss order was placed below it and we exit the market when the price approaches 80 stochastic region.
The picture below also gives clear illustration of buy entry and exit order.
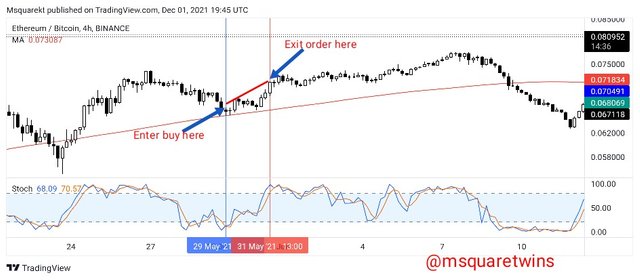 tradingview.com
Trading Entry and Exit Criteria for Sell Position.
• To take a sell position, we must also first check all the conditions. If the conditions are all fulfilled then we can now make entry.
• For sell order, the entry must be at the close of the small candle which is our trigger candle. The stop loss must be placed immediately above the trigger candle and the exit will be when the the stochastic indicator is approaching level 20 which means oversold region.
The picture below illustrates the entry and exit criteria for sell position.
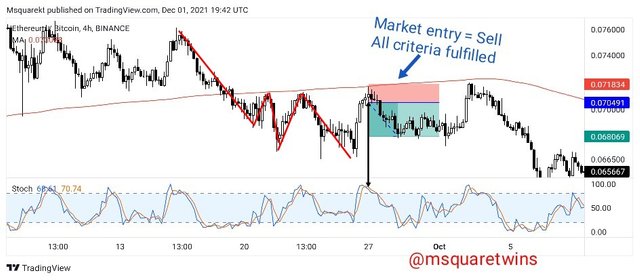 tradingview.com
As we can see, the price keeps creating lower highs and lower low, and the price is also trading below the 200 MA, this therefore means that the trend is bearish. We then wait for price to approach the 200 MA as indicated by a black arrow in the screenshot. Then, at the approach of 200 MA by price, the stochastic oscillator also give signal for sell as it is seen entering the overbought region.
Then, a sell entry was made with entry at the close of the trigger candle and the stop loss was placed slightly above the small candle. Profit was taken when the stochastic line entered the oversold at 20 stochastic level.
The picture uploaded below further explains the entry and exit criteria for sell position
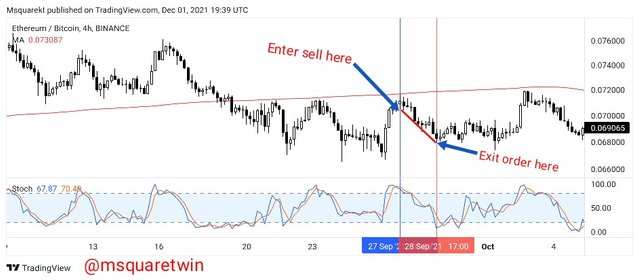 tradingview.com
PRACTICE
1. Trade 2 demo account trades using the “Perfect Entry” strategy for both a “Bullish” and “Bearish” scenario. Please use a shorter period of time to execute your entries. Important you must run your entries in a demo account to be properly evaluated.

Buy Position
For this task, I am going to be using MT4 platform to take the demo trade.
• The screenshot below is a chart of TRX/USD on a 30 Minutes Time Frame(TF).
• As seen in the screenshot, the price keeps making series of higher highs and higher lows as confirm by market structure and price harmony. Also, the price is trading above the 200 MA as seen in the screenshot below. This therefore means that the trend is bullish.
• Then, at a point, price approached the 200 MA and a small candle formed which is our trigger candle.
• At the exact point where the trigger candle formed, the stochastic indicator entered oversold region as the line of stochastic is seen below 20 stochastic level as indicated by a blue arrow in the screenshot
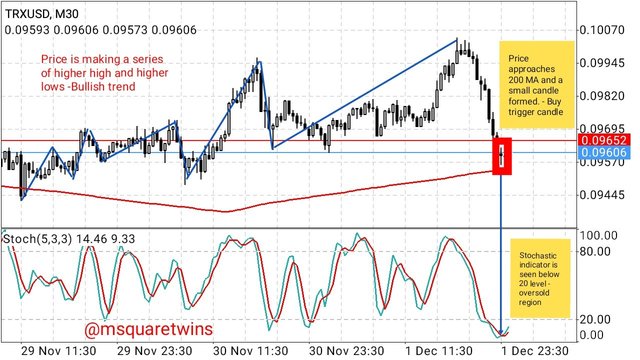
Then, all conditions met. A buy order was placed at the close of the trigger candle and stop loss order was slightly placed below the trigger candle as displayed in the screenshot below. Then I wait for the order to go so as to take profit when the stochastic line enter overbought.
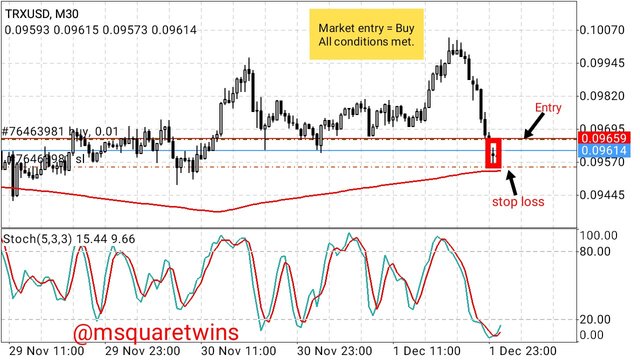
After some time, I checked the trade but the trade went against my direction as seen in the picture below. We should note that loss is inevitable in market, but the good thing is that when one keep to the rule of risk management, it can be kept to minimum.

Sell Position
For sell position, I will use the same platform I used for buy order above.
• The picture uploaded below is a chart of DADH/USD on a 1 minute time frame.
• As seen in the screenshot, the price was making a lower highs and lower low formation as confirm by price harmony and market structure. Also the price was trading below 200 MA. This means that the asset is bearish.
• Price approaches the 200 MA and a trigger candle form as seen in the screenshot.
• At the same time our trigger candle was forming, the stochastic indicator also enter overbought region and this also signal sell order.
• Then all conditions were met and entry was made at the close of a trigger candle and the stop loss was placed above he trigger candle as seen below.
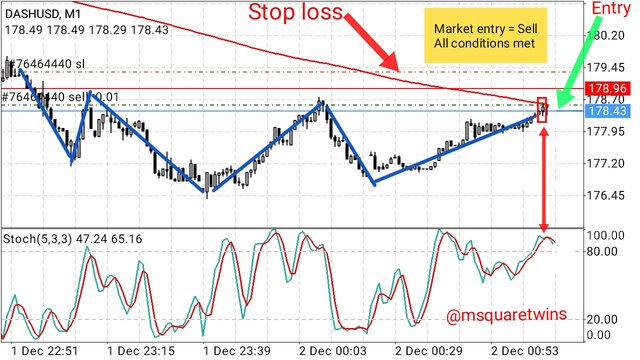
Then, when price was about reaching the oversold region, I left the market to take profit. The picture uploaded below shows the entry point and the exit point.
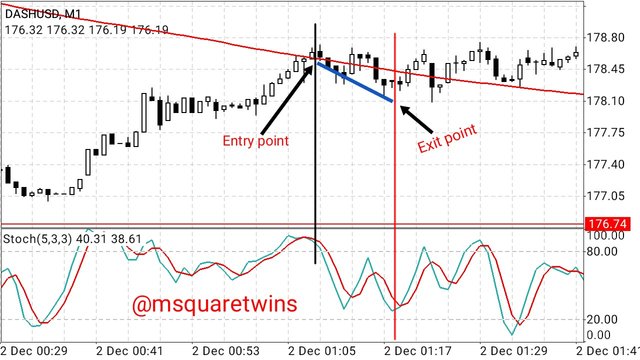
Then the picture uploaded below show the profit made on this sell order.
As we can see, although the buy order was loss with -1.87, but the sell order profit is 23.36. This means that at the end of the day, I still made profit. So if proper risk management is put to practice, it is very possible that with 2 wins and 8 loss out of 10 trade orders, one will still be in profit. And that is the power of good risk management.


Conclusion

It is very good to know the direction of price at a particular period of time so as to join the current trend or probably to wait for the tend to finish so as to position yourself for a new trend. Bit is much more important to know where and how to enter a trade even when a trend has not finish or at the beginning of a new trend. This is because, knowing the direction of a trend does not guarantee a win if you don't proper knowledge of the exact point to join a trade.
In this post I have explain the perfect entry strategy and the steps to take in making sure that trade order is executed perfectly. Also I have demonstrated this practically by taking a demo trade using MT4 platform. Special thanks to Professor @lenonmc21 for this wonderful lecture. It added a whole lot to me.
Cc:- @lenonmc21
Cc: @steemcurator02
Cc: @sapwood
The link to the expired post is pasted below