[REPOST][Crypto Trading Using Trix Indicator]- Crypto Academy /S6W3-Homework Post for kouba01


Introduction
Hello crypto Lovers!
It is another great day in the steemit crypto academy community. This week is the 3rd week of season 6 and I hope your week has been awesome. I am Kehinde Micheal and my username is @msquaretwins here on this great platform. In this post, I will be answering the questions posted in the homework section by Professor @kouba01 who presented a lecture on the topic "Crypto Trading Using Trix Indicator". Indicators are technical analysis that are used to predict and forecast price movement. In this post, I will discuss extensively on Trix indicator. Therefore, join me as we ride this wave together. Happy reading!
1. Discuss in your own words Trix as a trading indicator and how it works
What is Trix Indicator?
Trix indicator is a technical indicator that is used to predict the price movement of an asset. Trix indicator's full name is Triple Exponential Average. As its name implies, It is developed to smooth out the three exponential moving average indicators. This means that this indicator carefully use three exponential moving average for its calculation.
The essence of three exponential averages in Trix indicator is foe the purpose of filtering noises and false signal which is associated with ordinary moving average and some other type of moving averages. This however helps to filter price noises and trap in market. The importance of this indicator is not primarily based in giving signal for trade entry but for predicting and forecasting trend direction. Therefore, some other indicators can be combined with Trix indicator to identify and determine signal for trade entry.
How Trix Indicator Works
The function and working principle of Trix indicator is similar to that of Exponential Moving average (EMA). Just like EMA, Trix indicator is a line indicator plotted on a chart to draw the trend of an asset as price moves at a period of time.
The problem with simple and exponential moving average is that they don't have the capacity to filter out unwanted noises made by high volatility of price and impact news in market. To this effect, Trix indicator was birthed to solve the anomaly effect of MA and EMA. The Trix Indicator is an innovative idea of a man called Jack Huston. He created the indicator in 1980 after his conviction that combination three exponential indicators can maximally reduce noises and filter out background noises in market.
The Trix indicator is simple to understand and simply interpret price data. The advantages of this indicator over candles is that it is not affected by false signal which is caused by sharp move of price and news in market.
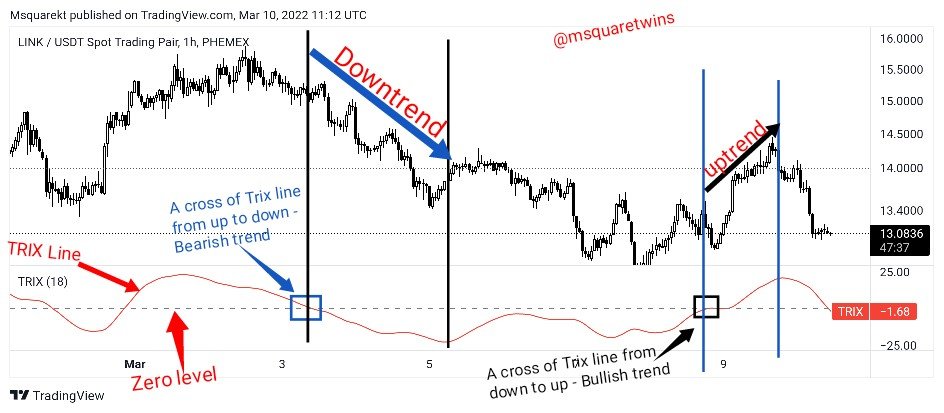
Trix indicator has a indicator window similar to Moving Average Divergence Convergence (MACD). The Trix line goes up and down a stable horizontal line called zero level, and this zero level helps traders to get information about the trend of an asset. When a Trix indicator line cross the zero level from the bottom to the upside it indicates a upward trend. The indication of a bearish trend will be a cross of Trix line from upside down.
2. Show how one can calculate the value of this indicator by giving a graphically justified example? how to configure it and is it advisable to change its default setting? (Screenshot required)
In calculating the value of any indicators, the mathematical calculation used employed the use of previous and past market data to calculate the future direction of an asset. By relating this past market data to the present, it becomes very simple to then predict the future data. As I have mentioned earlier, Trix indicator takes into consideration three exponential moving averages in its calculation. Therefore to calculate the Trix indicator, we must first calculate Exponential Moving Average (EMA)and then use this value to generate 2nd and 3rd EMA before we then calculate Trix indicator using these value.
Let us see below how it done.
- EMA = (closing price • weight ) + (Previous EMA) × (1 - weight)
Then the three EMAs is calculated thus;
EMAx= EMA ( p, N, 1)
EMAxx = EMA (EMAx, N, p)
EMAxxx = EMA ( EMAxx N, p)
N is the period under consideration and p is the current price.
EMAxxx is the third iteration and we use it to calculate the Trix indicator as follows;
- TRIX =[EMAxxx (price)- EMAxxx (t-1) ]/[EMAxxx (price-1)
The screenshot uploaded below shows Trix indicator on chart.

In any indicator that involves the use of length or period, it very important to know that it is very important to know the length or period that work well for individual trader. The trix indicator is an indicator that also make use of period which is indicated as length in the screenshot below. The default setting for most platform is 14 or 15 period. The settings and configuration of Trix indicator can be adjusted by clicking the setting icon as indicated in the screenshot.
Once the setting icon is clicked, you can be able to change the length or the period of the indicators as seen in the screenshot below. It is important to change the settings based on the trading style. For intra day trading, short length will be very effective while long term trading will require long trend for effectiveness.

Another important configuration that can be done to this indicator is uploaded in the screenshot below. As we can see, the colour of the line of the indicator can be change. Also, the zero line of the indicators can also be changed and modified as seen in the screenshot below.

3. Based on the use of the Trix indicator, how can one predict whether the trend will be bullish or bearish and determine the buy/sell points in the short term and show its limits in the medium and long term. (screenshot required)
The main purpose of Trix indicator is the identification of a trend in market. This indicator is very good when considering the direction of an asset. Like I have mentioned earlier Trix indicator has a zero line. The Trix line then oscillates up and down this zero line. A cross of this zero horizontal line from the downside to to up side will mean that the trend is bullish. A trend is said to be bearish when a Trix line cross the zero line from above.
The picture uploaded below shows the bearish and bullish trend when Trix line cross zero level from above and below respectively.
The picture below show a bullish trend and indicated by a buy signal receive as the Trix line crosses the zero level from the bottom to the upside.

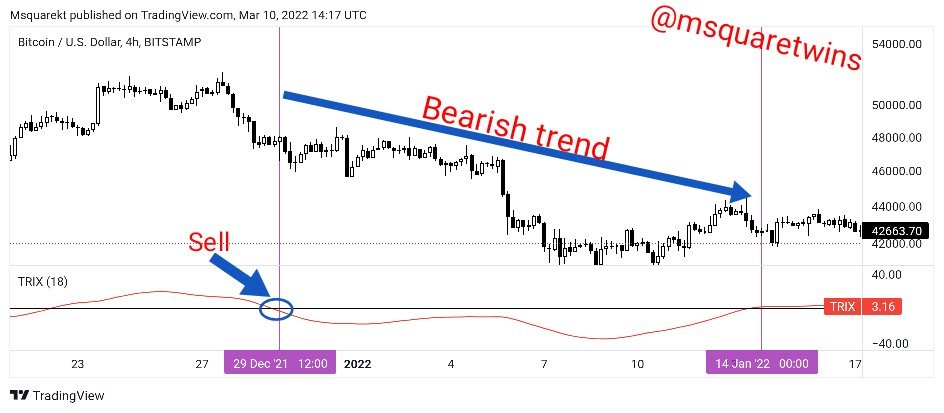
Also, the picture uploaded below shows a sell point. As seen in the screenshot, the sell has started for some time, but the Trix indicator has not yet crossed the zero level, we then wait to get the signal. After a while, Trix line crossed the zero line and that give a sell point and the asset fell massively to the downside as seen in the screenshot.
Like I have said, Trix indicator is a great indicator that is used to filter out unwanted noises in market. In the picture uploaded below, the area marked with 1 can be viewed as long term order as the Trix line crossed the zero line and this asset bought for a long period of time. In the section 2, Trix indicator was seen to be flatten because there is no clear trend in market. As such it filtered out noises in that regard. Then after some time, it crossed the zero line from above and the asset sold. The section 4 can be said to be a short term trade because immediately Trix indicator crosses the zero level from the bottom to the upside, it bought and then retraces back as seen in the screenshot.

4. By comparing the Trix indicator with the MACD indicator, show the usefulness of pairing it with the EMA indicator by highlighting the different signals of this combination. (screenshot required)
We have already established the importance of TRIX indicator in the previous topics. A trade can be placed when a Trix line reaches the extreme level of the indicator. And the Exponential Moving average of the Trix indicator can be used to filter out some noises as well. This will serves as a line signal for the TRIX indicator which is is similar to that of the MACD indicator. A buy order is taken when Trix line crosses the zero from the bottom to upside and when it crosses from the top to bottom, a sell position is taken.
Now, let's compare the TRIX indicator and the MACD indicator.
In the chart uploaded below, Trix indicator is added to the chart and Moving Average 9 is the signal line for Trix indicator as seen in the chart below. MACD indicator is also added to the chart. The default period 9,12 and 26 that come with this indicator is used. As we can see in the screenshot, the two indocators, TRIX and MACD have zero lines and oscillate up and down this line.
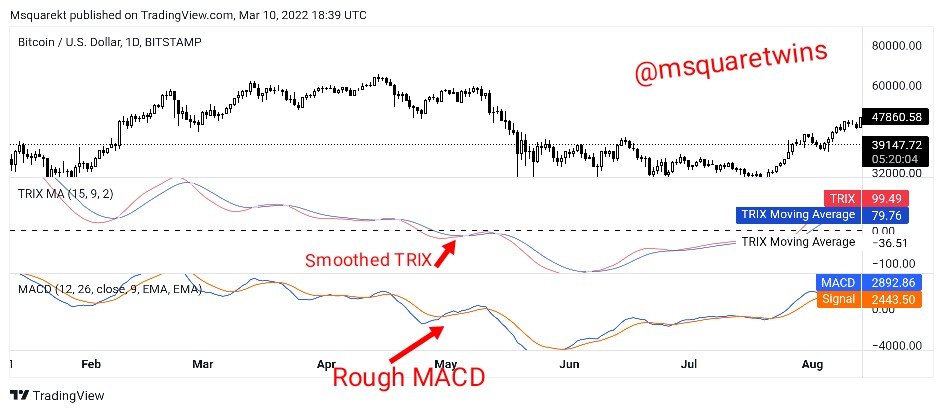
As we can see from the two indicators added to the chart above, the TRIX indicator is smoother than the MACD indicator. The MACD indicator is associated with a whole lot of noises whereas, The TRIX indicator filters out the noises in market.
5. Interpret how the combination of zero line cutoff and divergences makes Trix operationally very strong.(screenshot required)
The zero line of Trix indicator is the foundational basis of detecting whether trend is bullish or bearish. For instance, if the Trix line crosses the zero line from bottom to the upside, it means the trend is bullish and opportunity to take a buy position is always looked for. The opposite is the case for a bearish trend. For a bearish trend, the Trix line must cross the zero line from top to bottom. When this happens, it signifies a bearish trend.
The indication discussed above becomes very strong if it is supported by resistance and support level at the same time. Another important thing that can reinforce this signal is divergence. If divergence is spotted alongside this signal, it will also serves as confluence for it.
Let take a look at the picture uploaded below. As we an see the price was initially on a bullish trend but at the end of the trend, price created highs and the indicator created lows this is a bearish divergence and it means that the order is about to shift from a bullish trend to a bearish trend. Shortly after bearish divergence, Trix line and 9 EMA which acts as signal line cross each other. This then confirm the sell signal. At this cross, a sell order should be initiated. As as we can see, the asset sold.

Another example of how divergence can reinforce the signal of Trix indicator is uploaded below. What happen in this case is called bullish divergence. This is because, the candlestick chart created lows where the Trix indicator created high. The opposite movement of indicator and candlestick shows that the flow of order from a bearish trend is about to change to a bullish trend. As we can see, after this divergence, the Trix line crossed the zero level from bottom to up and traded higher.

6. Is it necessary to pair another indicator for this indicator to work better as a filter and help eliminate false signals? Give an example (indicator) to support your answer. (screenshot required)
Yes! I believe it is necessary and important to combine other indicators with Trix indicator for effectiveness. No matter how powerful an indicator may look or no matter how effective it is in predicting price movement and identifying signal for entry and exit other, it should not be use alone. For traders that use indicators for their technical analysis, having two or more indicators combined together give confluence to their strategy and of course give them confidence.
Therefore I have added Aroon indicator together with Trix in a chart as seen below. Aroon indicator is powerful indicator that can be used in conjunction with Trix indicator to better filter out noises. Aroon indicator is an indicator that use to determine the trend of an asset in market.

In the screenshot uploaded above we can see how Aroon indicators gives a buy signal prior to the signal receive from Trix indicator. And apart from that, the Aroon indicator has given more than one buy signal even before Trox indicator gives its own. Another important thing is that Aroon indicator also gives signal for exit order.
Also in the second segment, we see how Aroon indicator gives a sell signal before Trix indicator, and also gives an opportunity to exit the sell signal which Trix indicator does not give.
7. List the pros and cons of the Trix indicator
Like I said earlier, there is no indicator that is 100 percent complete. Every indicator has their advantages and their limitation. In this section we will briefly list advantages and drawback of Trix indicator.
Pros of Trix Indicator
- Trix indicator is a powerful indicator that is used to identify the trend direction of an asset in market.
- Trix indicators is a great indicator that filter out noises due to high impact news and volatility in market.
- The ability of the indicator to be used to spot divergence in market makes of suitable for detecting price reversal area.
- This indicator can be combined with other indicator like Aroon indicator for better effectiveness.
Cons of Trix Indicator
- Trix indicator does not give exact point of exit order in market.
- The indicator lags behind price in market, and this is due to the mathematical model of the calculation it employed.
- This indicator cannot be used alone. It works better with other technical indicators.
Conclusion
Indicators are very important tools that is used to do technical analysis for the purpose of determining market direction, strength of a trend, reversal point and as well as entry and exit point in market. Trix indicator is no difference in its ability to determine the trend direction of an asset. Also, it also give a signal for both sell and buy position.
Trix indicator also filters out noises in market. Although it may lags behind price. Therefore, It is advisable to combine Trix indicator with other technical indicator for effectiveness. In this post, I have extensively discussed the Trix indicators and how it can be calculated. Also, I have discussed and shown how to identify both bearish and bullish trend with the use of Trix indicator. Lastly, I talked about the importance of pairing Trix indicator with other indicator such as Aroon indicator, and the pros and cons of the Trix indicator were also highlighted.
Special thanks to Professor @kuoba01 for this great lecture.
Cc: @kouba01
Cc: @steemcurator02
Prof. @kouba01, please, my work I did last two weeks has not be curated. Please see to this.
Thank you.