CryptoAcademy Season 4 Week 1/ Homework Post for Professor @allbert / Trading with Strong, Weak and Gap Levels

Introduction
Dear Steemians,
It is a new season and a new week. I am kehinde Micheal, and my username is @msquaretwins. I welcome you all to this brand new season. It is my prayer that it will be fruitful for you all. My first task in this level for this season is taken by our amiable professor @allbert. The topic of this great lecture is "Trading with Strong, Weak and Gap Levels". He has done justice to this topic. In this post I will be answering the questions in the homework section.
Question 1
Graphically, explain the difference between Weak and Strong Levels. (Screenshots required) Explain what happens in the market for these differences to occur.
In the world of trading, traders or investors often buy and sell at support and resistance level. A support level is a level where an asset which has been experiencing downward movement for sometime tends to stop and change direction to uptrend due to the large order or buying interest at that level. Resistance level is the direct opposite of support level. This is a level where the price of an asset which has been bullish for some time tends to change to the bearish trend as a result of pile up order at that level.
When price touches resistance or support level more than two times without breaking the level, traders or investor often regard the level as a strong level. Anytime the price moves toward that level, they are always confident to wait for short or long order. Things are not always constant, often time, price do break a support or resistance thereby create another swing in that zone of which the price may still break the swing, if this happens, then the resistance or support level as the case may be is regarded as weak level. In essence, strong and weak level are nothing but strong and weak resistance or strong and weak support level.
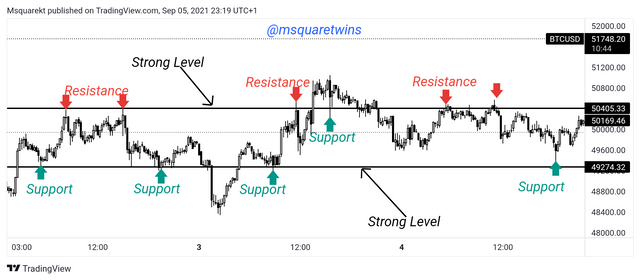
For further illustration, let's check below a screenshot taken on tradingview to demostrate strong level of resistance and support.
The chart above is a chart of BTCUSD published or taken on tradingview. The red arrows in the screenshot shows the number of times the price of BTCUSD reversed at the touch of the resistance level. The black horizontal line reading $50405.33 is the resistance line drawn to indicate this level.
The capacity this level has to withstand this touches without breaking makes it a strong resistance level. This level has a great influence on price and that's why price often reverses at this level. Additionally, the level represents zones where many orders are being placed. Enough of this. Let's see how strong support level works.
From the above screenshot, the horizontal black line at the price level of $49274.32 indicates a strong support level. Why is this a strong support level? It is a strong support level because this level has a capacity to withstand more than two touches. And this makes it a strong support. The green arrows indicates the numbers of times price has touched and respected this level. At this level, all the pending orders are executed and activated which helps the reversal of a previous trend.
Having set the background for strong resistance and support, let's now check the relationship between strong and weak level.
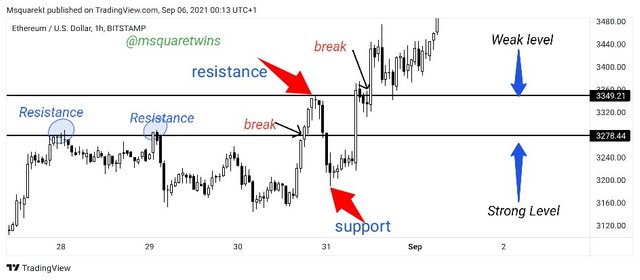
The picture above is the picture of ETHUSD asset taken on TradingView. The first horizontal line drawn at 3278.44 is the strong level of resistance line as the level has previously respected multiple touches of price. The pending order at this place are many and as such making the level a very strong resistance level. This level is also call key level.
On the other hand, a weak level is a level that is easily broken by the price. I.e the buy or sell order at this level are few thereby making the level a weak point. Let's check the picture uploaded above. From the picture above, a break of resistance occurred and price created a new resistance, the resistance indicated by a red arrow in the picture. After this, price traded below to make a support which is indicated by a red arrow. The next thing we see price do was that it went and broke the new resistance level. The orders are not many at this new resistance level and as such, price easily broke it. This level is called weak level.
Explain what happens in the market for these differences to occur.
What actually happen in the market that makes strong level to hold or occur is many order at the support and resistance level. The presence of liquidity at a support or resistance level makes it a strong level. Therefore price bounces back every time it touches this level. In essence, large amount of orders are the reasons for strong level.
On the other hand, weak level are attributed with shallow liquidity and orders. For example, in the screenshot above, when price created new resistance, the sell order activated and traded low to create a support. But the resistance was later broken because the order at that level has been exhausted and thereby a break of that level occurred. In short, when there are limited orders at the level support or resistance level, then the level is tend to be weak level as price will easily break the level.
Question 2
Explain what a Gap is. (Required Screenshots) What happens in the market to cause It.
A gap is an area of imbalance in market. It is a jump in the price of an asset. I.e the price quickly move up or down.
Let's see the screenshot below for further understanding.
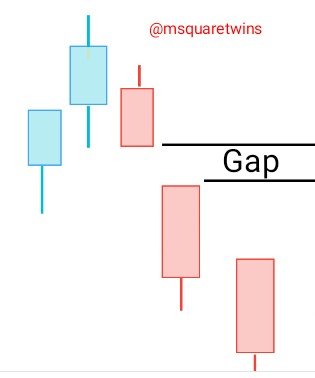
The drawing above shows the gap in market. The price quickly moved down and created imbalance and this in turn caused a jump in the price. Ordinarily, for healthy price action, the next candle should fill the previous one. But in this case, the reversed is the case.
Gap also occur in market as a result of high volatility in price. This often causes high buy or sell volume and great momentum in market.
Question 3
Explain the types of Gap (Screenshots required, it is not allowed to use the same images of the class).
The three types of gap we covered in the presentation are highlighted below.
Exhaustion Gap
This is a type of gap that occur when reversal is about to happen to the current trend.
Let's check the screenshot below
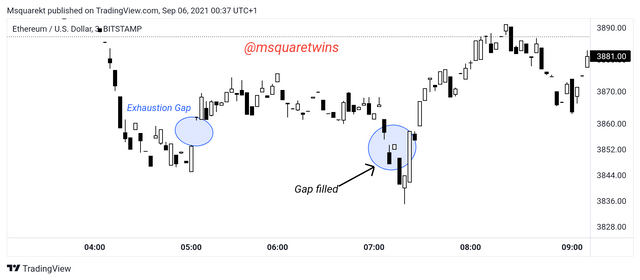
The screenshot above shows exhaustion gap. The market is seen on a bearish trend, then at some point, the price move quickly up which then created a gap. A swing was created, and later the gap was filled then there was a change in the initial trend. Exhaustion gap is not easy to trade but traders often trade enter a trade at the immediate swing to fill the gap left by the market. However, the reserved traders do wait for the gap to be filled before they take their order.
As seen from the picture, as soon as the order filled the gap, the price started rally up and there was a change in the direction of the previous trend. That's how Exhaustion gap works. Let's see another type of gap.
Runaway Gap
Runaway gaps are gaps that occur in the middle of a trend. They occur when the trend is still fresh. Unlike exhaustion gap that signifies reversal of a trend, runaway gap is a continuation gap.
Let's check the screenshot below to have a clearer view.
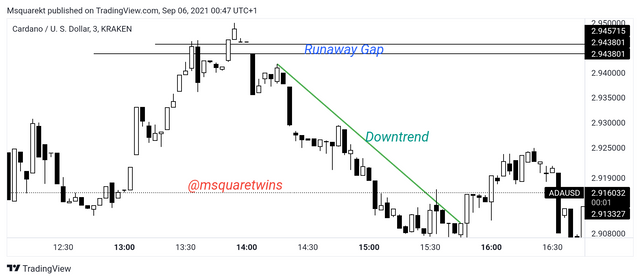
As seen from the screenshot above, a gap occurred at almost the beginning of a trend and the trend continued without filling the gap created immediately. This is unlike exhaustion type. Runaway is not easy to spotted bit trader who have mastered the occurrence of this type of gap often used it as resistance or support zone as the case may be to their advantages.
The last type I am going to discuss is breakaway gap.
Breakaway Gap
Breakaway gap as it name implies is a gap that break out of a current trend and then move in opposite direction without immediate filling of the gap. See the picture below for reference.
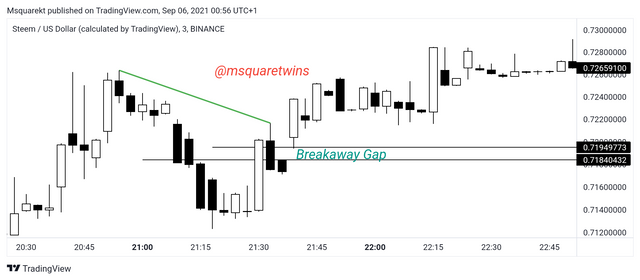
The gap area is indicated by the two horizontal lines in the screenshot above. From the screenshot, a break occurred and this caused the current trend to be violated and the price moves away from this gap to the opposite direction. This also indicate reversal of a trend. It is usually taken as strong resistance and support level.
Question 4
Through a Demo account, perform the (buy/sell) through Strong Supports and resistances. Explain the procedure (Required Screenshots).
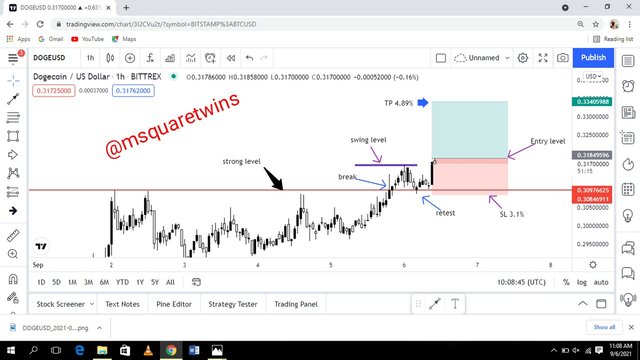
The chart above is 1hr chart of DOGEUSD. From the above screenshot, price break out of a strong resistance level. The resistance level is indicated by a red horizontal line at market price $0.30976625. Then price created a swing which forms a new resistance, as indicated by blue horizontal line in the picture above.** A retest** of the strong previous resistance the followed. Price later rallied from this place and broke the new resistance. At the break of this resistance, instant market execution of buy entry was taken as seen in the screenshot above. The SL which is 3.1% was placed immediately below the expired resistance level and **TP of 4.89% ** was set at a upper supply zone. The risk/reward ratio for this trade is 1/1.58.
The picture below further gives the details of how the order analyzed above was executed in MT4 demo account.
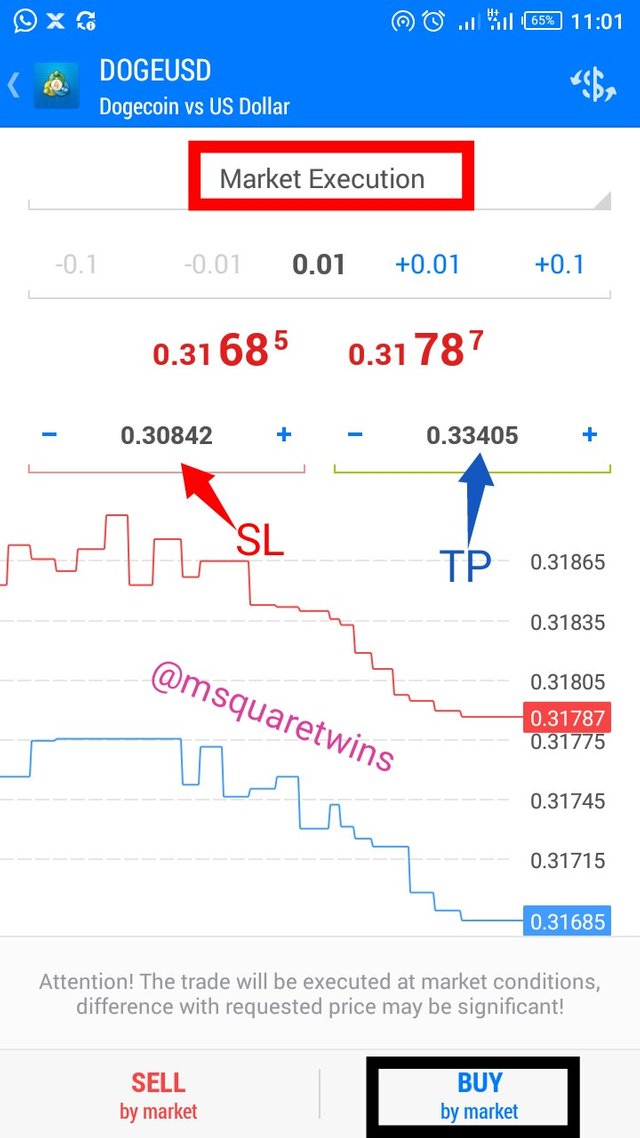
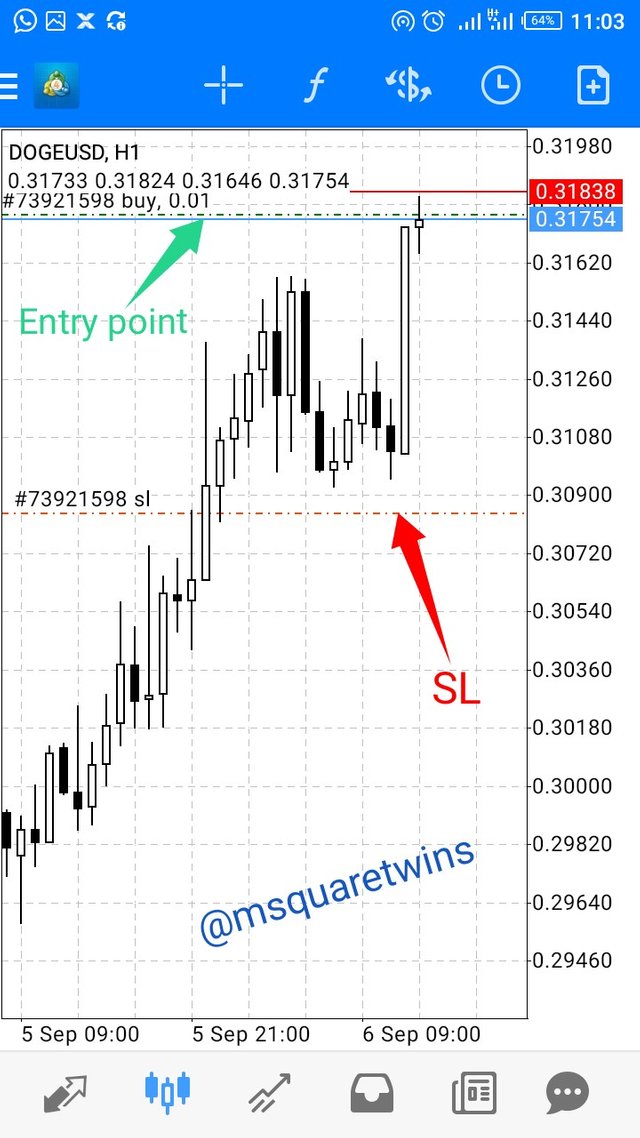
• I put the SL which 0.30842 and TP which is 0.33405 in the SL and TP box respectively as seen in the first screenshot below. I then click the buy button at the instant market execution as indicated by the red box in the picture.
• The right picture shows the executed order on MT4 chart. The entry point or level is indicated by the green arrow and SL is indicated by a red arrow. The TP is at the upper zone area, that is why it's visible on that chart.
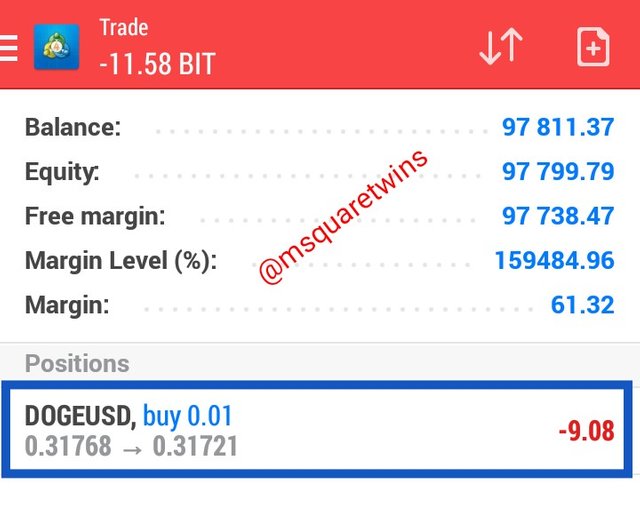
Then, let's see how the order is running on MT4. The picture below shows the running order on MT4.
Question 5
Through a Demo account, perform the (buy/sell) through Gaps levels. Explain the procedure (Required Screenshots).
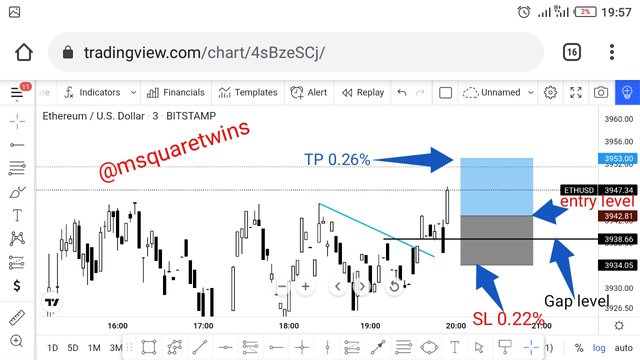
• The screenshot below shows the chart of ETHUSD. A gap was spotted as indicated by a gap line in the screenshot.
• Market then rallied up to break the current bearish trend.
• The entry for the buy order was set to the immediate buy candle after the gap.
• The slop loss 0.22% was set and take profit 0.26 was set as well given risk/reward ratio of 1.18.
The below screenshots show the ETHUSD order on MT4.
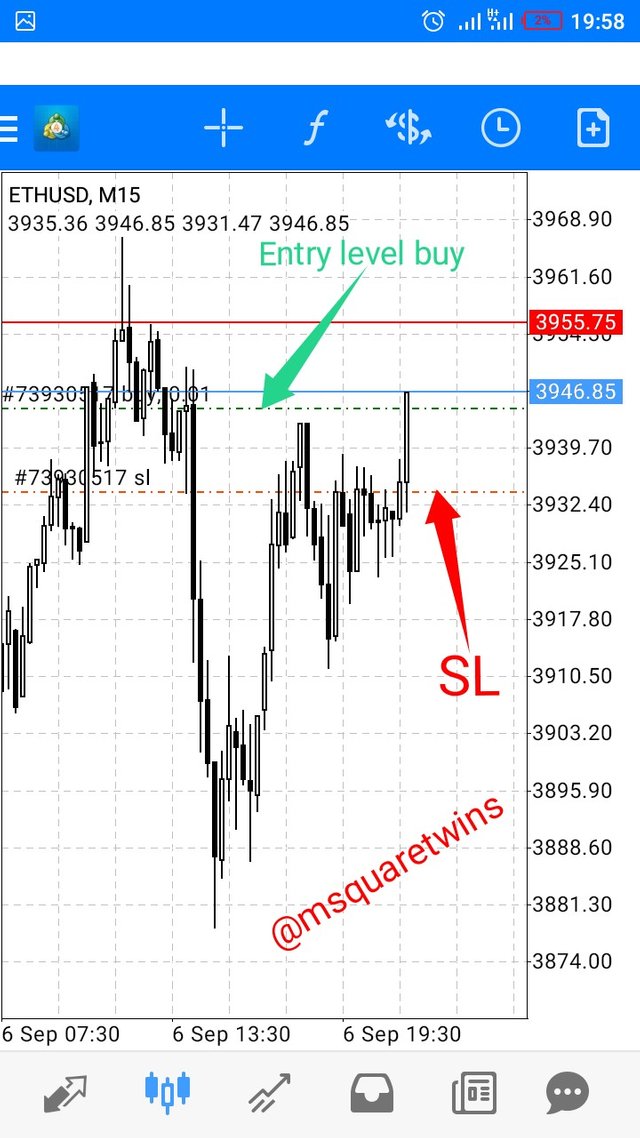
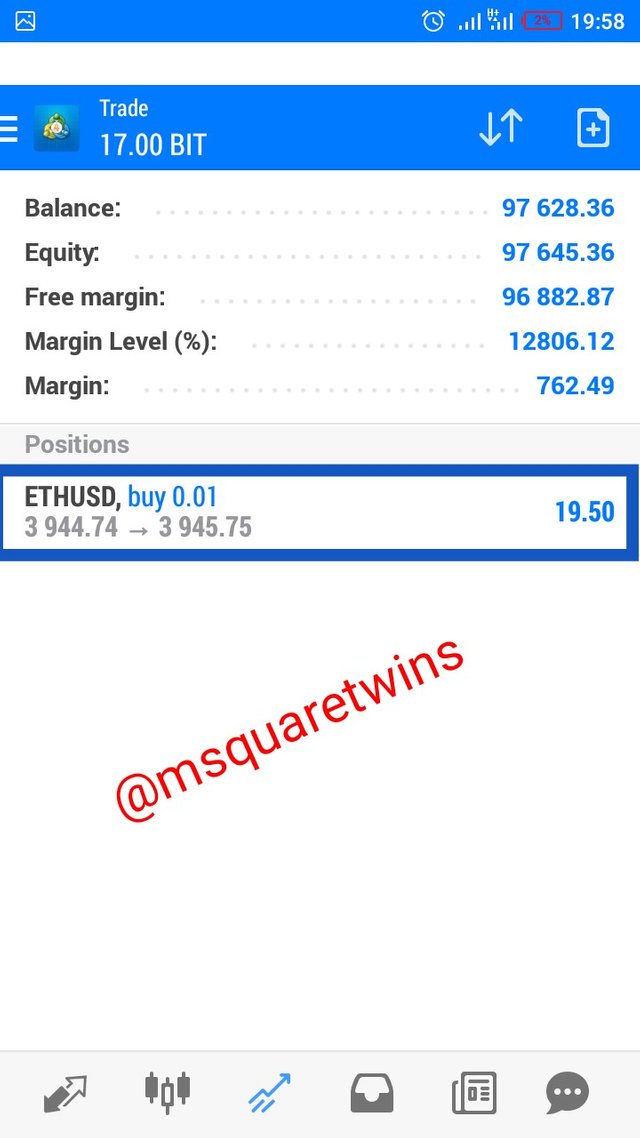
The order was executed at instant market execution and SL and take profit were set appropriately as seen in the above picture. The entry buy level is indicated by a green arrow. The slop loss is indicated by a red arrow. The TP is at the upper zone level, that's why is not visible in the chart.
The second screenshot shows the running trade we just placed.
Conclusion
The understanding of strong and weak level is great way to master potential level where order are piled up. A trader who master this strategy will not only develop confidence in his trading but also understand risk management as a result of BRB strategy that is often used along side strong and weak level.
Additionally, gap as discussed can serves ad key support and resistance level. Although gaps are not easy to trade but can serve as a great area of confluence to take order in market.
Special thanks to Professor @allbert for this wonderful lecture on trading with strong, weak and gaps level. From this lecture, I got to understand gaps and the different types of gaps in market. I also understood the uses of strong and weak level in placing a trade.
Note: All Screenshot are Taken from TradingView and MT4
Written by : @msquaretwins
Cc:- @allbert
Your Post has been manually Supported/Up-voted by @steemingdiaries which is a Community & Curation account for Steeming Diaries Community.
Comments, Votes are performed an important role for Community, hence involved with your innovative Comments & Votes on other active users posts.
Community Latest Update: Steeming Diaries CONTEST Of The Month (September 2021) | Steemit FAQ