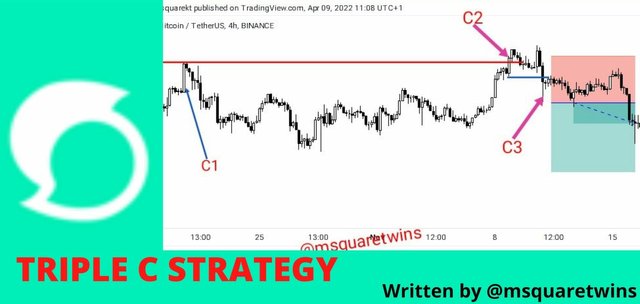
HOT PIPS CATCHER :TRADING WITH TRIPLE C STRATEGY

Introduction
Hello Steemians!
Happy weekend to you all. I hope you enjoyed this just concluded week. If you did not enjoy it probably because you did not meet the set goal for the week, don't worry, a brand new week is ahead of you. I am Kehinde Micheal and my username is @msquaretwins here on this great platform. Today I will be exposing you to some interesting stuff. I hope you find it educative and eye opening. Please follow me closely as we take this ride together. Happy reading and studying!
The strategy that I want to explain in this post is my own strategy that I discovered myself. Therefore, please, kindly take a look at it very well and practice it to be sure if it works for you or not. But before then, let's me introduce you to uptrend and downtrend in market.
Uptrend and Downtrend Explained
It is important for me to explain what uptrend and downtrend mean in market. This is because, the strategy I am about to explain works perfectly well in a trending market. A trend market is a market with a clear direction of price. A trending market may be uptrend market (bullish market) of a downtrend market (bearish market).
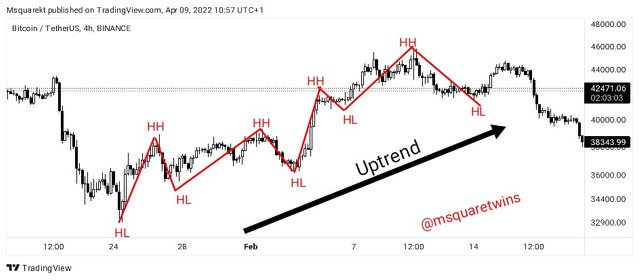
Price is said to be in an uptrend when price is making series of Higher Highs (HHs) and Higher Lowers (HLs). In uptrend market, the force of demand greatly exceeds the forces of supply and then price goes up. An example of uptrend market is displayed below.
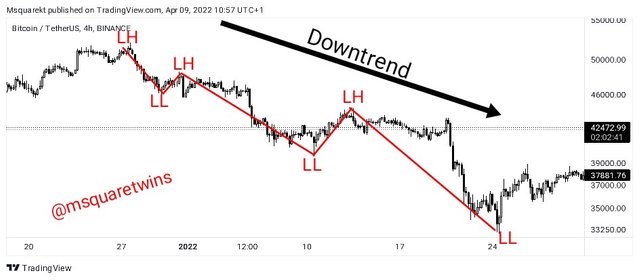
Bearish trend on the other hand is a trend with price making a series of Lower Highs (LHs) and Lower Lows (LLs). This means that the forces of supply in market at that time exceeds that of demand and price falls. An example of a bearish trend is uploaded in a chart below
Having established the meaning of uptrend and and downtrend, let's go straight to the Triple C Strategy
Triple C Strategy Explained
Like I mentioned above, this strategy is invented by me. Therefore, I want you to follow me closely.
Triple Cs Strategy is a strategy that take into account the formation of three unique candles to make a trade order. I guess you may be thinking of three candle forming together? No, these candles do not occur together, although the formation of the second will know what to do and the third will give an entry strategy.
The strategy consists of three candles which are named C1, C2, and C3. The C1 is the first candle, the C2 is the second candle and the C3 is the third candle in the strategy.
C1: This is the last candle that forms at the previous low or high of the current trend.
C2: This is the candle that break the C1 upward or downward after price has created minor low or high.
C3: This is the candle that break the C2 in the opposite direction to which the C1 got broken by C3.
Let's take a look at the picture uploaded below for more clarity.
The picture uploaded above is a chart of BTC/USDT on a 4 hour timeframe. As seen in the picture above, we have BTC/USDT asset creating a series of lower highs and lower lows as indicated in the screenshot. Then we have a last candle that created a significant low as indicated in the screenshot by C1.
After the formation of C1, price retraces back to the upward direction and make a new high. Then after this, price went back to break the previous low. Then, our C2 candle is the exact candle that break the C1 candle. Now, the idea is, if that low is valid, if price should retrace, it should not break the C2 back to the upside direction. Now, we see price after formation of the new low caused by C2, retrace back to the upside direction and then broke C2 back to the upside direction. Here, the exact candle that break the C2 is known as C3 as indicated in the screenshot.
Now, notice what price did after the formation of C3 in the screenshot above. We see price rally upward.
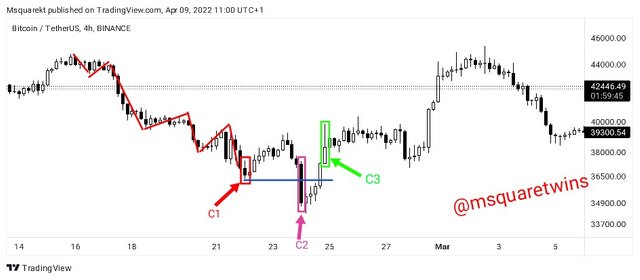
This strategy does not only work for downward trend for making a buy order, it also works for a bullish trend so as to make a sell order. Let's check another example uploaded below.
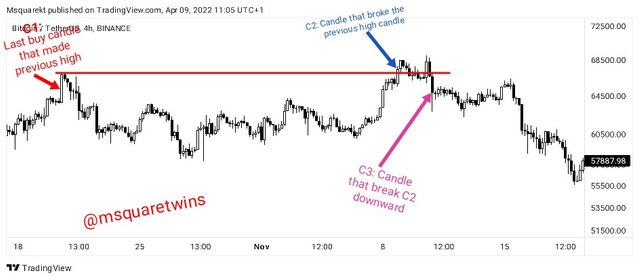
As seen in the picture uploaded below, the asset created a high and the last buy candle that formed this high was identified as C1. Then, there was a retracement to the downside. After retracement, price went up back and broke the last high as indicated in the screenshot. Then, price went back to break the C2 downward. Then the exact candle that break the C2 in this case is named as C3 as seen in the screenshot. We can see that shortly after this break, price fell and went downward.
Entry and Exit Order with Triple C Strategy
Now, how do we make an entry with this strategy? The entry and exit strategy is very easy.
Firstly, we have to look for the criteria. If the criteria is met. Then we make entry.
Identify C1 either in a bullish or bearish trend. This must be a last buy or sell candle that forms a previous high or low in the direction of a trend.
Identify C2, which is the candle that break C1 in the direction of the trend which leads to a new high or low.
Identify C3, which is the candle that breaks C2 opposite to the direction of the current trend.
If this is met, open a buy or sell order immediately after the break of C2 by C3, with a stop loss below C2 and place a take profit order at the previous high or low point.
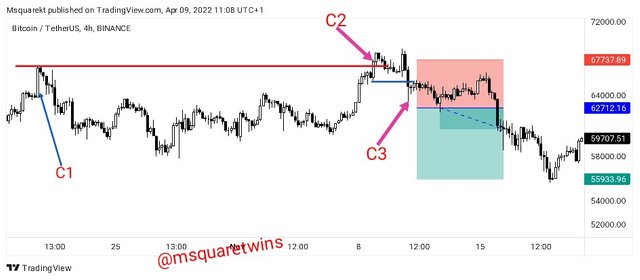
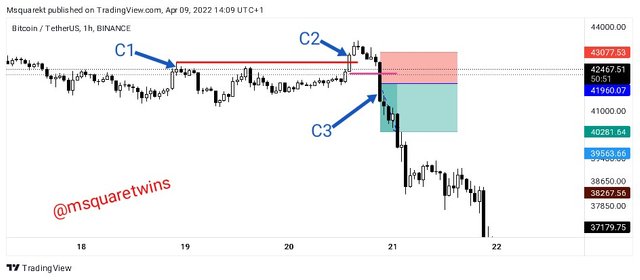
An example of a sell order is uploaded below. As we can see from the chart, I identified the C1, which is the last buy candle that forms a high. Then I also identified the C2 which is the candle that break the C1 upward. Then identified C3 which is the candle that break C2 in the opposite direction of the trend. Then immediately after the break of C2, I opened a sell order with a stop loss slightly above C2 and take profit order targeting the low point.
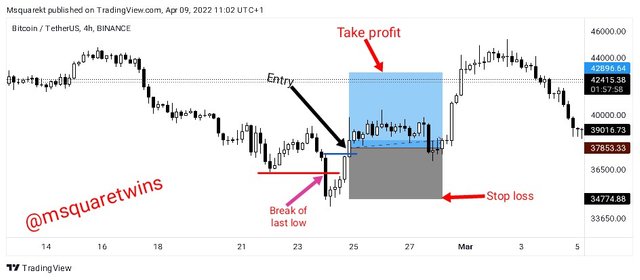
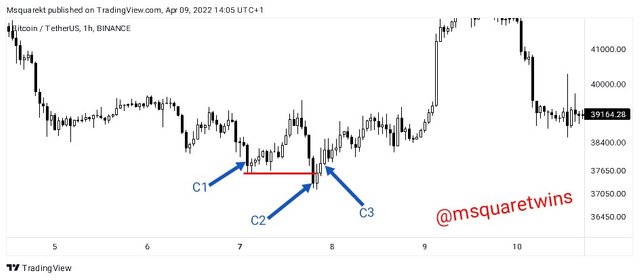
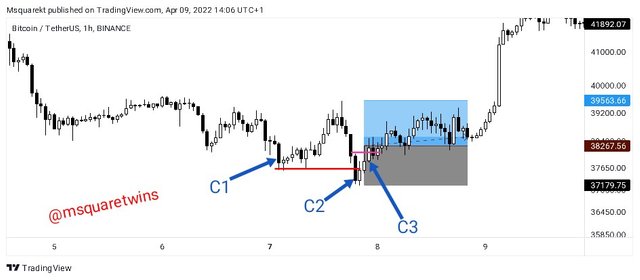
A buy order example is also uploaded below. As we can see from the chart below, I identified the candles, and I took a buy order with a stop loss below C2 and a take profit order at the previous resistance level.
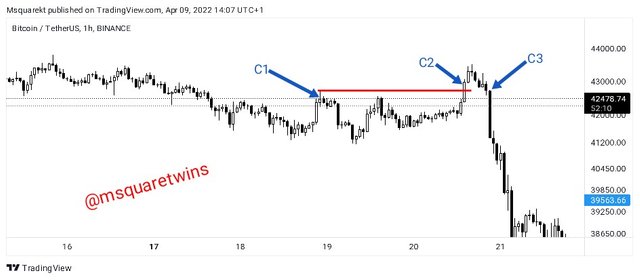
It should be noted that this strategy can work on all timeframe. This means that one can work with any timeframe of his choice.
Below are the examples of the strategy on 1 hour timeframe for both buy and sell order.
Sell Order on 1 hour TF using Triple Cs' Strategy
Buy Order on 1 hour TF using Triple C Strategy
Conclusion
In this post, I have explained the concepts of the Triple C strategy. I have clearly discussed the trade criteria and entry and exit order in this strategy. I also made it known that the strategy works for a trending market. The strategy explained in this post is my discovery through study and research of price behaviour on chart. Therefore, traders who read this and want to apply it in his trading strategy must first practice and discover if this strategy works for him or not.
I hope you find this post interesting and got value from it. Thank you for reading through.
Note: You must enter the tag #fintech among the first 4 tags for your post to be reviewed.
Thank you @steemcurator05, I will keep making quality content.
A very good looking strategy. I hope to try it out someday.
Thank you for reading @srrebullient. Do a lot of back test to understand the strategy.
I will surely do that. Thanks once again for your valuable time.
Outstanding strategy !!!
I will try it sooon
thanks dear ;)