CryptoAcademy Season 3 Week 8 / Homework Post for Professor @yohan2on / Risk Management in Trading

Introduction
Dear Steemians,
Happy new week to you all and I welcome you to week 8 of season 3 in CryptoAcademy. It has been a journey of knowledge and crypto shaping together. I am Kehinde Micheal and my username is @msquaretwins here on steemit. My first task this week is the course presented by professor @yohan2on on "Risk Management" in the intermediate class. Prof has really introduced us to the concepts of risk management in trading. I will be giving answers to the questions posted in the homework section.

QUESTION 1
Define the following Trading terminologies;
• Buy stop
• Sell stop
• Buy limit
• Sell limit
• Trailing stop loss
• Margin call
(I will also expect an illustration for each of the first 4 terminologies listed above in addition to your explanation)

• Buy stop
Buy stop in trading is a pending order set at a particular market price. Buy stop is set above the market price of an asset a trader is willing to buy. Also, it is a form of order to buy an asset or commodity when it price goes up than where it currently is. The order set will trigger when the price reaches the pending order price. This type of order is usually set when traders have not see the clear direction for a commodity they believe will buy.
How to set Buy Stop on MT4
• To set a buy stop order, go to your meta trader.
• Open it and select any asset you wish. The picture of Meta trader icon is displayed below.
• Then we have the chart of BTCUSD
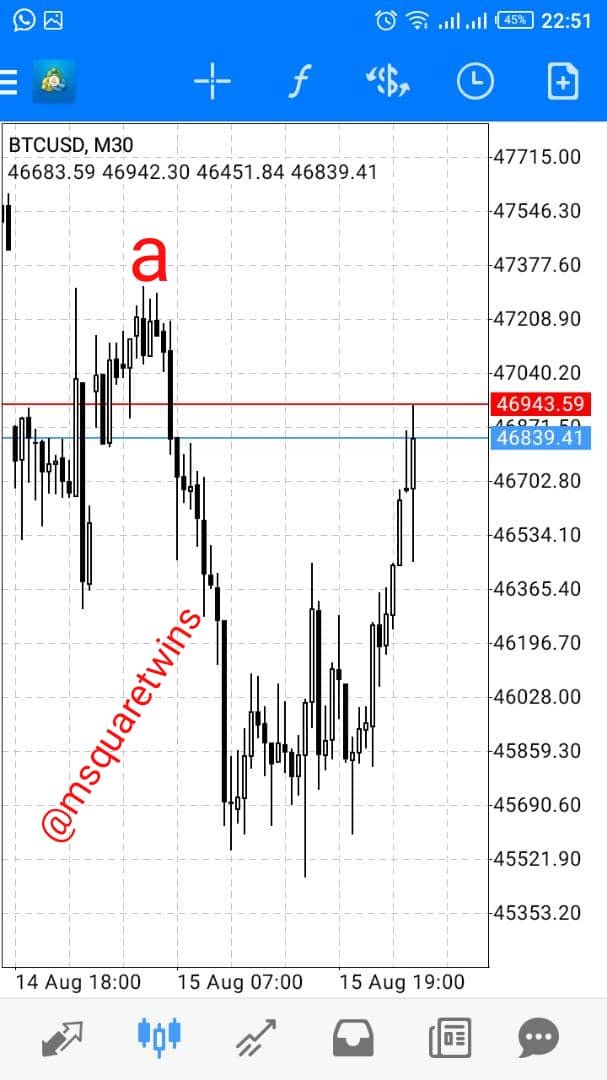
• The price of BTCUSD in the screenshot below is 46839.41. Then, let's say we wish to buy when price get to a place, say Point "a" in the screenshot below.
• When then go to execute order by clicking on the plus (+) sign at the right top corner of the chart.
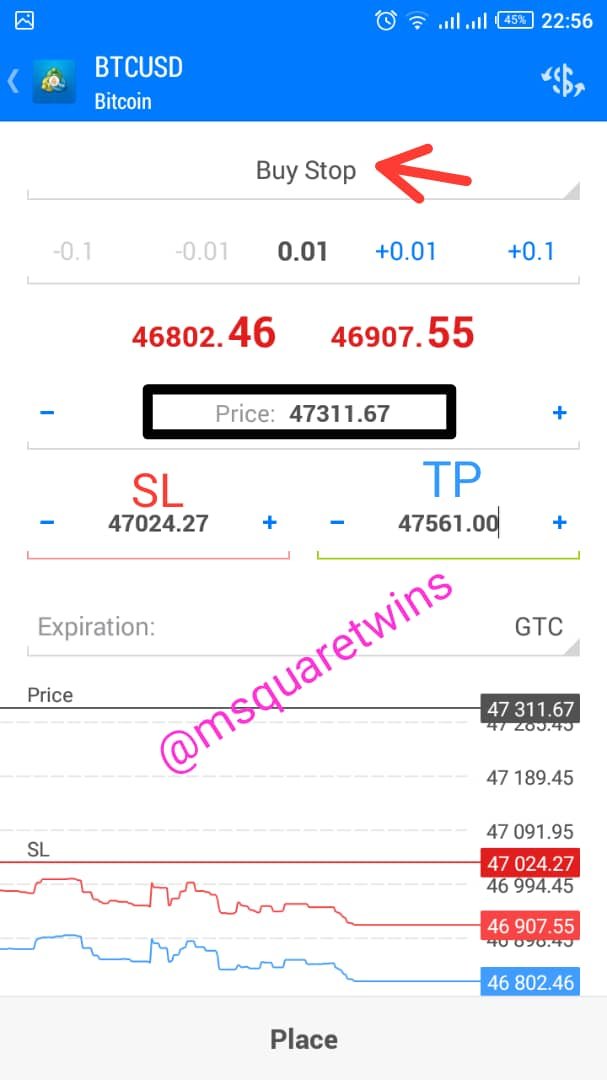
• Then, we have order page as displayed in the second screenshot. From the top of the page,
click market execution Then from the drop down, click buy stop
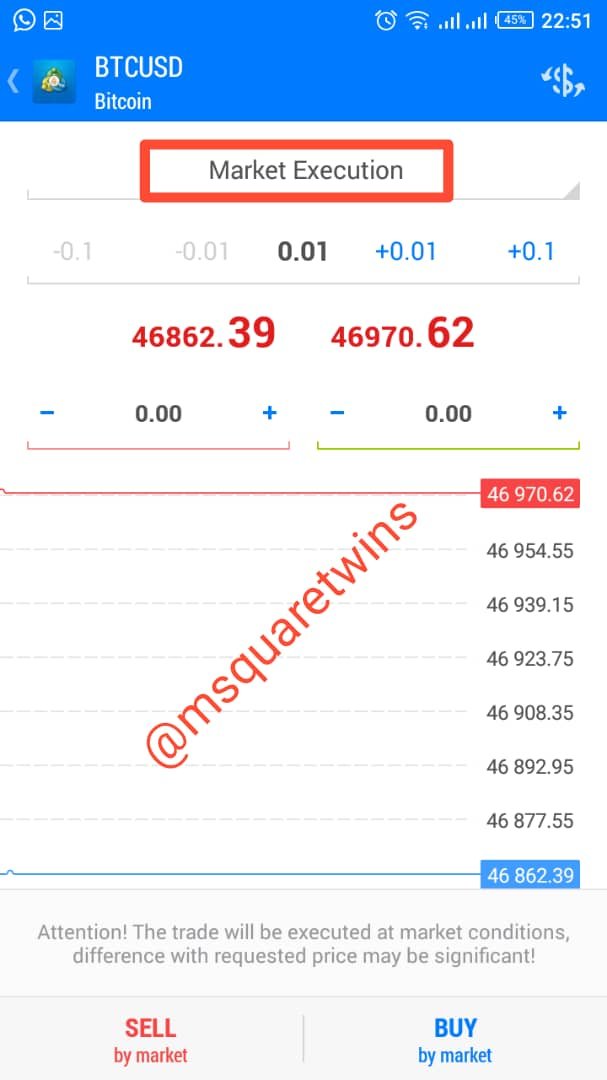
•The notice that it has changed to buy stop
• put the price that corresponding to exact point you wish to put your buy stop order.
• Also put Stop loss(SL) and Take profit (TP)
• Finally Click place
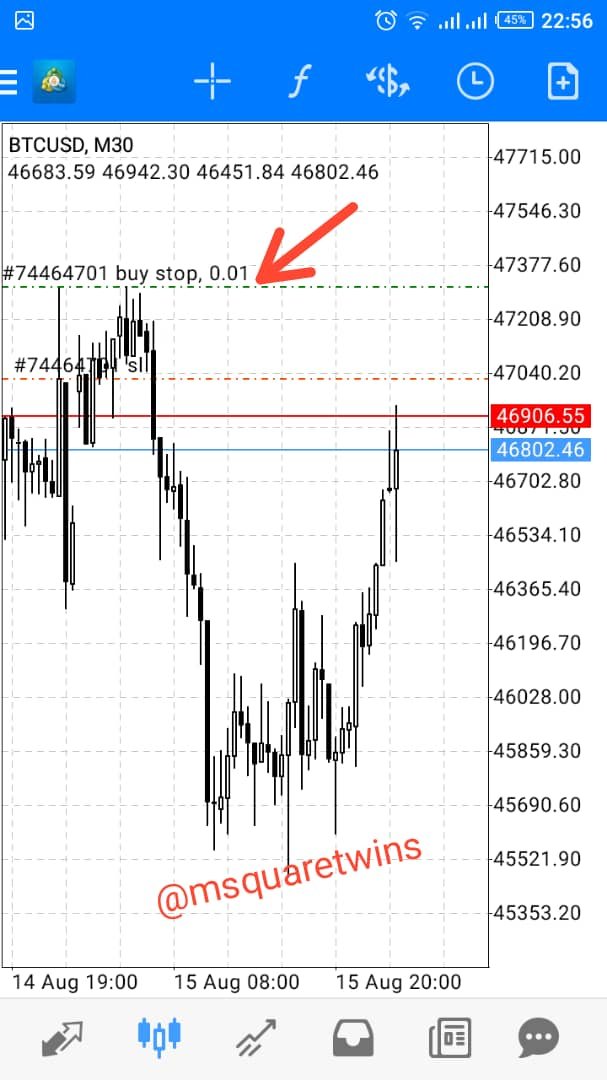
• Then you can go and view it as displayed in a chart.
• The green dotted line os the buy order line. It is indicated by red arrow.
• Sell stop
Sell stop is the opposite of buy stop. It is a pending order set below the market price. Price triggers whenever market reaches the set price. It is set for an asset that is selling. Trader set this order because they believe that for price to break a particular area, the asset will sell.
Steps to Set Sell Stop Order on MT4
• To set Sell stop, identify area you want to put Sell stop on a chart.
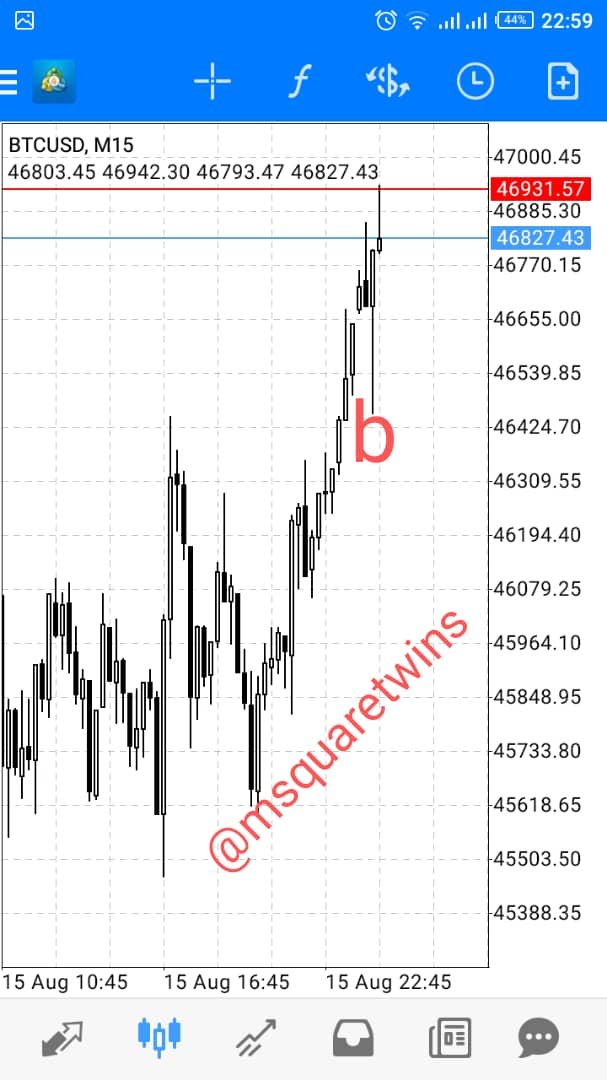
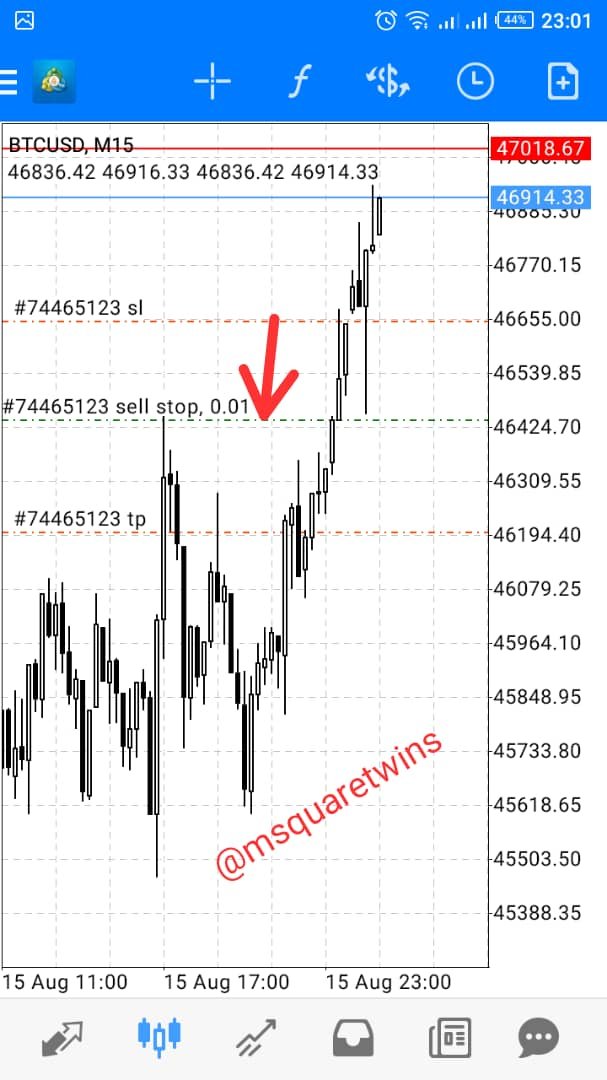
• The current price of BTCUSD is show in the screenshot below.
• Let's say we want to put the Sell stop at the point "b" on the screenshot.
• We then click the positive icon on the chart.
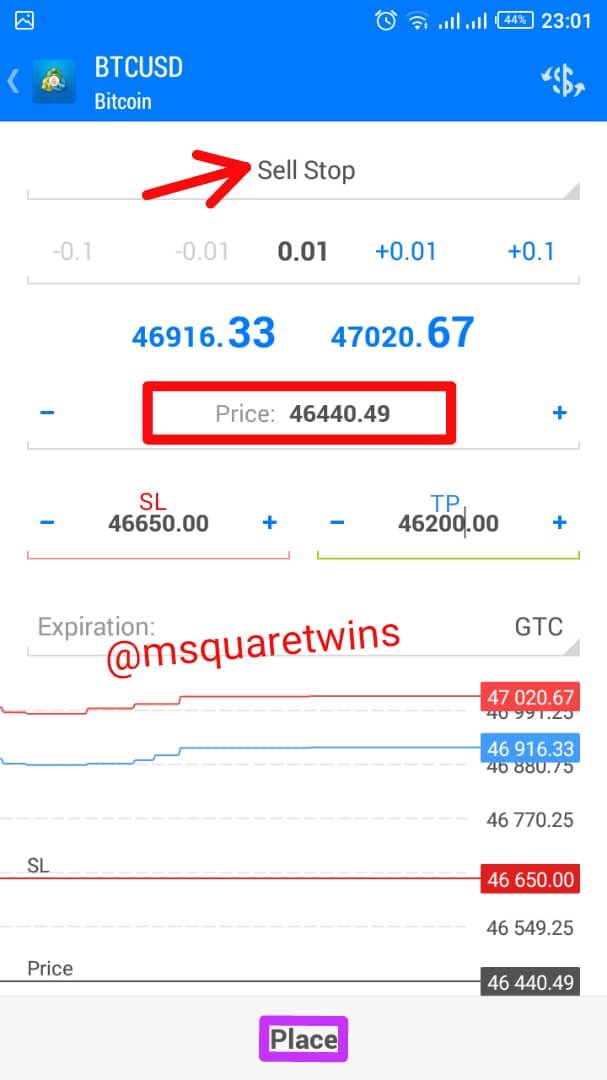
• Click the market execution to change it to sell stop
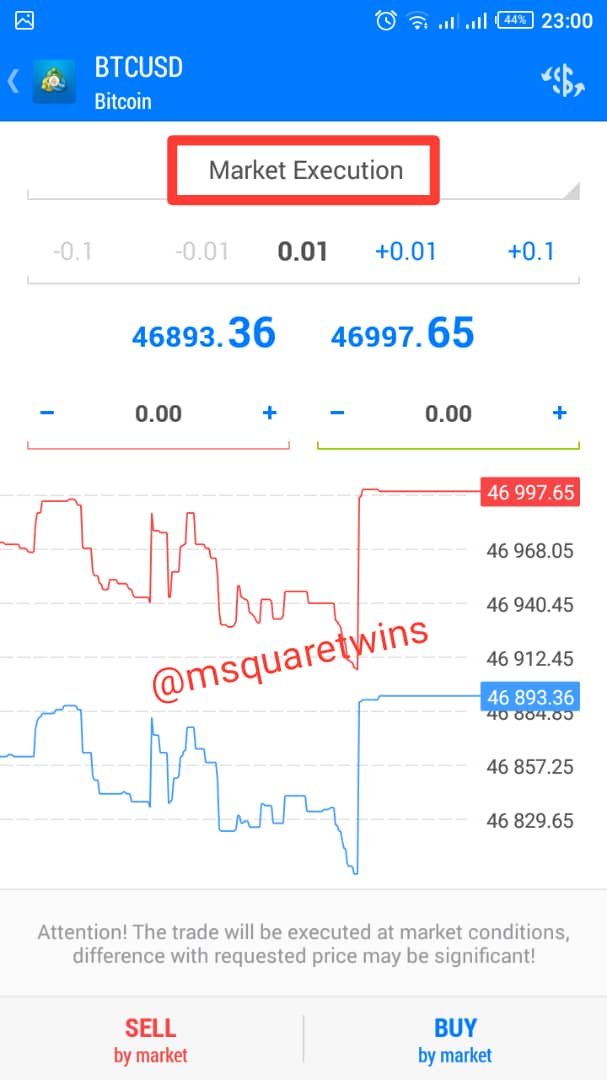
• The after you have change it, put the price at which you want to sell.
• Note, this price must be be below current market price.
• Put stop loss and take profit and then click place
• Then the order is set. Notice that the price of this order is below the current market price.
• The order will be trigger when price gets to the sell stop as indicated in the screenshot by a red arrow.
Let's see the screenshot below for details.
• Buy Limit
Buy limit is another future or pending order strategy used to open a long position in finance trading. Buy Limit allows trader to buy an asset at their own price instead of the instant market execution of order at the current market price. This pending order is set below the current market price. This allow a traders to buy an asset or commodity at a low possible price i.e at the discount level.
Setting Buy Limit on MT4
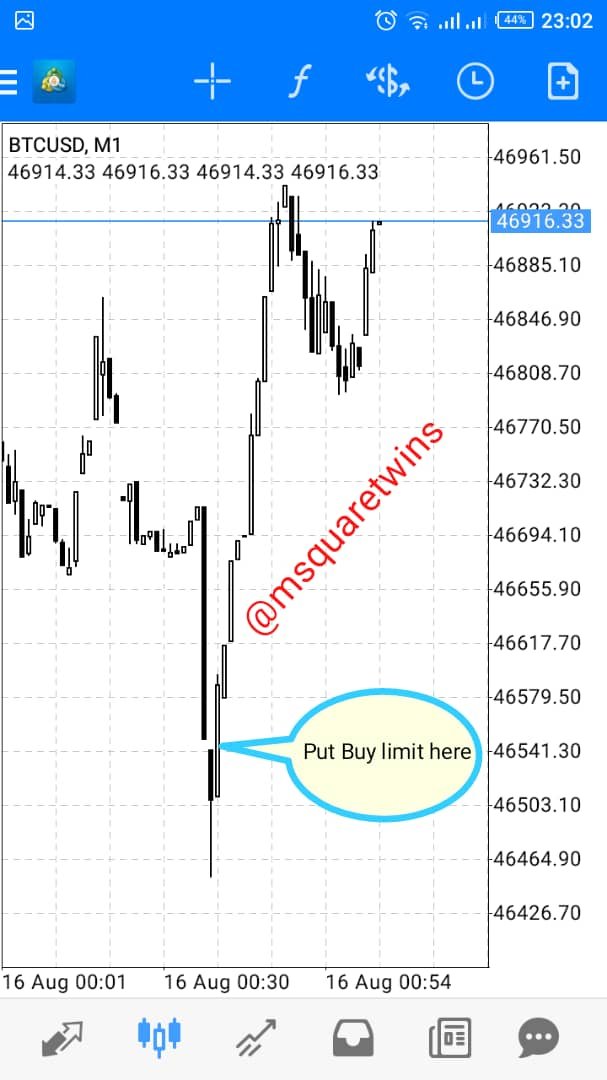
• The first screenshot show 1min Chart of BTCUSD. The current price of BTCUSD as seen in the first screenshot below is 46916.33.
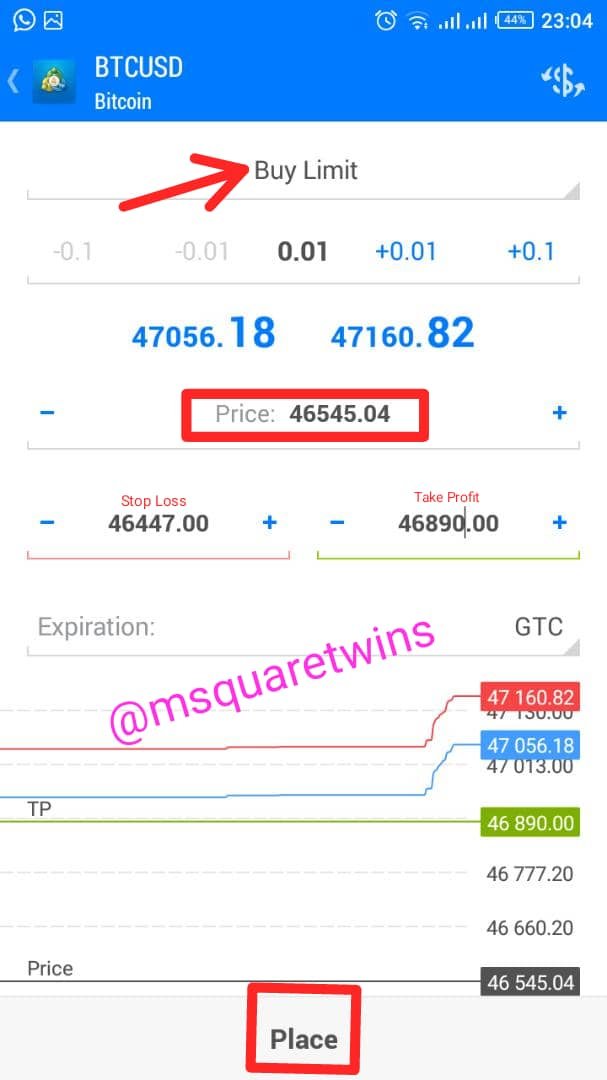
• I wish to set my buy limit, which must be below the market price at a place indicated by a call-out in the screenshot.
• Then to do this, click the positive (+) icon at the top right corner of the chart
• Then order page will appear as seen in the second screenshot. Click market execution to change it to buy limit
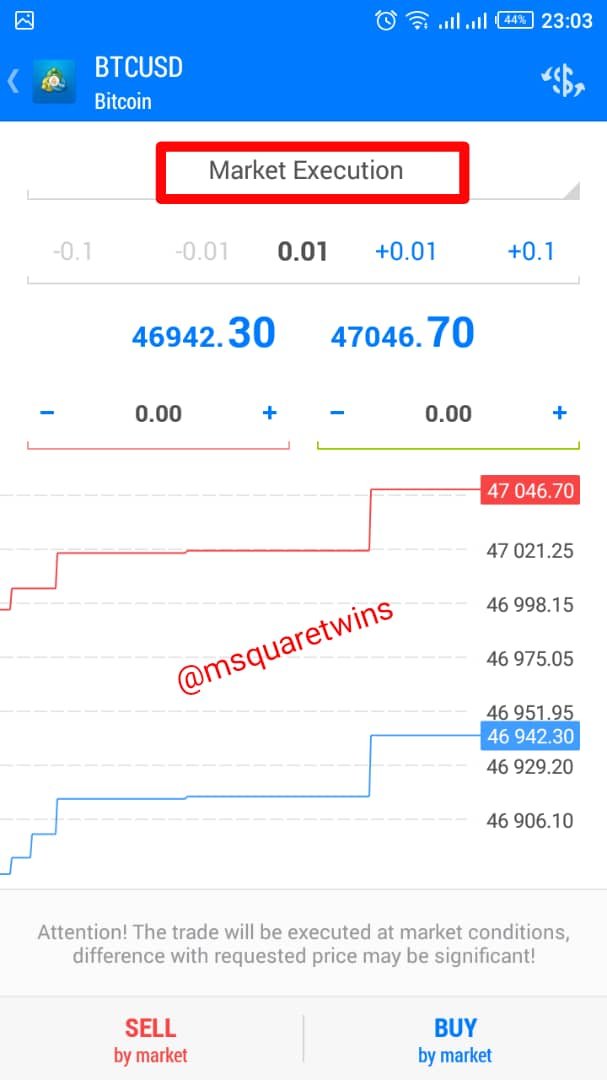
• Then notice that as soon as we change it to buy limit, price tab comes out. The price market tab is where you will put the buy limit price.
• Then put the price corresponding to the area you wish to set the pending order.
• Also put your stop loss and Take profit as indicated in the screenshot.
• Then click place
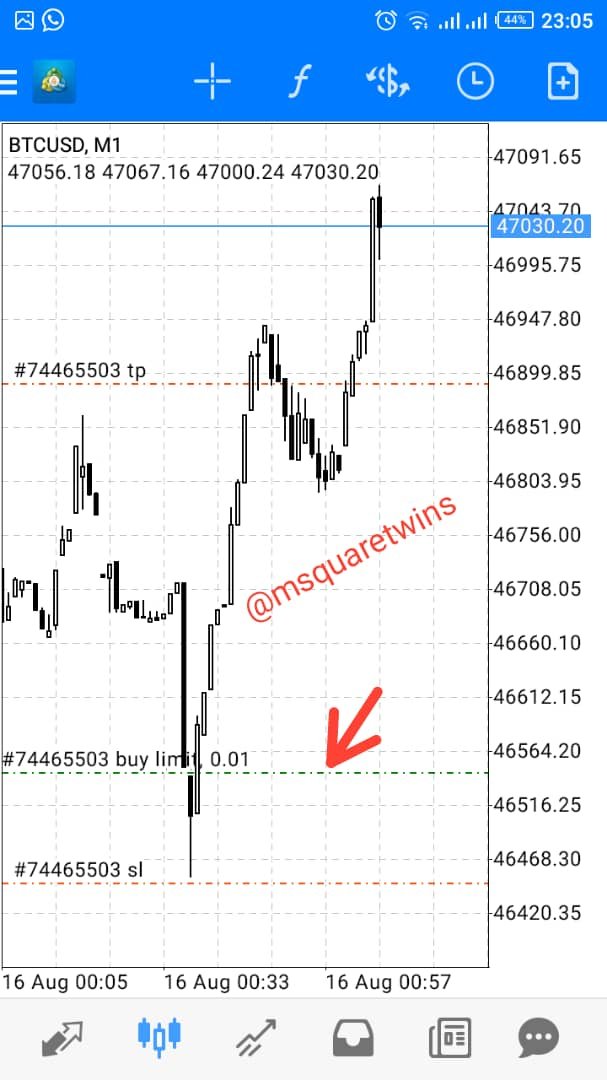
• Then the second screenshot shows the buy limit order placed which is below current market price as indicated by the red arrow.
• Sell Limit
Sell limit is a short order in financial trading. This is a pending order set to sell a commodity above the current market price. When price reaches the sell limit order, the order will trigger. This type of order allows traders to sell at their own price. Traders set this type of order when market has sold to some point and they believe that the price may give a retest of a certain area before it continues in its direction.
How to Set Sell Limit
Let's check how to set sell limit on MT4 below.
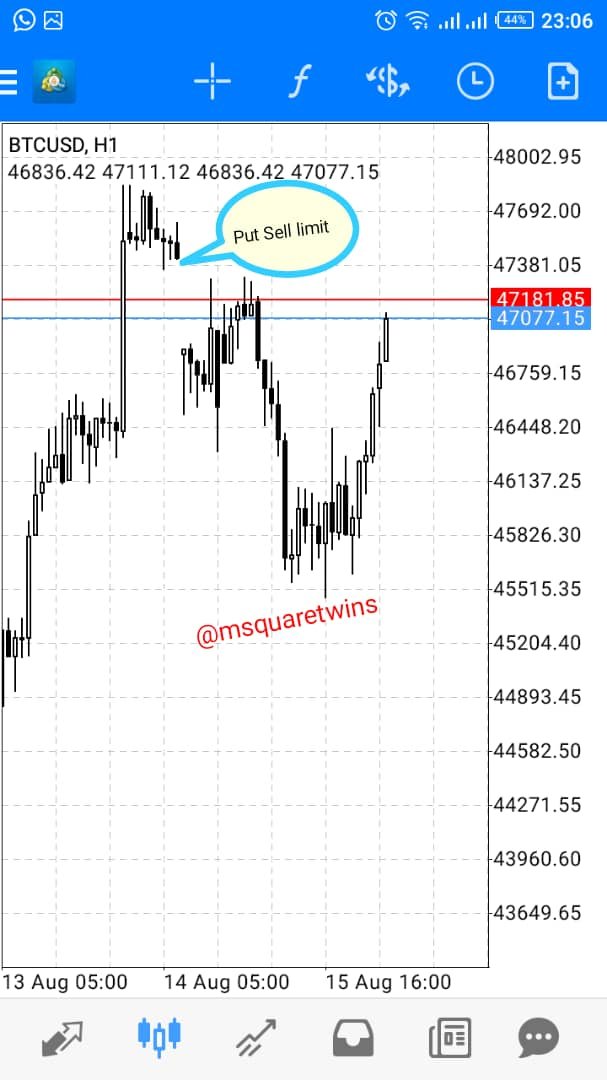
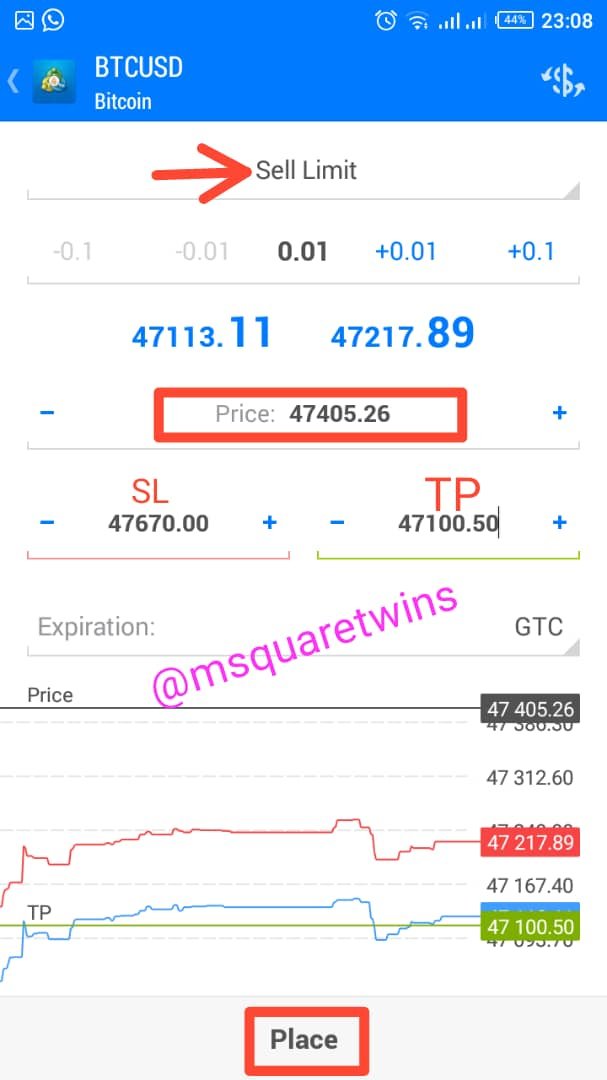
• The first scrwenshot shows BTCUSD 1hr TF chart. From this screenshot, let's say I want a short order to trigger at a place indicated by a call out box in the screenshot. I will then check the price at that place and go ahead to place the order.
• To place a sell limit order at this point, click the positive(+) icon at the top right of the chart.
• The order page will appear for you as displayed in the second screenshot. click the market execution to change it to sell limit
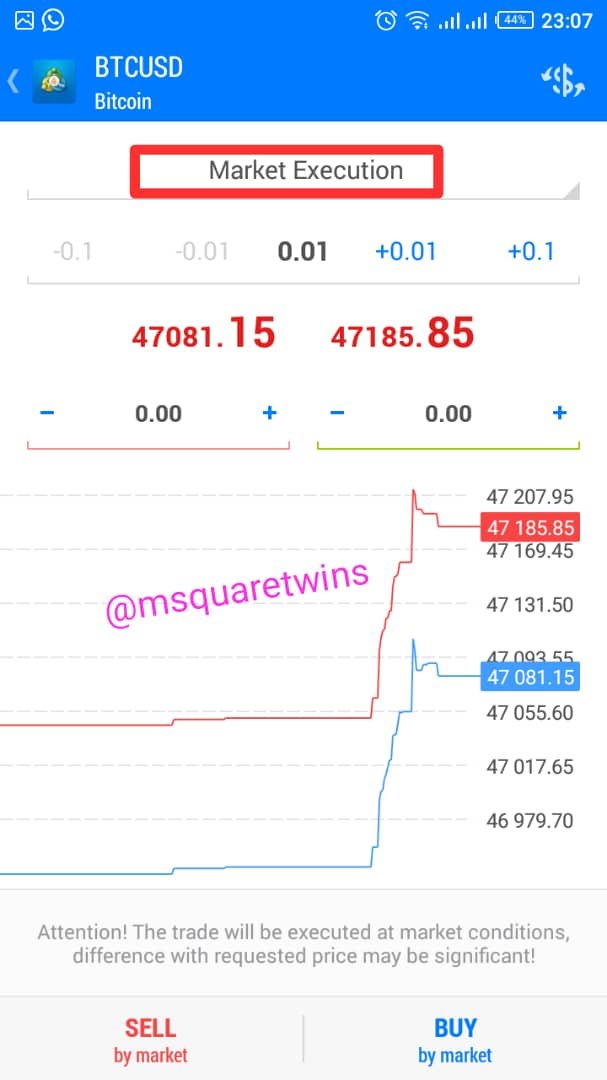
• It has now been changed to Sell Limit.
• Put the price corresponding to the point of interest. I.e the price you want the order to trigger when price reaches comes to that place.
• Also put your stop loss and take profit as indicated by SL and TP in the left screenshot.
• Then click place to set your sell limit order.
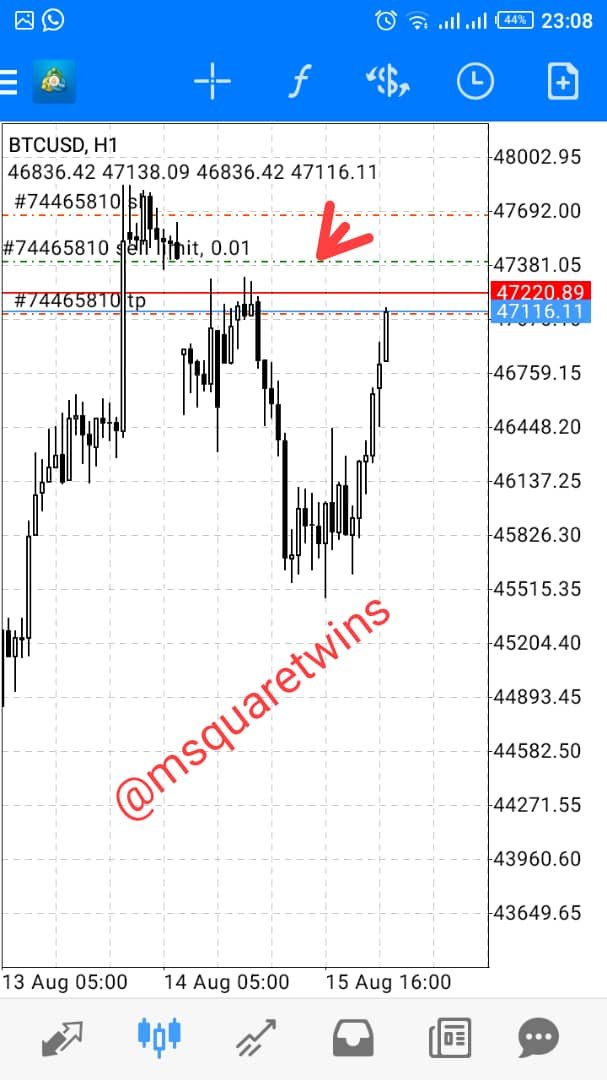
• Then the order is placed successfully. The sell limit order is seen above the current price and it is indicated by a red arrow in the second screenshot.
• Trailing Stop Loss
Trailing stop loss is a strategy used by traders to lock in profit. In this technique trader adjust the price of stop loss above the the entry point for a long position and adjust stop loss below the entry point for a short position.
For example, If a Trader A bought BTCUSD pair at market price 46000.27 and put his stop loss at 45832.58 and market moved up and went in his direction and reached a certain level let's say 46456.00. The trader A then adjusted his stop loss and put it above entry price, let's say he put it at 46233.54, then, what he did here is called trailing stop loss
• Margin call
Margin is a notice to traders that tells them to either put more money to their trading account or close the current position that is going against their order to allow for more margin. This occurs when the account has incurred so many loses that it falls below the margin level.
To understand what margin call mean, let me
first explain margin level.
The Margin level is the margin percent a trader has left to trade at a particular time. To better understand this, Let's use the mathematical equation below to explain margin level.
Margin level = (Equity/Used Margin) × 100
Suppose a trader open 3 position in his trading account with a total balance of $500 in a trading account. And let say the broker requires $120 to keep trade open. Then the margin level is calculated thus;
Margin Level = (500/120) × 100%
= 416%
So the margin level for the three position above is 416%
Now if the margin level is equal to 100%, that means the trader will be using all the balance in his account to trade, in this case, the broker will ask a trader to deposit more money or close some trader to allow him to get more margin. The notification sent to such a trader to deposit more money is called Margin call. Reference Article

Question 2
Practically demonstrate your understanding of Risk management in Trading.
• Briefly talk about Risk management
• Be creative (I will expect some illustrations)
• Use a Moving averages trading strategy on any of the crypto trading charts to demonstrate your understanding of Risk management. (screenshots needed)

What is Risk Management
Risk management is used in all financial enterprises. Risk is any event or circumstance that can have negative effect on the business. The measures or set of programs put in place to control the negative effect of risk is called risk management. Risk management is very important in trading and its importance can never be overemphasized as it helps trader to control unforseen circumstances and help to control their fund.
Additionally, Risk management is a measure that is set to control loses in trading while also maintaining good risk to reward ratio. Risk management is not only applied to losses, it is for both risk and reward.
The first thing a trader needs to learn in trading is risk management. This is because if proper risk management is not put in place, a trader can deposit certain amount of money and blow up everything in just a single trade. This has happened to me before. In 2019, I funded a trading account with $50. Then I started trading without the knowledge of risk management. Within two days, I blown up my account and that was the end.
Techniques of Risk Management
To effectively manage risk, there are many things to put into consideration. Putting some things will help a trader to better manage risk well. Let's discuss some below.
1. Stop Loss (SL): Setting stop loss in financial trading helps traders to manage and control their risk in trading. It is an exit strategy used by traders to opt out on a trade that goes against the order. Stop loss is set below the entry price.
2. Take Profit (TP): Another technique used by trader for proper risk management is the setting of take profit for trade order. If a trader does not set take profit, a trade may go in his direction and reach possible zone and reversed to go and hit stop. So it is important to set TP for good account management.
3. Trailing Stop Loss: This has been discussed extensively in question one above. It used to lock in profit. In this technique trader adjust the level of stop loss above or below the entry as trade goes in the planned direction.
4. Percentage rule: This is another technique used by traders to manage their fund. This is based on individual perspective on risk. A trader may decide to use certain percentage of his fund for trade. I will explain more about this technique under illustration of risk management.
Illustration of Risk Management
I told you earlier that I blew up the 50 dollar i funded sometimes ago within two days. Does it mean that that is how trading sucks money? Yes. You can lose all your money even with 1 to 5 mins on a trade if proper risk is not put in place.
I want to make an illustration below for you to better understand risk management in trading. Please follow me closely.
Let's use $50 I mentioned above for a practical example. The first thing to do before you start to trade is to determine a certain percentage of what you are willing to lose out of what you have in your trading account. Let's say with $50 dollar in my trading account I want to lose 1% of my total balance, then the actual amount in dollar which I am willing to lose will be;
1% of 50
= (1×50)/100
=$ 0. 5
That means, I am willing to lose $0.5 out of $50 on a trade. With that I can trade more than 80 times on my $50 account.
In another way let's assume I want to risk 2% of my account on a trade, then the calculation becomes;
2% of 50
= (2/100) ×50
=$ 1
This means that I am willing to risk $1 dollar on a trade. If a trade goes against me, with this, I can still trade more than 40 times.
A higher risk will be if am risking let's say 10% of my account. In such a case I will be risking too much which is no more a good risk management.
Additionally, reward should also be put in place. If you are risking 2% of your account for a trade, what is the percentage of the reward you will be getting if the trade goes account to plan? In that case, good risk to reward ratio comes in. The reward should be equal or more than the risk.
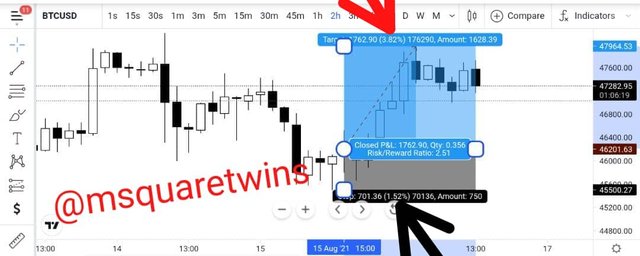
Let's see example of a buy order with risk to reward ratio on Trading view

From the picture above, the risk on this position is 1.52% as indicated by the black arrow. The reward is 3.82% as indicated by the red arrow in the screenshot above. The reward 2.51% which is seen at the middle of the position.

Demonstration of Risk management Using Moving Averages Trading strategy
Moving averages is one of the indicators used in financial trading to detect the trend of an asset or commodity. Apart from this, it is also used as a control measures to risk management.
Let's first see how to add this powerful indicator to the chart.
How to Add Moving Averages to the Chart
• To add this indicator to the chart, go to TradingView.com
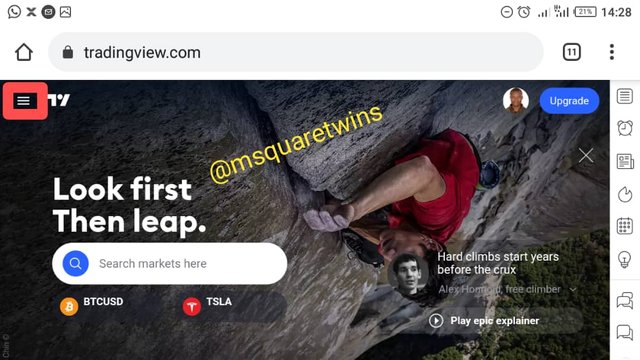
• Then from the home page, click the three horizontal icon from the top left of the page.
• Then from the drop down, click chart
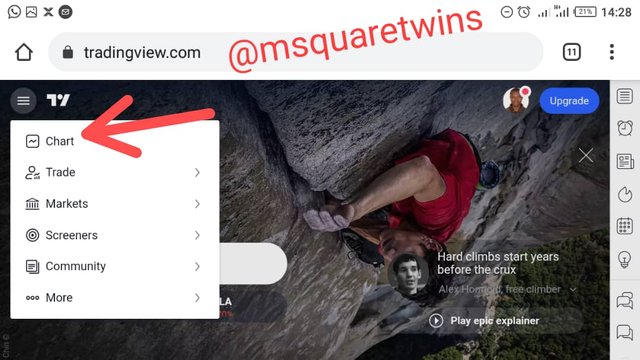
• Then you chart will appear before you.
• Then locate the indicator icon from the top of the page and click it. The indicator icon is indicated by a red box in the screenshot below.
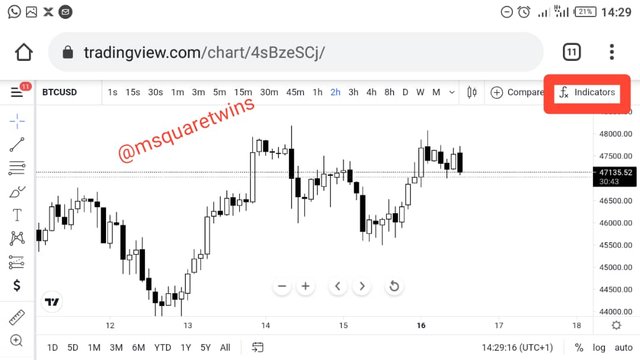
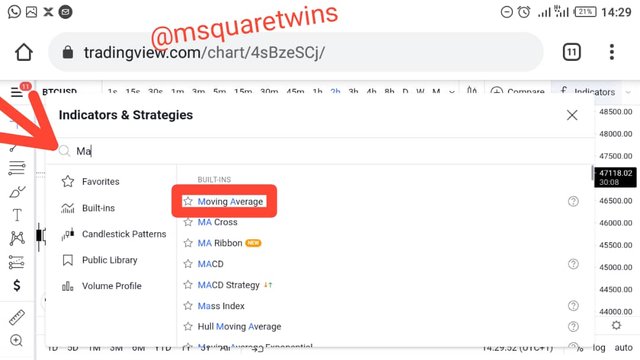
• Then search for Moving average in the search tab that appear before you
• Then click it and close the pop up window
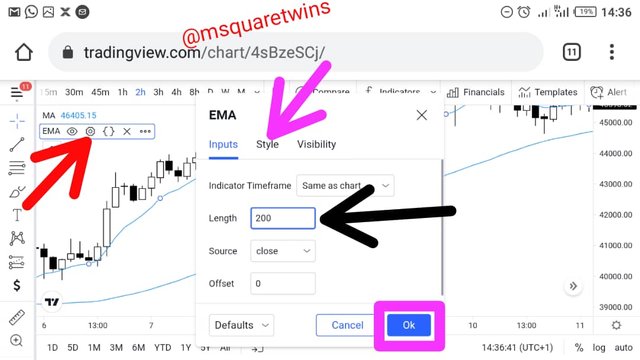
• Then the indicator is added to the chart. We will like to change the length of the indicator to 20. To to this, Click on the indicator to see the setting icon. Then click the setting icon as indicated by the red arrow, then put 20 in the for the length of the indicator as indicated by the black arrow and click "ok"
• Let's add another moving average, in this case, we will be adding exponential moving averages.
• It is the same way we did for moving average.
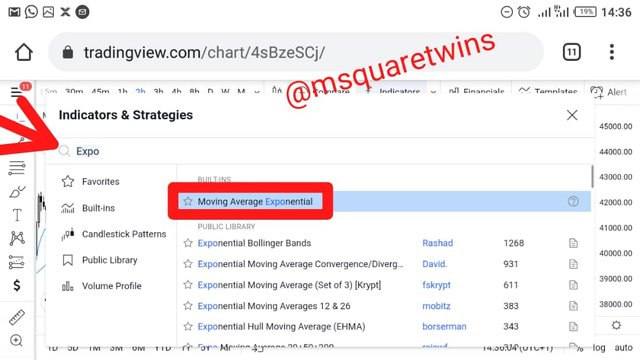
• Click the indicator and search for Exponential moving average.
Then click to select it and close the window.
• Let's edit the EMA indicator and put 200 as length and change the color to red
• Click the EMA indicator to see edit tool. Click the edit tool
• The put 200 in the length tab as indicated by a black arrow.
• Click the style and change the color to red to distinguish it from MA indicator.
• Then click ok

• Then we have the two moving averages on our chart. The blue line is Moving Average (MA) Line and the red line is Exponential Moving Average (EMA)
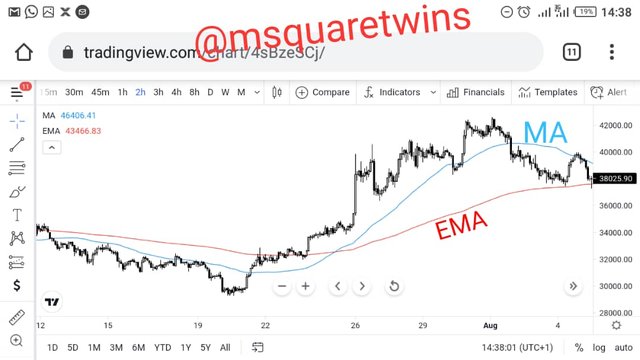
**Let's now demonstrate how to use use moving average for risk management **
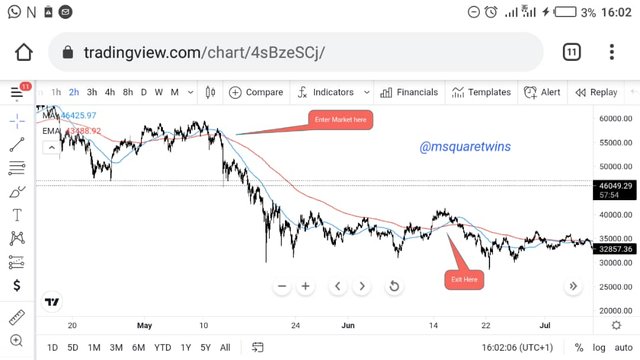
Moving average is use to detect possible area to leave the market. From the picture above, a trader with the knowledge of indicator will enter a trader where two moving averages cross each other. Then he will take his profit where the moving averages cross each other below as indicated by call out exit here.
We can clearly see that moving averages can help a trader to take profit which is one of the technique use for risk management.
Let's see another screenshot below
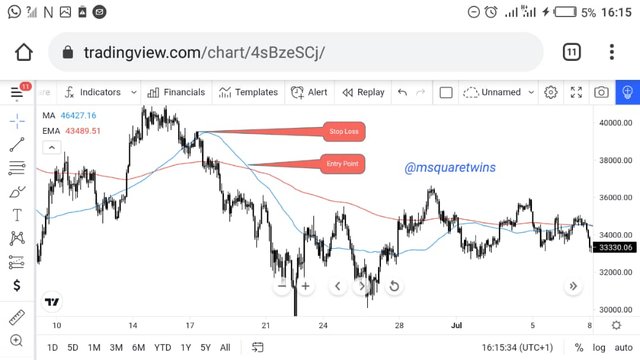
From the above screenshot, entry is taken where the two indicator crossed each other, and stop loss is placed above the MA. This strategy is used to manage risk.

Conclusion
A good trader is a trader who have good risk management. Proper risk management in trading can not be overemphasized as it dictates how long a trader will stay with his fund in trading. It is therefore very important for every trader to identify, and study the concepts of risk management.
Additionally, traders should learn techniques to help them take good measures for proper risk management. Knowing the percentage of fund to risk, knowing trailing stop strategy, locking of profit in form of partial, setting stop loss appropriately will further help traders in achieving good and proper risk management.
Special thank to our amiable professor @yohan2on for this core aspect of trading he has introduced to us in this class. It's a nice teaching and I am happy I participated in this class. Thank you Prof.
Thank you for reading
Written by : @msquaretwins
Cc:- @yohan2on
Hi @msquaretwins
Thanks for participating in the Steemit Crypto Academy
Feedback
This is good content. Well done with your practical study on Risk management.
Thank you Prof. @yohan2on. I hope to participate in your next class.