CryptoAcademy Season 3 Week 8 / Homework Post for Professor @asaj / Crypto Assets and the Random Index (KDJ)


Introduction
Good day everyone,
I welcome you all to this great week 8 corresponding to season 3 in Steemit CryptoAcademy. I hope this week will be fruitful and glorious for you all. I am Kehinde Micheal and my username is @msquaretwins here on steemit. I am glad to be writing my homework at this time for our able and respected Prof. @asaj who has explained the concept of Crypto Assets and the Random Index (KDJ) explicitly. He has really done justice to the said topic leaving no vagueness behind. Thank you prof. Without any further ado, let's go straight to the question posted in the homework section.
Question 1
In your own words define the random index and explain how it is calculated
Definition of Random Index
In trading, traders used both technical and fundamental analysis to analyse market which in turns help them to predict the movement of an asset and the direction of price over a certain period of time. Many tools are employed to carry out technical analysis in trading, part of which is called Indicator. Indicators are technical tools used by traders to predict the future trend and price of an asset or commodity.
There are many indicators used by traders to carry out their analysis, one of which is Random Index which is popularly known as KDJ Indicator. It is a technical tool used to predicts or determine the changes in price, the entry and exit point and the trend and the possible reversal area of an asset.
This indicator is similar to stochastic indicator in that it measures both oversold and overbought region of an asset. The difference is that while stochastic consists two line %K and %D, KDJ indicator has %J line in addition to %K and %D lines. The %J line shows the divergence of the other two lines.
It should be noted that as good as this indicator might look for determining price direction and entry point, it is not recommended for Lower Time Frame (LTF) chart and ranging market(market without clear direction) because it could give false signal.
Functionalities of Random Index
Random Index as said earlier is also called KDJ indicator. This indicator consists of three lines that fluctuate as price moves. The lines are %K line, %D line and %J line. Hence, the name KDJ indicator. Just as the convergence of the two lines of stochastic indicator is used for trade opportunity, the convergence of the three lines of KDJ is also used for trade signal.
This indicator also have both overbought and oversold region. The oversold and overbought region are set to 20% and 80% by default when a trader add it to the chart. However, there is an option to change the setting to your liking.
The overbought region means that the lines are above 80% and when the lines are below 20% it is said to be oversold. Traders often look to sell an asset or commodity at the convergence of three lines of this indicator above 80% in the overbought region. And the convergence of the three line at the oversold region may signify a possible entry point for a long position.
Apart from the overbought and oversold concepts of this wonderful indicator, which help traders to determine the possible entry and exit point, it also has potential of helping traders to know the trend of an asset. The %J line helps in this case. When J line rises above the K and D lines, it means the market is in bullish direction, and for a bearish trend, the J line will lie below K and D lines.
Calculation of Random Index Line
% K line, D line and J line are calculated as follows;
%K = ( 2/3 × Kp)+ (1/3 × RSV)
%D = (2/3 × Dp) + (1/3 × %K)
%J = (3× %K) – (2 × %D)
Kp is the previous day of K value.
Dp is the previous day value of D.
Traders often use 50 for Kp and Dp if there is no previous day value for for them.
But RSV is immature index value which calculated thus;
RSV =(C -L)/(H-L) ×100
C= the closing price for the period in consideration
L = The lowest price for the period in consideration
H = The highest price for the period in consideration
Question 2
Is the random index reliable? Explain
There is no technical tool that has 100% reliability. Yes, no indicator could be vouched for to be 100 percent accurate in financial trading. The wide range of indicators we have today is as result one limitation or the other from the previous indicators.
For a trader to determine the reliability and accuracy of any indicator, many back test must have been done on such an indicator, and especially because of the irregularity of price the best way to know how reliable an indicator is is to practice with demo account many times to have the real experience of it.
As I said earlier, no indicator is 100% accurate. Likewise, random index indicator is not 100% reliable but it works very well when it is mastered by traders. Additionally it reliability can be reinforced when combined with another indicator. In short, a good experience of this wonderful indicator is needed over a period of time for a trader to able to predict how reliable and accurate it is for technical analysis.
More so, KDJ work well for market that is trending. It does not work for ranging market.
Question 3
How is the random index added to a chart and what are the recommended parameters? (Screenshot required)
• To add Random index to a chart, go to TradingView.com
• From the home page, click the three horizontal icon at the left corner of the page as displayed in the screenshot below.

• Then click chart from the drop down that appear before you as displayed below.

• Then a chart will appear for you as displayed below.
• From this chart, locate indicator icon and click it. The icon is indicated by a red box in the screenshot below.

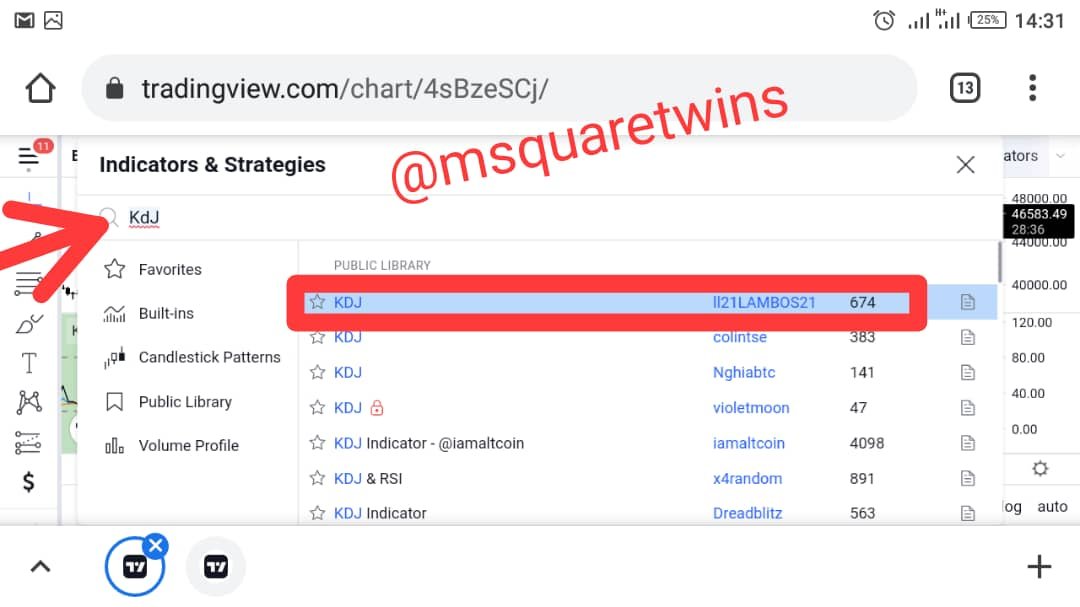
• Then, indicator page will appear. From the search box, search for KDJ ad indicated by the red arrow in the screenshot
• The click the first result and close the pop upp by clicking the cross section at the right corner.
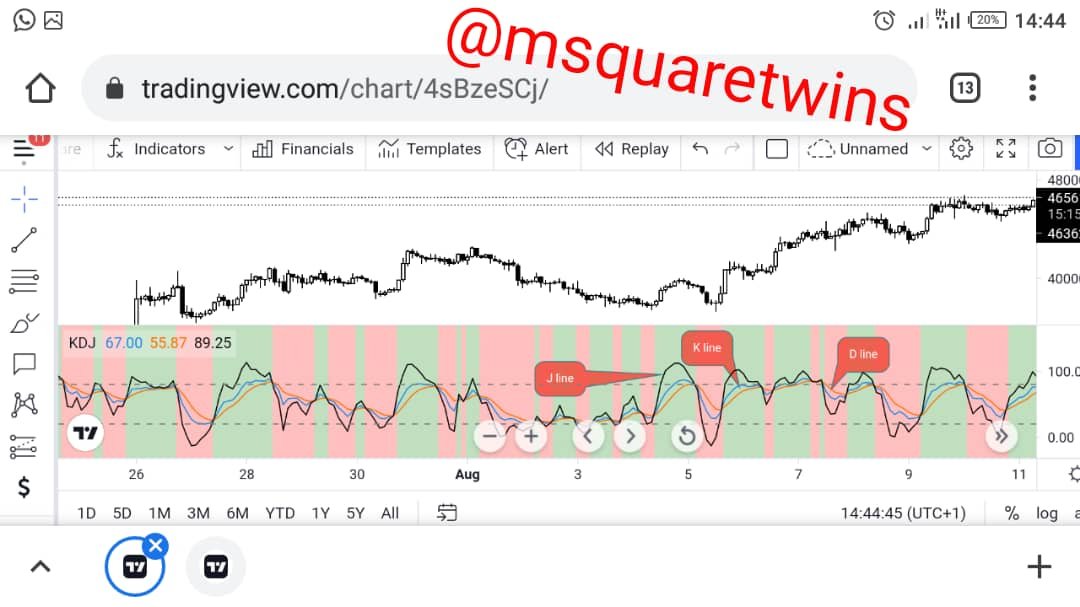
• Then the KDJ indicator will appear on the chart as displayed below.

Let's quickly check the parameters of this indicator.
• K line: The k line is the blue line as seen in the image below.
• D line: This line is the second line of this indicator, it is the red line as shown in the picture below.
J line: This line is the black line as shown below. This line is also used to determine the trend of an asset. An asset is consider bullish when it lines above the other two lines and bearish when it falls below them.
• Overbought region: The overbought region is the upper dash horizontal line in KDJ indicator. An asset is said to be overbought when the lines reach 80% and above.
• Oversold region This is the lower horizontal dash line. And this line by default is 20%. An asset is said to be oversold when the three lines of the KDJ indicator fall below 20%
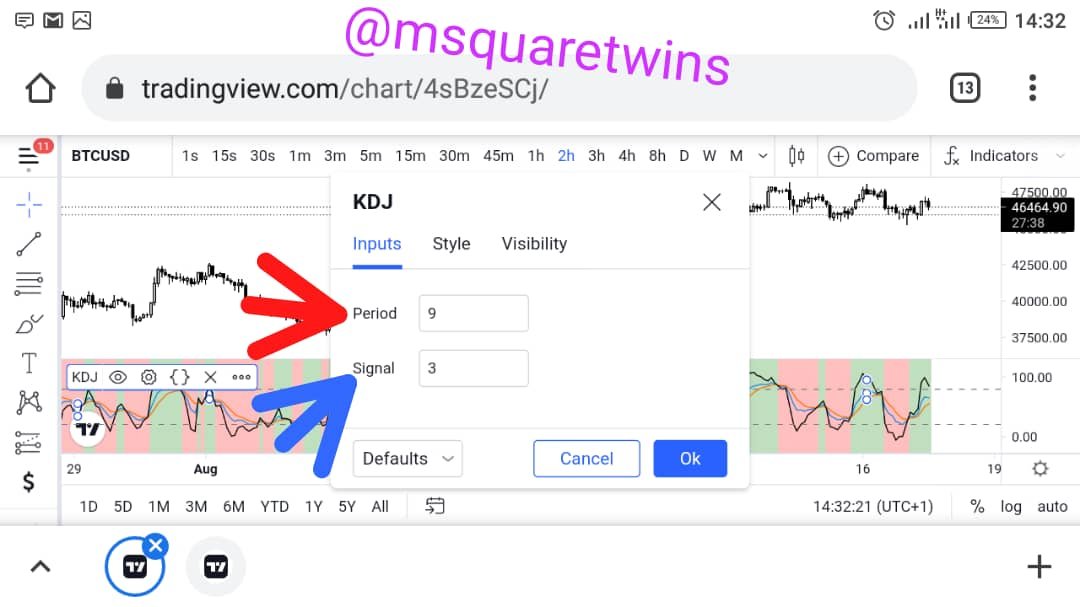
Apart from the above parameters, we also have some parameters. This parameters can be seen from the settings icon as seen from the Fig. 6 below. The default parameters is 9 for period as indicated by the red arrow and 3 for signal as indicated by the black arrow.
Final recommendation
• It is recommended not to use KDJ indicator on lower time frame.
• KDJ is also not suitable for flat or ranging market.
Question 4
Differences between KDJ, ADX, and ATR
Let's first see the picture of this three indicators on chat.

The picture above shows the differences in KDJ, ATR and ADX Indicator.
From the chart above, we can see that Average True Range move as price moves. When there is volatility in market, the line moves with volatility as well. While ADX measure the strength of the trend of this assets. And KDJ measures the changes in price at every point in time.
Tabulated differences
| KDJ | ADX | ATR |
|---|---|---|
| KDX helps traders to determine the changes in price movement | It is used to measure the strength and direction of a trend | Average True Range(ATR) is a volatility indicator that measures the movement of an asset over a period of time. |
| It is only effective for trending market. | It is used for both trending and ranging market | It is used for determining volatility in market. |
| KDJ is a modification of stochastic oscillator | ADX looks like ATR buy with a difference in volatility | It moves like simple average indicator |
Question 5
Use the signals of the random index to buy and sell any two cryptocurrencies. (Screenshot required)
I will be BTCUSD and XRPUSD for this question.
BTCUSD Pair
• I spotted the sell signal on BTCUSD pair.
• The three lines of KDJ indicator entered overbought and also crossed one another.
• This is a powerful sell signal.

• Spotting this good sell signal, I opened my MT4 App and opened BTCUSD Chart to see the overview of the chart. I then clicked the the plus(+) icon to execute my order.
• The order page appear, I took the sell order at current market price with 0.01 lot size, I put SL and TP and then hit sell button.


• The order was executed successful. The sell order is indicated by the red arrow in the screenshot.
• The second screenshot also shows the running sell order.


XRPUSD Pair
• I spotted the sell signal on XRPUSD pair on a daily time frame.
• The three lines of KDJ indicator entered overbought and crossed one another.
• This is a powerful indication that XRPUSD may sell
• I then opened my MT4 App and clicked XRPUSD Chart.
• From the chart, I then clicked the the plus(+) icon to take my order.
• The order page appear, I took the sell order at current market price with 0.01 lot size, I put SL and TP and then clicked sell.


• I then have successful execution of order. The sell order is indicated by the red arrow in the screenshot.
• The second screenshot also shows the running sell order.
•We now have the sell order for the two crypto running.


• After 9 hours, I went back to check the two trades I placed.
• The two of them have entered profit and still running.
The screenshot of the current position of the orders is displayed below.

Conclusion
This is my first time of hearing KDJ Indicator and I must confess that I have learnt how to use this indicator as a result of powerful lecture presented by Prof. @asaj
Traders therefore need to learn how to effectively use indicators to their advantage. Indicators are very useful technical tools to predict the market, especially when traders learn them in a proper way. Traders must also note that no indicator is 100% effective. Combining two or more indicators will further help them to take good market decision.
Thank you for reading.
written by: @msquaretwins
Cc:- @asaj
Superb performance @msquaretwins!
Thanks for performing the above task in the eighth week of Steemit Crypto Academy Season 3. The time and effort put into this work is appreciated. Hence, you have scored 8.5 out of 10. Here are the details:
Remarks
You have displayed a good understanding of the topic Micheal Kehinde T. You have completed the assigned task. Your answer to the second task was a bit underwhelming as you kept repeating yourself. Otherwise, this is good work. Keep it up!
Thank you Prof. @asaj. I hope to participate in your next class.