CryptoAcademy Season 3 Week 7| Home work Post for Professor @lenonmc21 |"Analysis and Trading with the indicators "Stochastic Oscillator +" Parabolic Sar "

Introduction
Dear Steemians,
I welcome you to another great week in this academy. I believe the week is going to be fruitful. My name is Kehinde Micheal, and my username is @msquaretwins here on steemit. It is with great enthusiasm I am submitting my homework post for professor @lenonmc21 who has taught the course "Analysis and Trading with the indicators "Stochastic Oscillator +" Parabolic Sar " in the Crypto Academy, beginners class for week 7 Season 3. In this post, I will be strategically answering the questions he posted in the lectures. Let's begin with question one.
Theory (No images)
1: Define in your own words what is the Stochastic Oscillator?
In finance trading, there are many indicators that are used to do technical analysis. Stochastic oscillator is one of the indicators that is widely used by investors and traders to make good market decision. This indicator was developed by financial analyst George Lane around 1950. The indicator is otherwise known as momentum indicator or Lane's stochastics. The purpose of this indicator is to measure the price momentum at a particular period of time. It solely do this by comparing the closing price of an asset to the price range over a period of time.
Additionally, this indicator is used to predict the turning point of price which in turns help traders to know the possible support and resistance of an asset.
This indicator operates within a range of 0 to 100, and this makes it easy for trader to detect the oversold and overbought region of an asset or commodity. Based on the strategy that works for each trader, the overbought or oversold region is then set. More detail about overbought and oversold will be dealt with in the next question.
2. Explain and define all components of the Stochastic Oscillator (% k line,% D line + overbought and oversold limits).
Stochastic Oscillator composes of some lines and limit. Let's define this terms.
% K line:- This line is regarded as the stochastic indicator. This line shows the actual value of price momentum It is the fast stochastic line. This line is calculated by subtracting lowest price achieved with a specified period from recent close price and dividing the result by the difference in highest high the price traded and the lowest high the price traded. Let's see the mathematical formula below.
% K line =[ RCP - LPT]/[HPT - LPT] × 100
Note,
% K = Stochastic line
RCP = Recent Close price
LPT = Lowest Price Traded
HTP = Highest Traded Price
%D line :- This is the second line of stochastic indicator. This line is not as fast as % k line. This line is a derivative of % k line. It is a discontinuous moving average line. It is regarded as the slow stochastic oscillator. This line is important because it gives traders the signal.
Traders look for the cross of both % k line and % D line to take probable trade.
Oversold Limit As said earlier, stochastic oscillator is ranged bound. The range is from 0 to 100. For an asset to be oversold, the stochastic line will enter below certain range. When the stochastic line is seen below 20, the asset is said to be oversold. And this usually happen after a long bearish moved such that the stochastic line has reached below 20 range This is use to indicate.
Overbought limit:- This is the opposite of oversold. An asset is said to be oversold if the stochastic oscillator is seen within 80 to 100. This indicate that the reversal of a bullish trend is around the corner. This helps to determine the market condition at a particular period of time.
3. Briefly describe at least 2 ways to use the Stochastic Oscillator in a trade.
Stochastic Oscillator is used in the following ways;
To Detect Trend Reversal: Stochastic Oscillator among others is used to detect the potential reversal of a trend. After an asset has moved on a particular trend whether bearish or bearish, the movement of stochastic line at that period helps traders to know if the ongoing trend is about to retrace. For example, if an asset is moving on a bullish trend and it get to a certain place that stochastic line enter an overbought region, reversal of the ongoing trend may be around the corner.
Trade Signal: Another importance of stochastic oscillator is the trade signal. The two lines %k and %D are used specifically to enter trade based on the experience of trader. For example when an asset has entered an oversold region and the two stochastic line cross each other upward, It may give a nice buy signal. And if an asset has entered an overbought region and these line cross each other, trader may envisage a sell order.
Support and Resistance: Stochastic oscillators also helps traders to know support and resistance zone. Additionally this gives trader clue about demand and supply zone of an asset.
4. Define in your own words what is Parabolic Sar?
Parabolic sar is another beautiful indicator developed by J. Welles Wilder. This indicator is used to determine the price direction and possible change of trend of an asset. The indicator is also know as Stop and Reverse (SAR) indicator. This indicates where price stops and reverse, and that is the reason why it is used to detect price direction and reversal. It is also used to make entry and exit point for a trader order. More so, this indicator is always effective for an asset that is trending. It is a very powerful indicator that when combine with other indicator give 70 to 80% success.
Unlike other indicators, this indicator is unique in that it is represented as a series of dots on a chart. This dot are always close to the candlestick, bar or any chart pattern being used by a trader. And many traders look out for the change in the movement of these dot to position themselves for possible order. The trend is considered as a bullish signal if the dots are seen below the current price. Otherwise it is considered bearish signal. In comparison with the moving average indicator, it is similar, just that it moves very fast than moving average. Using only this indicator is not advisable, it is much better if combine with another indicator.
5. Explain in detail what the price must do for the Parabolic Sar to change from bullish to bearish direction and vice versa.
For a bullish or upward trend, the parabolic sar is seen below the price of an asset. Price keeps moving upward while the parabolic dots keep lying below this price. For parabolic sar to change it direction from bullish direction to bearish direction the price must touch the parabolic sar. In that case the uptrend move will change it direction to bearish trend.
Also, for a bearish trend, the dot of parabolic sar are positioned above the price. As long as the trend continues in the bearish direction, the dots keeps lying above the price bar. For parabolic sar to change it direction from bearish direction to bullish trend the price must touch the parabolic sar upward down. This will then signify the reversal of the ongoing trend.
6. Briefly describe at least 2 ways to use Parabolic Sar in a trade?
Trend Tracking: One of the best indicator to track trend is parabolic sar. It is use specifically for a trending market either bullish or bearish. It is use to determine the direction of an asset over a period of time. If the series of dots are placed below the price, it is said to be a bullish trend, and for a bearish trend, the dots are placed above the price.
Entry and Exit Point: Another importance of parabolic sars is the possibility to detect entry and exit point for a trade order. For instance, if a bullish trend is about to reverse, the price will cross the dots from downward up. On seeing the cross of price, a trader who has been riding the bullish trend will begin to withdraw his asset and exit the order. Also, at this point it is a good place to prepare an entry for a sell order.
Practice (Only Use your own images)
1. show a step by step on how to add the Stochastic Oscillator to the chart (Indicating the% k Line and the% D Line, the overbought and oversold zone.
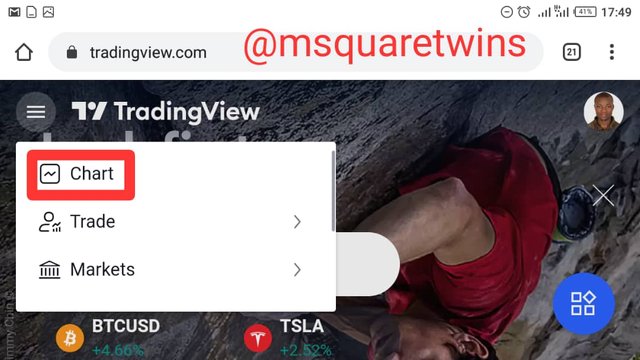
• To add stochastic oscillator to that chart, first go to https://www.tradingview.com/.
• A page will appear as displayed in the screenshot below.
• Click on the three horizontal line as indicated by a red box in the screenshot below

• Then click on the chart at the top left corner as seen in the image below.
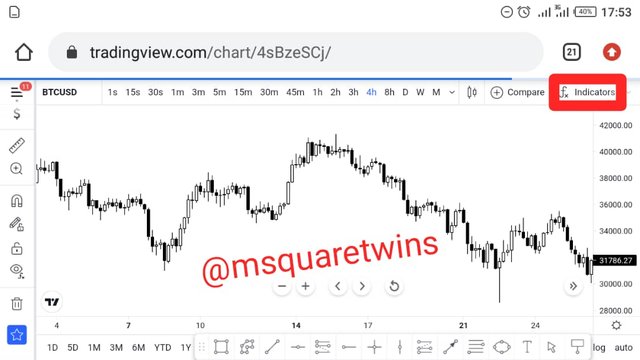
• Then the chart page will appear for you.
• At the top of the page, locate an indicator icon and click it. This icon is indicated by a red box in the screenshot below
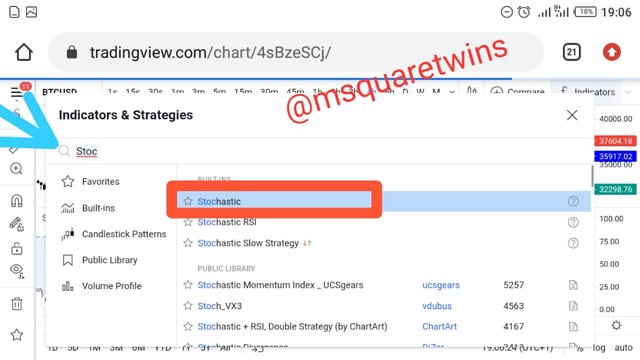
• A pop up page will then appear, type stochastic in the search bar and click it. The screenshot below shows this step.
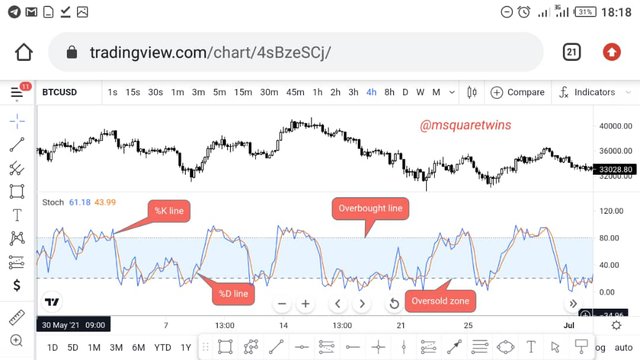
• Lastly, we have stochastic oscillator on our chart.
• The %k line is the blue line while the %D line is the brown line.
• The oversold region or zone starts from 20 downward while the overbought zone is from 80 to 100
2. Show step by step how to add Parabolic Sar to the chart and how it looks in an uptrend and in a downtrend.
• To add parabolic sar to the chart, click indicator from the top of the page.
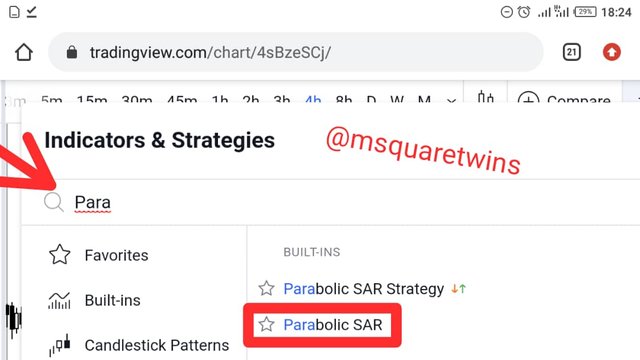
• The indicator page will appear. Type parabolic sar on the Search bar and select it to add it.
Let's check this screenshot below for this syep
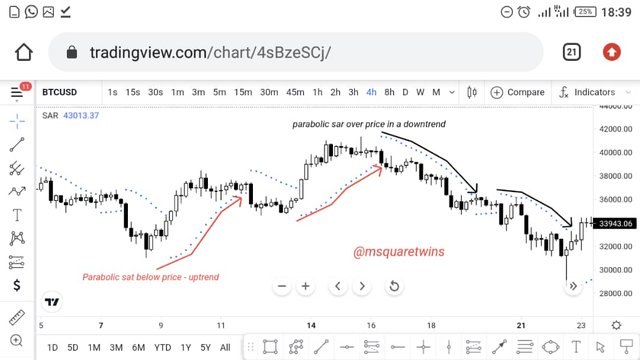
• Then we have Parabolic sar on the chart live and direct.
• The parabolic sar dots below the price indicated by the red cross path is for bullish trend.
• The dots above the price shows the bearish trend and it is indicated by black cross path in the screenshot.
Check the screenshot below to see this amazing indicator.
3. Add the two indicators (Stochastic Oscillator + Parabolic Sar) and simulate a trade in the same trading view, on how a trade would be taken
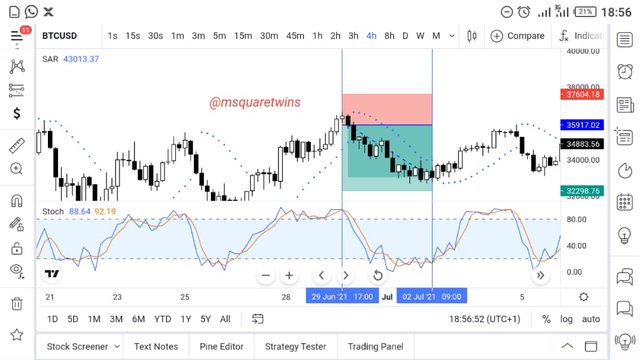
The simulation of the trade i did in the screenshot above is due to the following reasons;
From the screenshot above, the blue line which is %k line crossed the %D line at the overbought region which signified a reversal signal.
Additionally, price cross over the parabolic sar which was initially moving below the price in an uptrend around the same place the two line of oscillator crossed.
The parabolic sar change direction from bullish to bearish.
Hence, the trade order was stimulated.
Conclusion
Both stochastic oscillator and parabolic Indicators are good when combine together. This will help traders to take highest probability trade. From the lecture presented by the respected professor @lenonmc21. I was able to add the two indicators to the chart successfully. Additionally, I was able to simulate a trade on tradingview using the two indicators.
Thank you for reading.
Written by : @msquaretwins
Cc:- @lenonmc21
Nice work bro. But i want to ask whether you used ur phone in drawing the graphs or not
@lukman1, Yes. I used my phone.
If you dont mind, can i have ur whassap number? I want to asked you as to how to go about it using my phone