CryptoAcademy Season 3 Week 7 / Homework Post for Professor @imagen / Fibonacci retracements.

Introduction
Dear Steemians,
I welcome you to another glorious day in the Academy. I am Kehinde Micheal and username @msquaretwins on steemit. I am happy to be part of crypto students for this season and of course for this week. I want to say that the class has been helpful and wonderful. This time, I have attended the lecture presented by professor @imagen on Fibonacci retracements. He has explained the said topic in a very simple and clear way. I will be giving answers to the questions posted in the homework section.
Question 1
Who was Fibonacci? What were your most important contributions in the field of mathematics?
Who was Fibonacci?
Fibonacci was a nickname of a man called Leonardo Pisano who was born in 1170 and died at the age of 80. He is otherwise known as Leonardo Bigollo Pisano. He was born in Italy to Guilielmo of Bonacci family. He was often regarded as the Italian Mathematician. Most of his training was achieved in North Africa, where his father Guilielmo was serving as a Republic of Pisa Merchant at that time. It was in this place Fibonanci learnt the rudiments of mathematics, and as a result of his experience often as he travelled with his fathers he realized importance and advantages of mathematics mostly used around the world.
In 1200, Fibonacci wrote most of the rules of mathematics or mathematical equations as text and symbols while staying at Pisa at that time.
Fibonacci Contribution in the Field of Mathematics
Fibonacci made significant contribution in geometry. Most of the formulae used in geometry was postulated and developed by Fibonacci. One of this is the formula used to calculate the height by using similar triangle rule. Another contribution by Fibonacci is the formulae for calculating shapes like pentagon, decagon.
Moreso, he introduced decimal number system. This came out to the world in one of his book where he explained the steps involved in the elementary equation of addition, subtraction, multiplication and division.
Additionally, Fibonacci was an agent that caused wide spread of the use of Roman numerals. He also explained the use of Arithmetics equation in mathematics. His most notable work is the introduction of Fibonacci sequence and number, which is a series of number used to solve problem in mathematics and this numbers when divided gives Fibonacci ratio which are used in trading.
Question 2
Describe in depth the Golden Ratio. How is it obtained? Where is it located? Give examples of your application through history.
Before we discuss golden ratio of Fibonacci, it is important to discuss what Fibonacci sequence is. Fibonacci sequence is a series of numbers gotten by adding the previous two number in the sequence. For instance; 0, 1, 1, 2, 3, 5, 8, 13, 21, 34, 55, 89, 144, 233, 377, 610, 987, 1048, 2035 etc. Note that the addition of the two previous number give the next number in the series.
E.g 5 is gotten by adding 2+ 3, 8 is gotten by adding 3+5, 144 is gotten by adding 55+ 89 etc.
By dividing the sequence above with one another, we can get the fibonancci ratio that are used in both retracement and extension level.
• Let Divide a number in the sequence by its preceding number. The result will be 0.618 or 61.8%
e.g 21/13 = 61.8%
• Let also Divide a number in the sequence by the next two preceding. The result will be 0.382 or 38.2%
E.g 89 /233 = 0 38.2%
• Also Divide a number in the sequence by the next three preceding number. The result will be 0.236
E.g 13/55 = 0.236 or 23.6%
These ratios, 0, 0.236, 0.382, 0.618, 0.786 and 1 are calles fibonancci ratio.
In percentage the ratios becomes 0%, 23.6%, 38.2%, 61.8%, 78.6%, 100%
Golden ratio is a relation that is used i mathematics that creates balance. It is otherwise known as golden mean or golden section. This number is approximately equal to 1.618 and it can be gotten from Fibonacci sequence.
Also, to get golden ratio, Let then try to divide the sequence like this;
1/1 = 1, 2/1 = 2 ; 3/2 = 1.5; 5/3 = 1.66; 8/5 =1.6, 13/8= 1.625 ; 21/13 =1.615, 34/21 = 1.618
The result of division make thus sequence 1, 2, 1.5, 1.666, 1.6, 1.625, 1.62, 1.619…, 1.617, 1.618, 1.6179…
From the result above, we keep getting around 1.618.. Therefore the golden ratio is 1.618
Golden ratio could be seen in many nature. It is located in the flower petal. One notable example is the lily which has 3 petal and so on. Each one is approximately 1.618.
Another place it is found is in the seed head, e.g maize. If you check the head of a corn, you will notice the occurrence of this golden ratio. It is also found in fruit and vegetable. The way branches are formed are similar to golden ratio formation. More so, this can also be found in human body like hands finger etc. Reference Article
Question 3
Describe how Fibonacci is used in Tradigviews. Show screenshots
• The first thing to do is to go to Tradingview website, go to TradingView
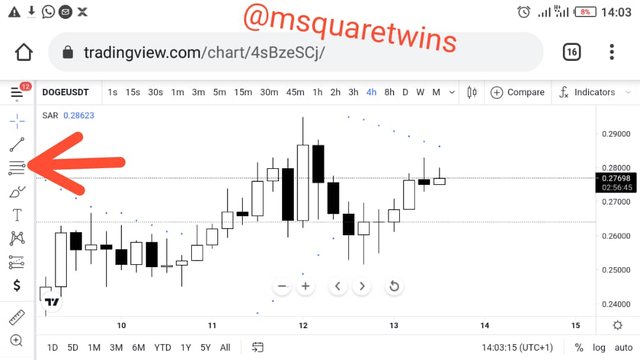
• The click the left icon at the top of the home page as indicated by a red circled in the screenshot below. Then click chart to launch the chart area.

• Then a chart will appear for you.
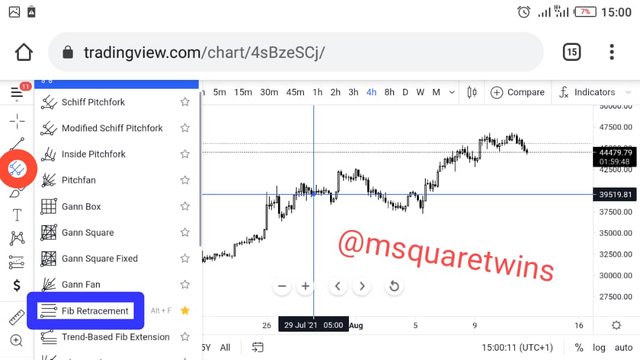
• To draw Fibonacci, kindly go to the chart tool by the left side of the chart, and click an icon like fork, this icon is indicated by a red circle.
• Then a pop list will appear, from the pop up, locate Fib retracements and click it. This is indicated by a blue circle in the screenshot below.
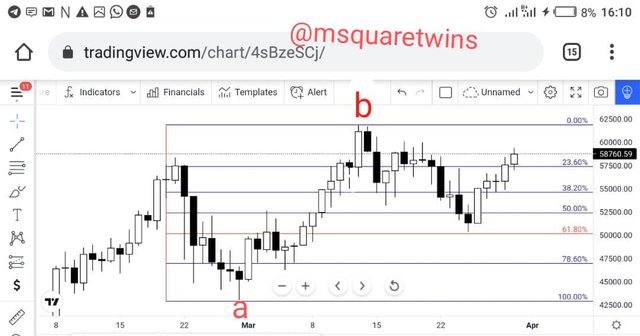
• Let's us draw Fib retracement for a bullish Market. Fib retracement for a bullish market is drawn from low to the high of the bullish leg being considered. The point indicated by "a" in the screenshot is the low of the bullish leg and the point indicated by "b" is the high of that bullish run. The 100% of the Fib retracement is placed on the low and the 0% is placed on the high.
Let's see this in a screenshot below
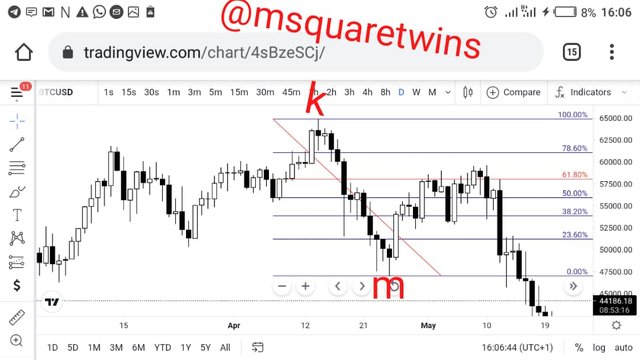
• For Bearish Retracement, the Fib retracement is drawn from the high to the low of the bearish leg in consideration. In the screenshot below, I have market the high of the bearish leg we are considering as point k and the low as point m. The 100% is placed on the high and the low is marked by the 0% of the Fib retracement
Question 4
Make an investment of at least $ 10 (show screenshots). Determine Fibonacci levels in the currency with which you made the investment, with a timeframe of 4 hours for a period of 48 hours. Identify possible support and resistance levels of the selected currency for a period of 24 hours (1 day) after the investment is made. Identify possible support and resistance levels of the selected currency for a period of 48 hours (2 days) after the investment is made. Show screenshots at 24 and 48 hours after the investment made with the Fibonacci levels.
I will be Purchasing Doge coin.
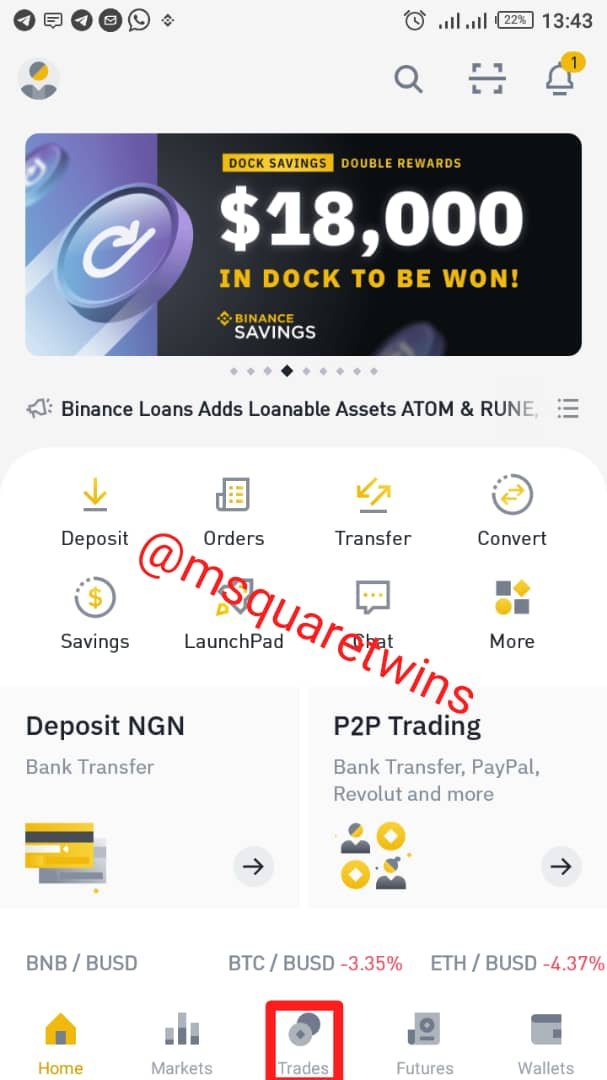
• To do this, Login to binance exchage platform.
• Then from the home page, I clicked trade.
• I want to make the investment by selling USDT for DOGE.
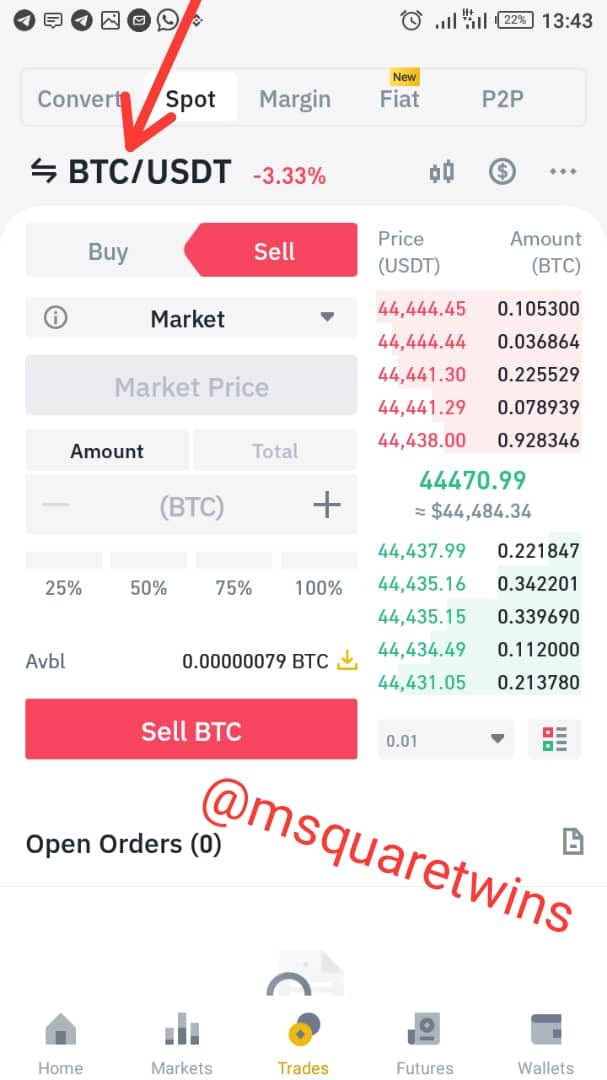
• Then from the pair icon, i Click to change the pair.
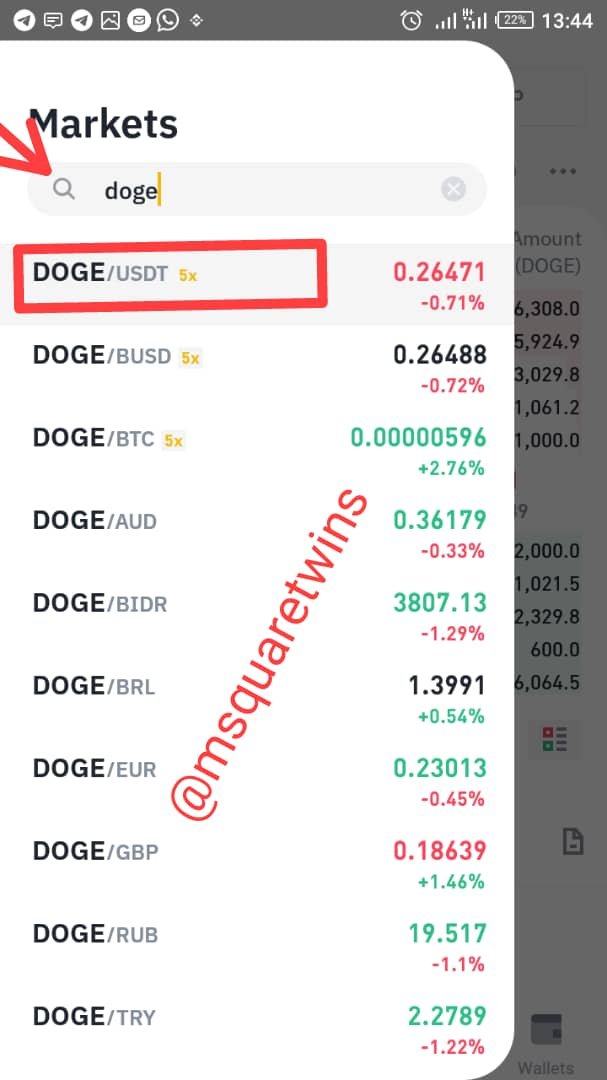
• I searched for DOGE/USDT in the search bar and i selected it.
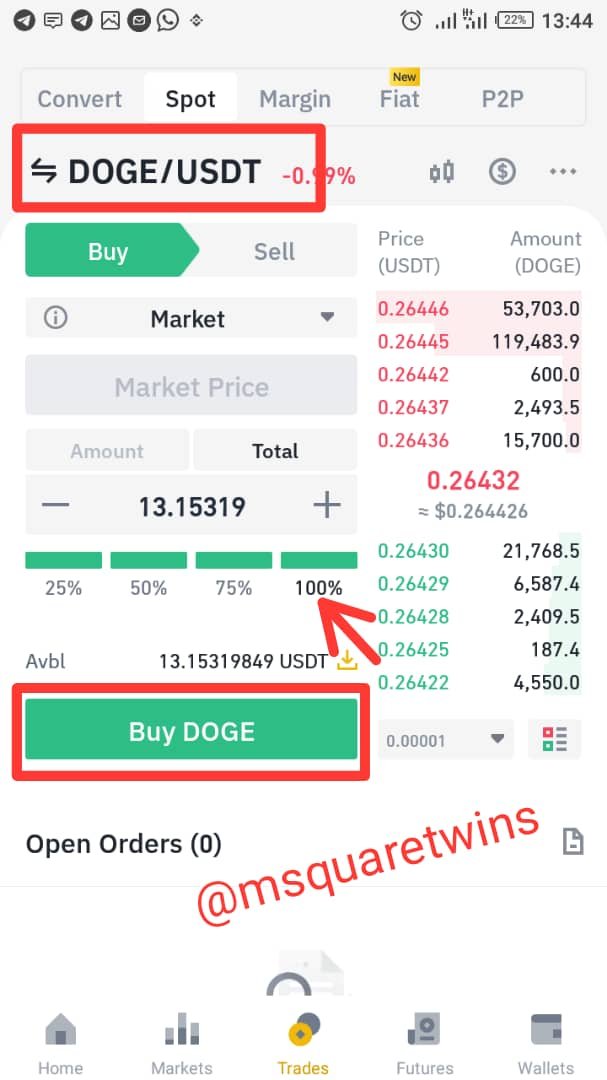
• Then the pair changed the to DOGE/USDT
• I clicked on buy and put amount of USDT I want to sell for DOGE. I selected 100% because I want to sell all my USDT asset.
• Then I clicked buy DOGE at instant market price. Let's the screenshots below
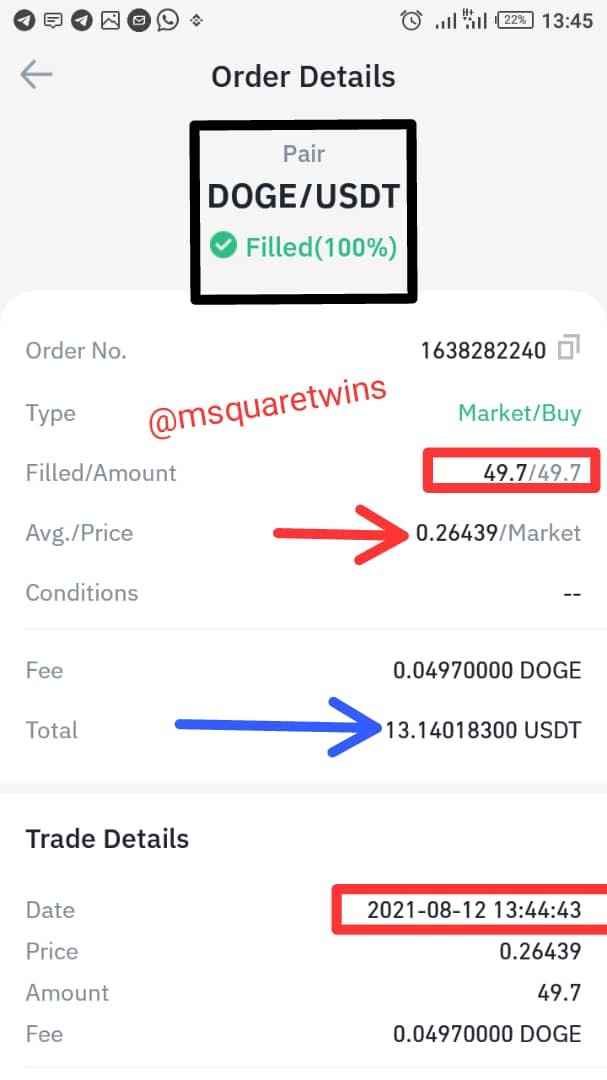
• Then the order was successful at exactly 13:44 pm Nigeria time on the 12th of August 2021.
• A total of 49.7 amount of DOGE was filled at a market price of $0.26439. Let's the screenshot of the order details below
Possible Support and Resistance Level After 24hrs
• I open my chart and selected DOGE/USDT CHART.
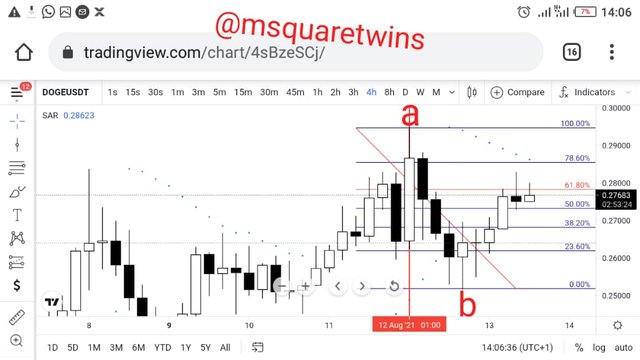
• Then from the chart tool i chose the fib retracement tool as indicated below by a red arrow.
• I then drew my Fib line. The high indicated by letter "a" is the high made around the time I made the investment on 12th of August, 2021.
• The point indicated by letter "b" is the support area as the market retraced from this place.
• The resistance made in this time frame is around 61.8% Fib level as the price is finding it difficult to reach 78.6% fib line. Currently, price is below 61.8% fib line, that shows that that place is possible resistance for this asset.
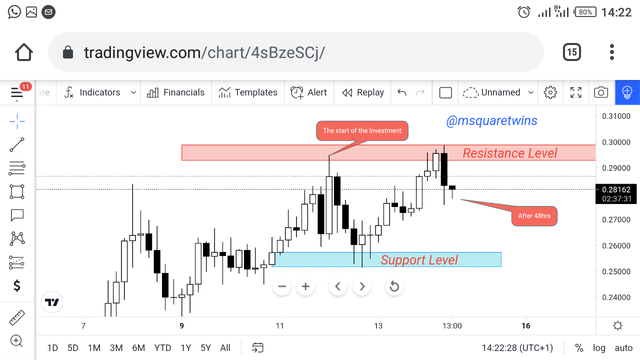
Possible Support and Resistance Level After 48hrs
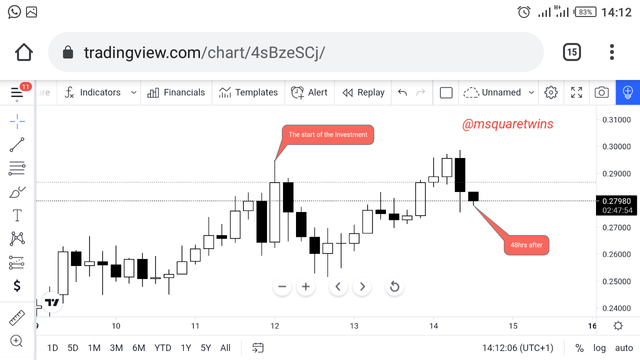
• Again after 48 hours, I logged in to check my asset.
• The place where the price was when I made the investment is called out as "the start of investment " and the place where price is after 48 hours is also called out. Let's check the screenshot below to see that.
• I supported a support zone within 24 hours after the investment. And this support level confluenced to 78.6 to about 80% Fib level as seen in the screenshot below.
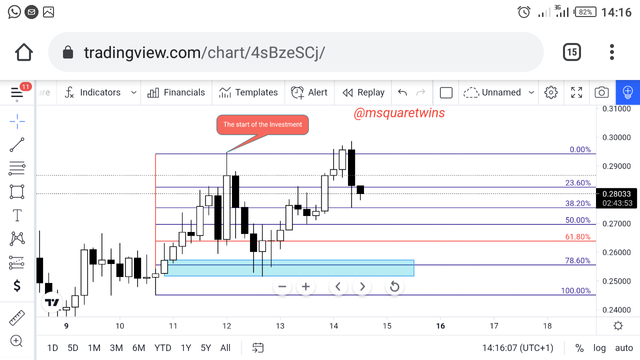
• Then one resistance level was sported around the 44hrs after the investment has been made. Price moved and broke then last high then a retracement of that move began. The price may go up from that zone. Let's check the screenshot below to see both resistance and support sported on DOGE/USDT within this period.
Question 5
What are Fibonacci extensions?
Fibonacci extensions, otherwise called Fibonacci expansion, are tools mainly used by traders to determine profit target. It is also used to know the movement of price after the end of a retracement. Additionally the tool is also used to know probably the point of reversal in market. Unlike Fibonacci retracement, it extend beyond 100%. Most commonly use extension level are, 0.6181, 1. 618, 2, and 2.618, 4.26 etc
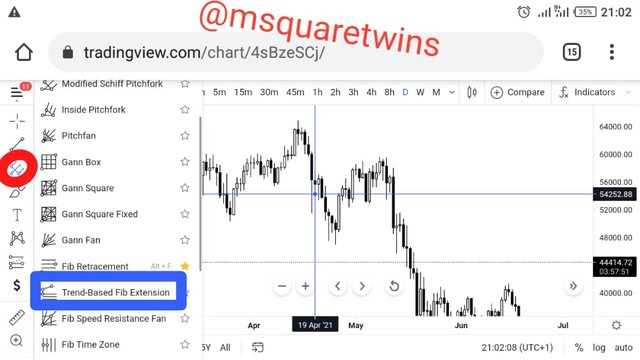
Let's us add Fib extensions to the chart and see how it looks like
• To do this, click a fork-like icon in the chart tool at the left side of the chart. This icon is indicated by a red circle in the screenshot below. Then from the pop up page, click Trend-Base Fib extension
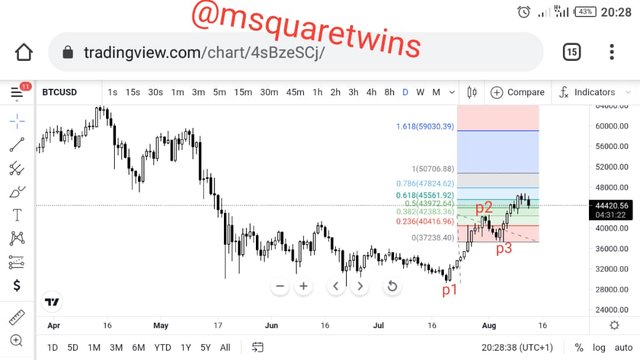
Fibonacci Extensions for bullish move are drawn from the low to the high and then the last point to the retracement the leg made. The p1 in the screenshot below is the low of the bullish move, the p2 is the high and the p3 is the retracement made. Then the extensions level are displayed in the screenshot below.
For Bearish Trend Fibonancci extensions are drawn from the high and the the low and finnaly the retracement of the bearish leg in view. Let's see this in a screenshot below.
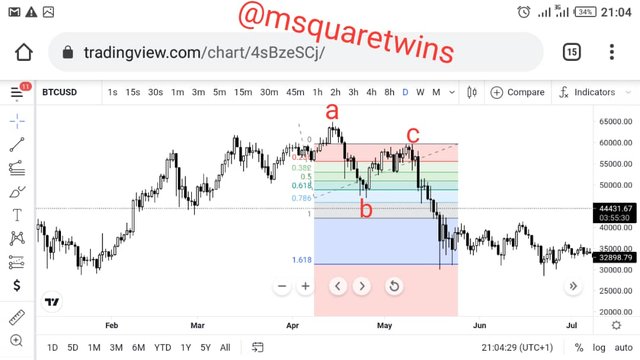
The point "a" in the picture above is the high of the bearish leg which is the first point of the extension line, the point "b" is the low which is the place to put the second point of fib extension and the point "c" is retracement made by the bearish move, and this place is the last point of extension. Then the fib extensions for bearish direction is displayed. From the above picture, it is seen that the price got to 1.618 fib extension before reversal.
Question 6
Conclusions
Fibonacci retracement is one of the tools that is mostly used by traders and investors. Traders who know how to use it with other strategy can predicts the level of retracement for either a bullish or bearish trend. Over time, trader can study and predicts with some accuracy the level of retracement that a trend could possible make before continuing its direction. The certain prediction can come as a result of experience of traders in the usage of this tool.
Another importance of Fibonancci is the use of extension which gives traders the level of extension of price after the end of retracement. The right use the two tools can help traders to know possible area to enter a continuation market and where to exit the trade.
Written by :@msquaretwins
Cc:- @imagen
Gracias por participar en la Tercera Temporada de la Steemit Crypto Academy.
Felicitaciones, realizastes un gran trabajo.
Espero seguir corrigiendo tus asignaciones.
Professor @imagen, Thank you. I hope to paticipate in your next class.