CryptoAcademy Season 3 Week 5 | Homework Post for Professor @lenonmc21 | Trade with "Simple and Exponential Moving Averages" + application of "Fibonacci Retracements


Introduction
Good day everyone,
It is another wonderful time to be posting my homework again in this community. I am Micheal Kehinde with username @msquaretwins here on steemit. I have gone through the powerful lecture presented by professor @lenonmc21 on the topic "Trade with "Simple and Exponential Moving Averages" + application of "Fibonacci Retracements" on the chart". for beginners course Season 3, Week 5. Proffesor @lenonmc21 has done great justice to this topic. Thank you prof. I will be giving answers to the questions asked in the presentation in this post. Let's begin with question one.
Theory (No images)
1. Define in your own words what are simple moving averages and exponential moving averages.
Simple Moving Averages
Simple moving averages are technical tools used by financial analyst to determine the movement of price over a period of time. It is also used to determine the possible trend of an asset. Therefore it is majorly called a trend indicator. And it is represented as a line on a chart. This indicator calculate the average closing price of an asset over a period of time. It is also used to determine the possible support and resistance of an asset.
Exponential Moving Averages
Exponential moving averages are also technical indicator used by trader in finance market. It is like simple moving average but with a little difference. Unlike Simple moving averages, exponential moving average takes into consideration the recent price therefore making it more effective than simple moving averages. It also moves with price well than simple moving average.
2. Explain how simple and exponential moving averages are calculate
Calculation of Simple Moving Average
Simple moving averages are calculated by adding the closing price of an asset over the desired period of time and dividing by the number of days or hours as the case may be.
Let take for example, I want to calculate Simple moving average of asset KLX/PRM for the last 7 days. Let assume the closing price for this asset for the last 7 days are; 23.45, 24.67, 25.00, 23.48, 27.87, 24.65, 26.55. Then the moving average will be,
[23.45 + 24.67 + 25.00 + 23.48 + 27.87 + 24.65 + 26.55.]/7 =24.95
Therefore, the Simple moving average for asset KLX/PRM is 24.95
Calculation of Exponential Moving Average
Exponential moving average is calculated by adding the recent price of market to the previous EMA.
For example, EMA is calculated thus;
EMA = [(price today x weighted average gotten from SMA) + (EMA gotten yesterday.)]
With this we can calculate for EMA.
3. Briefly describe at least 2 ways to use them in our trading operations.
EMA and SMA can be used in market to;
- Determine the trend of an asset. When SMA(Simple Moving Average) and EMA (Exponential Moving Average) meet together on a chart, It is called Golden rule and this can signify a change in the direction of a trend. Traders often add these two indicators to know the end of a move, either bullish or bearish of an asset.
- Know Support and Resistance zone. The use of SMA and EMA can also help traders to know both support and resistance zone. This therefore, can help them in positioning themselves for a good trade.
- Identify market bias. They can also be used to identify the overall market bias of an asset over a period of time.
4. What is the difference between simple moving averages and exponential moving averages (Explain in Detail)
As mentioned earlier, Simple Moving averages don't take into account the recent price movement while exponential moving average does. Also, Simple moving average may be distorted by fake move in market. That's if the simple moving average is calculating for closing price for 10days, and one out of the 10 days happens to be a day when there was a huge spike, fake move in market, simple moving average will still calculate this fake move which may not give accurate answer when put together with the rest of the day. This is the shortcoming that Exponential moving average solves. Therefore, exponential moving averages give accurate average of price and follows price more closely than simple moving average.
5. Define and explain in your own words what "Fibonacci Retracements" are and what their gold ratios are
Fibonacci retracement is a technical tool that is made up of sequence of numbers, which is used to measure or calculate the possible future correction or retracement of an asset after a strong impulse. They are horizontal line that shows possible support and resistance zone. The sequence of fobonancci numbers are gotten by adding the previous two numbers. E.g 0,1, 1, 2, 3, 5, 8, 13, 21, 34, 55, 89...etc These numbers are called Fibonacci sequence. The fibonanci retracement ratio is gotten by dividing the previous number by the next and previous number by the second number to the right of the sequence
For example,
0/1 =0,
1/1
1/2 =0.5
1/3 = 0.333
2/3 = 0.666
3/5 =0.6
3/8= 0.375
5/8 =0.625
5/13= 0.384
8/21 = 0.380
13/34= 0.382
21/55 =0.3
34/89 = 0.617
.etc
Therefore, all this number are called fibonacci retracement ratio.
The correction measured by this Fibonacci tool can be either bullish correction or bearish correction. The bullish correction is measured by using the tool to draw a slope from the swing low to the swing high. 100% of this slope is at the swing low and 0% will be at the swing high. Then the tool will show the different percentage of the fibonacci numbers within this slope. The bearish retracement is the opposite of the bullish. In bearish move, the slope is drawn from the swing high to the swing low.
Having said this, there is golden ratio for fibonacci retracement. And the golden ratio is 0.618 and it is gotten by dividing one fibonacci number by next. I.e 34/55.
Practice (Only Use your own images)
1. shows step by step how to add a "Simple and Exponential Moving Average" to the graph (Only your own screenshots - Nothing taken from the Web).
How to Add Simple Moving Average on Chart
Step 1
Go to https://www.tradingview.com/. From the home page, click the indicator icon as displayed in the screenshot below.

Step 2
Then, a page will be displayed where you will search for moving average. search for Simple Moving average as seen in the screenshot below and click on it to add it to the chart

Step 3
Then we have it on the chart. Let's assume we want to add 50 SMA, we then click the setting option that display when we click on MA to edit it.

Then put 50 and click ok check the screenshot below to see it. That is all for SMA

How to Add Exponential Moving Average on Chart
Step 1
From the home page as describe above, click the indicator icon and search for moving average exponential from the pop up and click on it to add it to the chart.

Step 2
We now have both SM and EMA indicator on chart with the same colour. Now, let's change EMA colour to red colour and set it to 200. Click the setting icon as seen in the screenshot below.

Step 3
Put 200 as seen in the picture below and click style to change the the colour to red. And then click ok

Step 4
Lastly, the two indicator is seen on the chart. The EMA is the red line and the SMA is the blue line. Let's see them in the screenshot below.

2. Use "Fibonacci Retracements" to chart a bullish and bearish move (Own screenshots only - Nothing taken from the web).
To add fibonacci retracement to chart, click fib retracement a seen in the screenshot below.

After the above step, for bullish trend, draw the slope from the swing low to the swing high of the move you want to get retracement for. Check the screenshot below to see this.
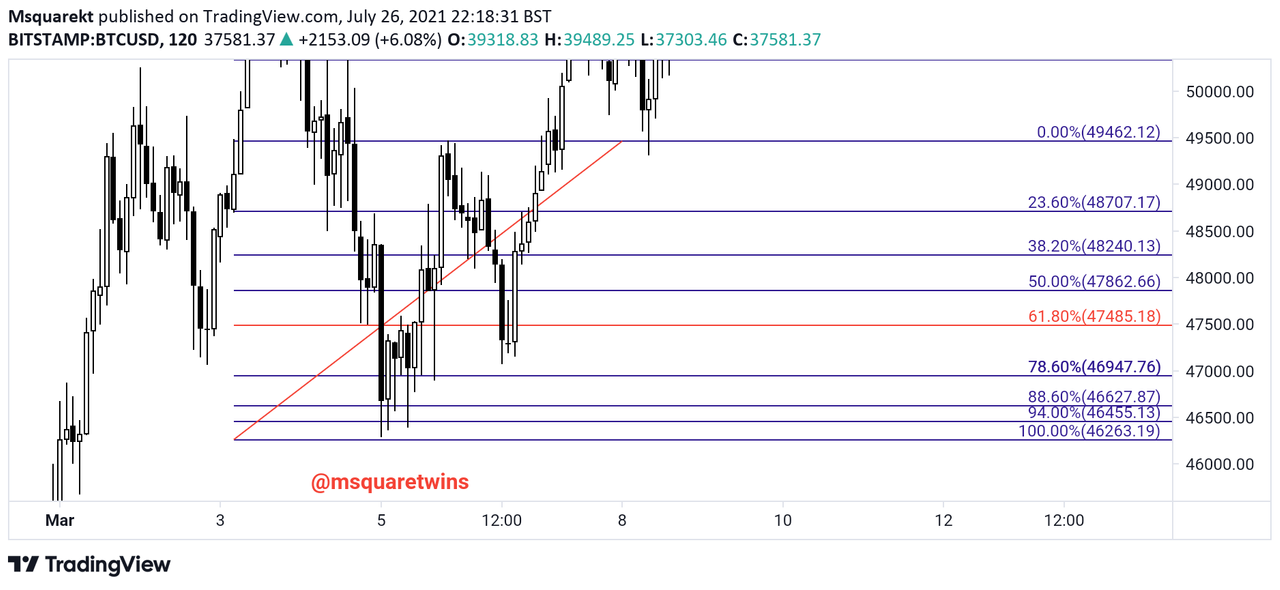
For bearish move, do the opposite of what you did for bullish retracement. Drawthe slope from the swing high to the swing low. The screenshot below gives more details on this.

Conclusion
From the lecture presented by prof @lenonmc21 and from the assignment given, I have gotten the clearer picture of fibonancci retracement, and fibonanci number. Not only that, I was able to add it to the chart. I also learnt the importance of simple and exponential moving average.
Thank you for reading.
Written by: @msquaretwins
Cc:- @lenonmc21