CryptoAcademy Season 3 Week 4| Homework Post for Professor @reminiscence01| Candlestick Patterns

Introduction
Good day everyone,
I am @msquaretwins. I am glad to be submitting my homework post for prof @reminiscence01 on the topic "Candlestick Patterns" for beginners course season 3 week 4. I have gone through the lecture and I must confess that he dealt well on this topic. Thank you prof. @reminiscence01. The answers to the home work questions are presented below.
1. In your own words, explain the psychology behind the formation of the following candlestick patterns
• Bullish engulfing Candlestick pattern
• Doji Candlestick pattern
• The Hammer candlestick pattern
• The morning and evening Star candlestick pattern
Bullish Engulfing Candlestick Pattern
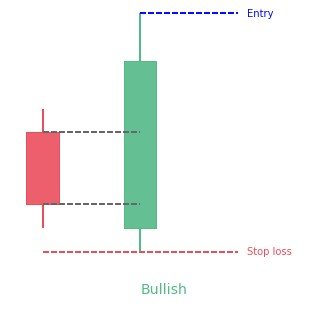
Bullish engulfing candlestick pattern is one of the candle stick pattern used by traders. This pattern occurs mainly at support zone or demand zone. When the market has rallied down for a while and wants to turn bullish, if the last sell is engulfed by the next buy, and the market then reversed and turn bullish. Then the last sell candle and the buy candle that engulfed it is called Bullish Engulfing Candlestick Pattern. This pattern is a reversal pattern, and when it forms in a long downward trend, at a support, the sellers will begin to leave the market while the buyer or bulls begin to take charge of the market. Let's check the screenshot of a bullish engulfing candlestick pattern below
Doji Candlestick Pattern
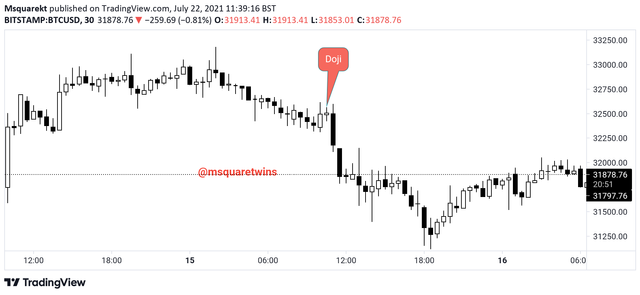
Doji candlestick pattern is another interesting pattern. It is like a positive sign,(+). When this candle stick pattern forms on chart, it signifies indecision in market. At this point the buyers (bulls) and sellers(bears) keep dragging price up and down till the price close at almost equilibrium. It should be noted that both the open and close of a price in Doji candlestick pattern are always almost the same.
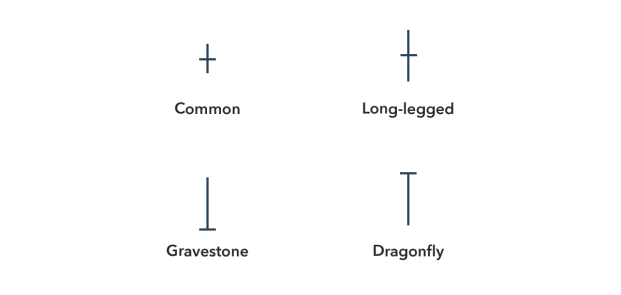
Doji candlestick pattern is of various types. The types are explained below.
• Dragonfly Doji
This type of doji candlestick has long wick or shadow and a small body above this long wick. This shows that the sellers initially drag market downward then the buyer took it and also dragged it up before closing at the upper level of the candle. When this pattern form at a support zone, it may signify reversal or retracement of a trend.
• Graveyard Doji
This is the opposite of Long leg Doji. In this type, the long wick is formed at the top while the snall body is found below. Initially, the buyers dragged price upward, then the sellers came in and took control of the price and move it downward. When this candlestick forms at a resistance level it may signify reversal.
• Long legged Doji
This type of Doji forms perfect Doji. This tupe of Doji has long wicks below and above the small body. In this type, both buyers and sellers keep dragging the market in such that the opening price and closing price close at the equilibrium.
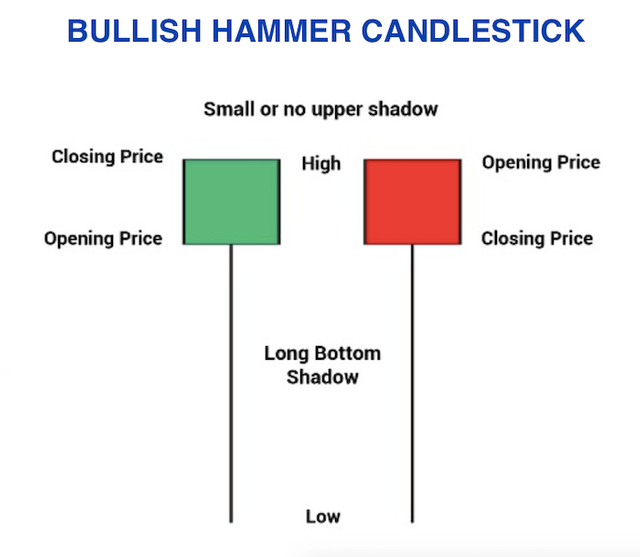
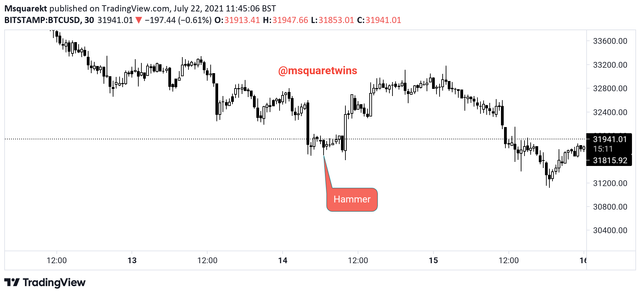
Hammer Candlestick Pattern
Hammer candlestick Pattern is a reversal pattern. It is a bullish reversal pattern. The hammer has a long wick and small body above. It has the low, open and close. The close and high of this candlestick are always the same. When this pattern surface in at the support zone, reversal of the downward trend may come at anytime.
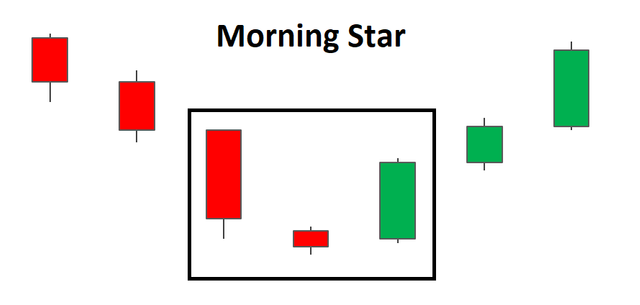
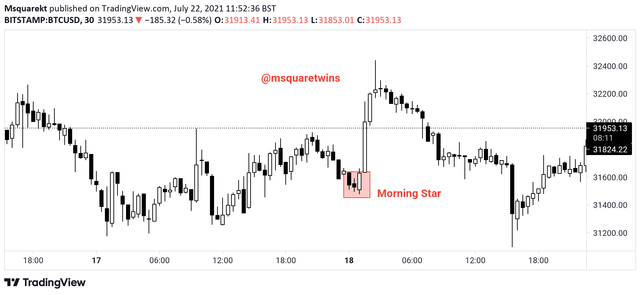
Morning Star
The morning star is also a reversal pattern. It is a bullish reversal pattern that always occur at a support level. This pattern is made up of three candles. The first one is a strong bearish candle, the second one is any indecision candle like doji and the third candle is bullish candle that totally engulf the second candle. Check the screenshot of this below.
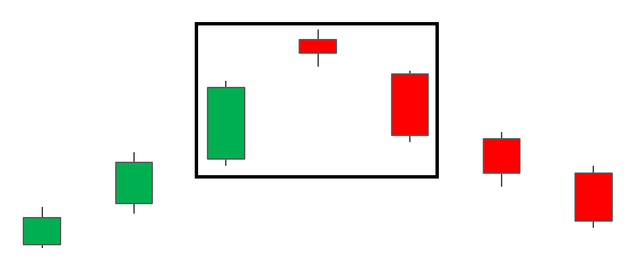
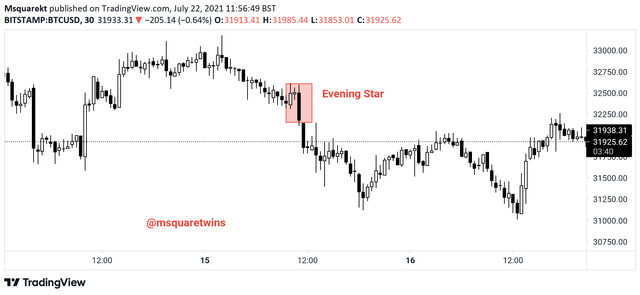
Evening Star
Evening star candlestick pattern is a direct opposite of morning star. It is a bearish reversal pattern. And it always form at the resistance zone. Like morning star, it consist of three candles. The first is the strong bullish candle, follow by indecision candle in the middle and then a bearish candle that must engulf the indecision candle.
2. Identify these candlestick patterns listed in question one on any cryptocurrency pair chart and explain how price reacted after the formation. (Screenshot your own chart for this exercise)
Identification of Bullish Engulfing Candlestick Pattern on Chart
Identification of Doji Candlestick Pattern on Chart
Identification of Hammer Candlestick Pattern on Chart
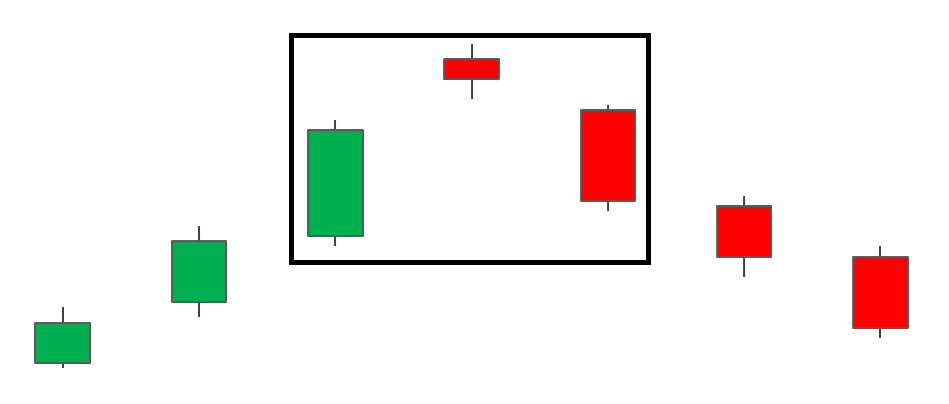
Identification of Morning Star Candlestick Pattern on Chart
Identification of Evening Star Candlestick Pattern on Chart
3. Using a demo account, open a trade using any of the Candlestick pattern on any cryptocurrency pair. You can use a lower timeframe for this exercise.(Screenshot your own chart for this exercise).
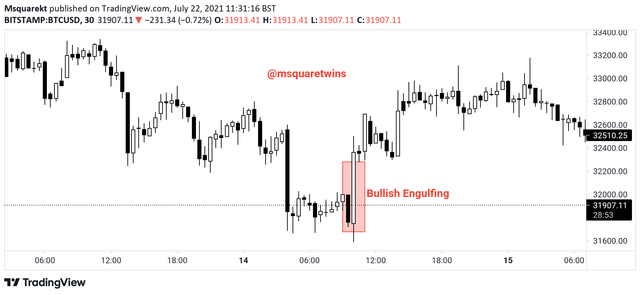
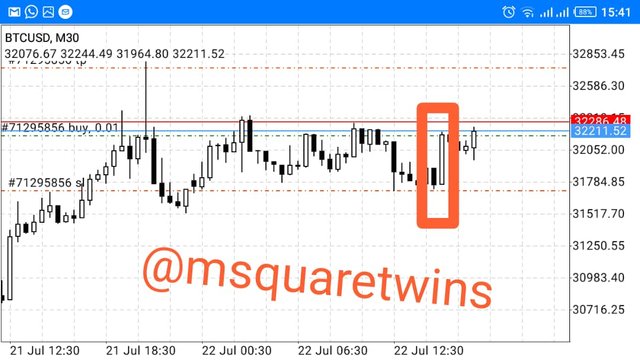
A bullish engulfing candlestick pattern was spotted on a 30mins TF, BTCUSD chart. I then capitalized on this to take my trade. Stop loss (SL) was placed below the low of the engulfing candle. Take profit(TP) was placed above the previous swing high. Let's see the screenshot below.
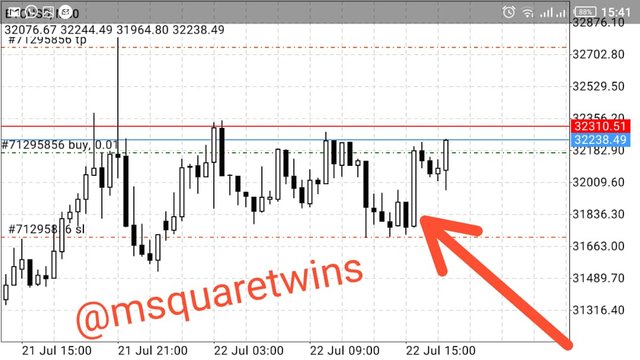
Below is the screenshot showing the bullish engulfing candlestick pattern described above.
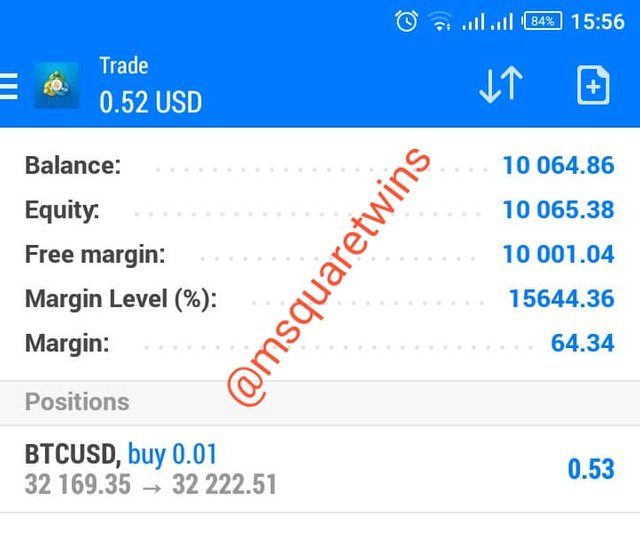
Let's see the result of the trade took based on the engulfing candlestick pattern on BTCUSD spotted on 30mins Timeframe in a screenshot below.
Conclusion
From the lecture presented by prof. @reminiscence01 and my research on the homework given, I was able to understand the importance of candlestick patterns on chart. Candlestick patterns help the traders to identify support or resistance zone. Not only this, patterns also help traders to relate with the past and current price of an asset or commodity which in turns help in predicting the future price of the asset. Another important fact to know is that pattern can help in the prediction of next move of and asset when combined with some tools. If these patterns are so important that they can help in determining the next move of price, it is therefore advisable for every trader to learn how to use them to their advantage.
Thank you for reading
Written by: @msquaretwins
Cc:- @reminiscence01
Hello @msquaretwins, I’m glad you participated in the 4th Week of the Beginner’s class at the Steemit Crypto Academy. Your grades in this task are as follows:
Observations:
Candlestick patterns occur anywhere on the chart. But they give accurate reversal or continuation signal when they are formed at support and resistance areas.
Recommendation / Feedback:
I like the way you explained the psychology behind these candlestick patterns with relevants charts. Thank you for submitting a quality content.
@reminiscence01, thank you. All suggestions are noted