Crypto Academy Season 3 Week3, Beginners' Course: All about Trends, Supports and Resistances and simple chart patterns | Homework Post for Professor @lenonmc21
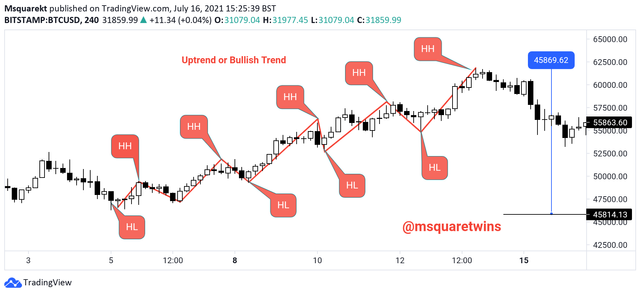 Image Source
INTRODUCTION
Good day everyone,
It is another time to engage in Steemit CryptoAcademy Community. I am Kehinde Micheal with username @msquaretwins here on steemit. I am happy to be writing my homework post for Prof. @lenonmc21 who has done justice to the topic "All about Trends, Supports and Resistances and simple chart patterns" in Beginners' Class for Academy Season 3, Week 3. He really dissected the lecture and explained it in an understandable manner. Thank you, Prof. @lenonmc21. Below are the answers to the question posted in his lectures.

1. DEFINE IN YOUR OWN WORDS WHAT IS A "TREND" AND TREND LINES AND WHAT IS THEIR ROLE IN CHARTS
What is a Trend
A trend is a movement of price in a particular direction either upward, downward or sideways. When price moves in an upward direction direction, it is called uptrend or bullish trend. The downward movement of price is called downtrend or bearish trend. And when a trend has no direction over a particular period of time, then, the market is said to be a ranging which is called sideways trend.
Trend is always generated as a result of volatility in market. And this is usually caused as a result of Whales in market. Whales are the price movers of cryptocurrency. They as well referred to as the big investor of cryptocurrency. It should be noted that trend does not go without retracing. When a trend moves with a great volatility over a period of time, which is usually called impulse, it then retraces to correct itself.
What is Trend lines
Trend lines are lines that is used to indicate the direction of an asset or commodity of a period of time. It also helps the trader to recognize the movement of price over a period of time. Trend lines are drawn by connecting the lows or highs of a trend. In case of a bullish or up trend, the lows are connected. While the highs are connected together in the case of a downtrend. Another importance of trend lines is that it can be used to indicate probable reversal of a commodity when used with other tools. Trend lines it is a tool that is used by almost trader because it is simple to use.
2. EXPLAIN HOW TO DRAW AN UPTREND LINE AND A DOWNTREND LINE (SHOW A SCREENSHOT OF EACH)
Uptrend
In finance trading or financial market, uptrend indicates the series of higher high and higher low. And this is formed when their is upward movement of price or when price moves from a lower price area to a higher price area over a period of time. For example, if a cryptocurrency pair moves from price 45814.26 to 56432.39, it is said to be moving upward. Hence, it is called uptrend. An example of a chart showing uptrend is uploaded below.
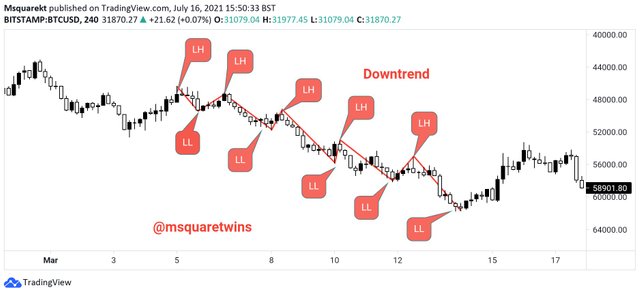
Downtrend
Downtrend is the opposite of uptrend. This is the series of lower high and lower low during the downward movement of price. That is, it is formed when the price of a commodity or an assets moves from higher price level to a lower price level over a period of time. Let's check below to see an example of a downtrend.
Having said this, let's now define uptrend line and downtrend line
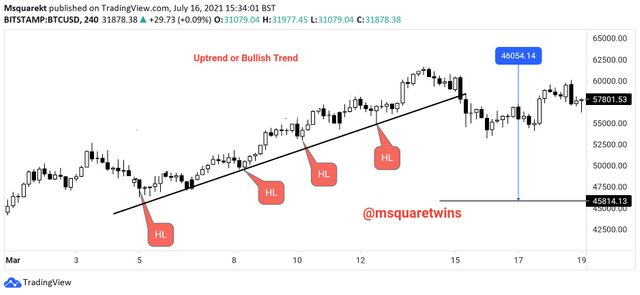
Uptrend Line
Uptrend line is a line connecting series Higher lows in an upward direction. This is done by connecting at least two higher lows (HLs) of a successful uptrend.
A snapshot showing an example of an uptrend line is uploaded below.
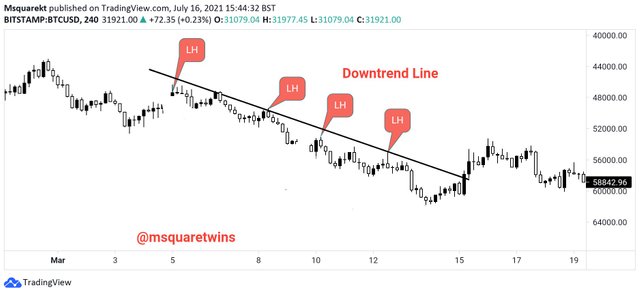
Downtrend Line
This is the opposite of uptrend line. It is a straight line that connect two or more Lower highs of a downtrend.
Below is a snapshot of an example of a downtrend line.
3. DEFINE IN YOUR OWN WORDS WHAT SUPPORTS AND RESISTANCES ARE AND HOW WE CAN IDENTIFY BOTH ZONES (SHOW A SCREENSHOT OF EACH ONE)
Supports
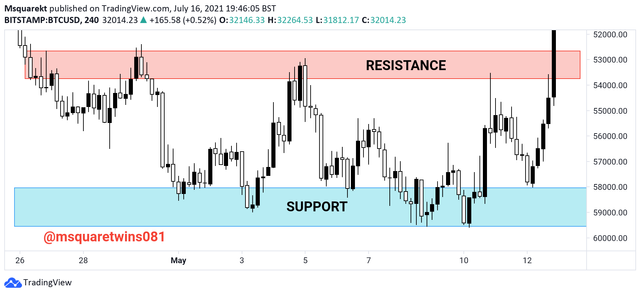
When price has moved over a period of time in a downtrend, it tends to meet with a barrier that stop its move. This barrier is called support support zone. Support zone is an area that push market that has been bearish over time upward. It is an area or zone where the bearish movement reverse and change to the uptrend. This zone or area tends to change the bearish movement of price to a bullish movement.
Below is the screenshot of a chart showing support zone.
Resistance
As opposed to support, resistance is a price area where bullish up move changes to bearish trend or downtrend. In this zone, the buyers are forced to leave the market while the sellers take over. The sellers or bears then move an asset or commodity from this zone downward.
Uploaded below is the screenshot of a resistance zone. The zone is drawn with a red rectangular box
4. EXPLAIN IN YOUR OWN WORDS AT LEAST 2 SIMPLE CHART PATTERNS WITH SCREENSHOTS.
In financial market, there are many simple chart pattern. For this question, I will be discussing double top and double bottom
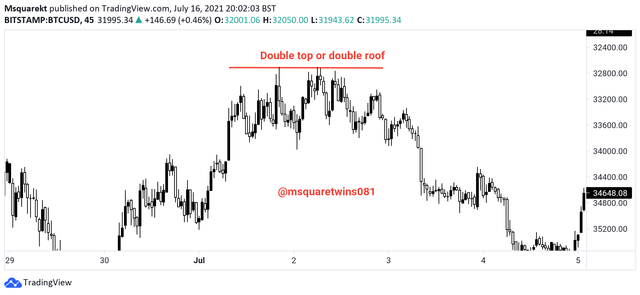
Double Top
This is also called double roof. It is a chart pattern in which price forms equal highs at the same point. This happens to a bullish trend that has reached the peak price and it about to reverse or retrace. After the second high that form double top has been created, if the break the neckline created by the low of the first high, the price then move greatly to the downward direction.
The picture of a double top is uploaded below
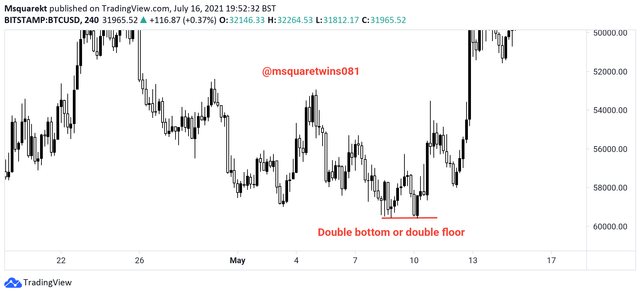
Double Bottom
Double bottom which is also called double floor is a pattern where price forms equal lows. This always occurs when when price has reached discount level and it about to reverse to bullish movement. If price moves and break the neckline that connect the first and the second low, the reversal or retracement or reversal may be massive.
Let's see it in a chat below.
CONCLUSION
In finance trading, the knowledge of trend, trend line and support and resistance can never be overemphasized as they have proven to be key tools in technical analysis. It is no wonder every trader is advice to learn this basic tools in their early stage so as to position them for profitable trading.
Thank you for reading.
Written by: @msquaretwins
Cc:-@lenonmc21