Crypto Academy Season 3 Week 2: Homework Post for Professor @Reminiscence01 | Introduction to Chart


Introduction
Hi everyone,
I am @msquaretwins. I am happy to be submitting my homework on Introduction to Chart. I want to sincerely appreciate Prof @reminiscence01 for the great effort he has put to work in ensuring that every student got a solid understanding on introduction to Chart. I am happy I could go through this subject and understand it. Thank you, Prof.
Below are my view on the questions I was asked to write something about.
QUESTION 1: Explain the Japanese Candlestick Chart? (Chart screenshot required)
Japanese candlestick chart is a collection of different type of candlestick in a chart. It was developed as a way to monitor the movement of price or the distance a price of an asset, stock or commodities move in a specified direction.
There are many types of chart that are used in finance trading. Apart from candlestick chart, some notable ones are: line chart, bar chart, Aikein Ashi, Renko, area chart e.t.c.
The candlestick chart is commonly use among all. It represents the direction of a price at any point in time. This chart is used by trader to do technical analysis. Although it is commonly used with some trading tool to predict the price of an asset or commodity. The good part of this chart is that the past and present happening on the chart can be combined to predict the future price of an asset or commodity.
In addition, the candlesticks is very useful in cryptocurrency trading because it shows the side of the market(buyers or sellers) that are in control of the market, that is the market sentiment at a particular time.
Example of Japanese candlestick is uploaded below. The black candle is a bearish candle while the white candle is a bullish candle.
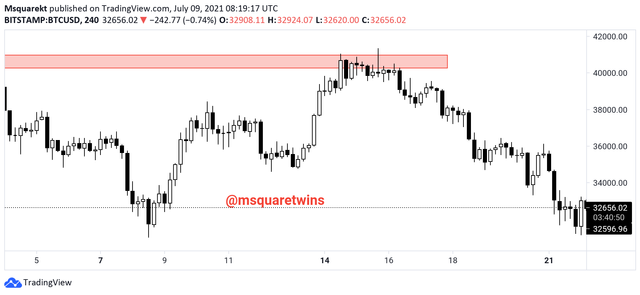
Image Source
QUESTION 2: Describe any other two types of charts? (Screenshot required)
As said earlier, there are various types of chart used in finance trading. Here in addition to Japanese candlestick chart described above, I will be explaining the line and bar chart.
• Line Chart: Line chart is another type of chart that most trader used in finance trading. Line chart is peculiar in it own in the sense that both bullish and bearish move is represented in the same colour. Line chart unlike Japanese candlestick chart where the bullish candle colour is different from bearish candle, has the same colour for both bearish and bullish candle. Although the colour can be change from one colour to the other, but the colour of a bearish candle and bullish candle is the same in line chart. Consequently, this makes this chart difficult to use for many traders.
Similarly to the usefulness of candlestick chart, line chart perform the same function in that it shows the direction or movement of price of an asset or commodity in a specified time.
Below is the snapshot of an example of line chart on 4hour Timeframe for BTCUSD.
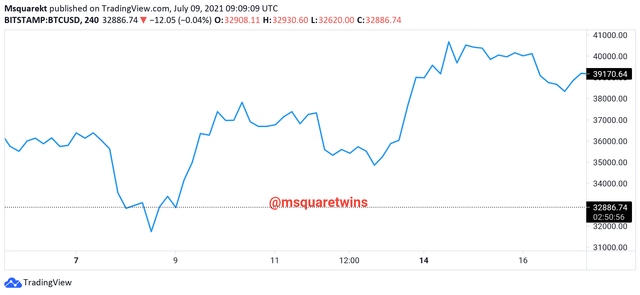
Image Source
• Bar Chart: This is another chart used to ananlyse financial market. This chart is a bit similar to candlestick chart. Each bar, like candlestick has open, closed, high and low. But this chart is different from candlestick in that the bar is intertwined together make it difficult for some traders to use.
Like in candlestick chart, both the bullish and bearish bars in this case can be given different colour. Bar chart is also used to monitor the movement of price within a particular period of time.
Below is the snapshot of a bar chart taken from tradingview.
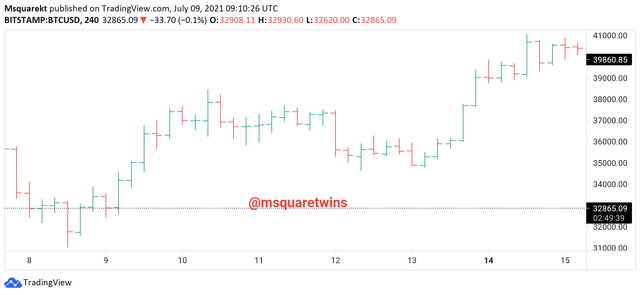
Image Source
QUESTION 3: In your own words, explain why the Japanese Candlestick chart is mostly used by traders.
As discussed earlier, Japanese candlestick is mostly used by traders because of many advantages they see in it. Below are some of the reasons why Japanese Candlestick is mostly used.
1. Availability: What do I mean by availability? Japanese Candlestick knowledge is readily available to many traders. I am a student of foreign exchange market and since I have started learning forex, I hardly see books and materials on bar chart, line chart, area chart etc. in circulation except candlestick books and materials. So I believe people get use to what is available. This may therefore be part of the reason why many traders use candlestick chart.
2. Simplicity: Apart from availability, another thing to note even, merely looking at the chart for each tool is simplicity. Candlestick is easy and simple to use. It makes the analysis simple because there are many things one can see on this chart. Unlike line chart and some other charts, it doesn't hide price or the shadow or fake move of the price.
3. Comprehension: Candlestick chart is easily understood by many traders compared to other type of charts. The interaction of buyers and sellers in a market is not that difficult to know when analysis id done with Japanese candlestick chart.
Therefore, this may be few of the reasons why Japanese Candlestick is mostly used by traders.
QUESTION 4: Describe a bullish candle and a bearish candle identifying its anatomy? (Screenshot is required)
Bullish Candle: In trading, a bullish candle shows the increase in the price of an asset for a period of time. In this candle, the opening price is found below the closing price which indicate the increase in price of a commodity or an asset. The low in this candle is the lowest low a price reaches and the high is the high a price reach before closing
Example of a bullish candle is uploaded below.
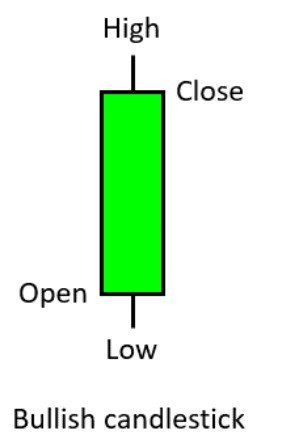
Image Source
In financial market or finance trading, when the bullish candle keeps on forming continuously over a period of time, it becomes a trend which is known as uptrend or bullish trend.
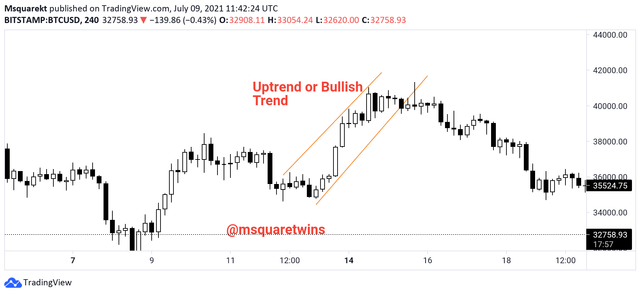
Image Source
Bearish Candle: A bearish candle is the opposite of a bullish candle. The opening price of this candle is found above the closing price which indicates that the price of a commodity is decreasing. The low in this candle shows the lowest price recorded within in this candle while the high shows the highest high a price moves in this candle.
Below is the screenshot explaining the bearish candle.
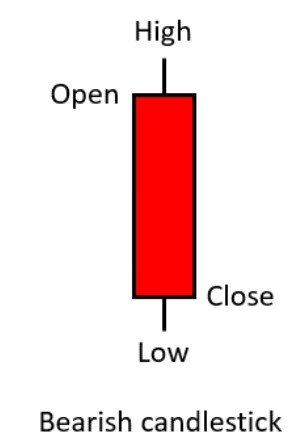
Image source
Continuous formation of a bearish candle in a chart gives rise to downtrend or bearish trend.
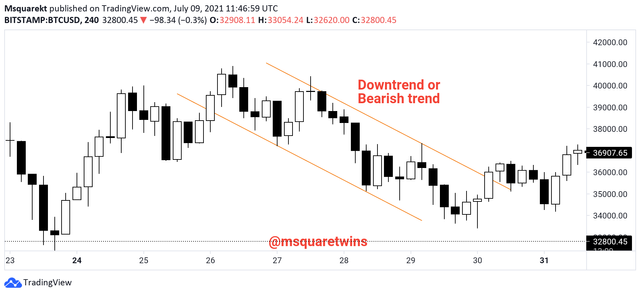
Image source
Having said this, let's quickly define open, close, high and low of a candle stick
Open: This is the opening of a price in a candlestick. The movement of a price starts from this place.
Close: The close of a candle represent the exact point at which the price closes in a candle.
Low: This is the lowest low the price reaches within a candle at a particular period of time.
High: The high of a candle is the opposite of the low a candle reaches. This is the highest high the price of a commodity reaches within a given candle.
Conclusion
As said above, to really understand finance trading, analysis of chart play a very vital role and it's importance can never be overemphasized. It is therefore recommended for every trader to get a good knowledge on how to use chart for their advantage. Having a good knowledge of chart will not only help them but also but them to be profitable in their trading.
Written by: @msquaretwins
Hello @msquaretwins , I’m glad you participated in the 2nd week of the Beginner’s class at the Steemit Crypto Academy. Your grades in this task are as follows:
Recommendation / Feedback:
Thank you for participating in this homework task.
@Thank you Prof. @reminiscence. I hope to participate in your next lecture.