Basic trading strategy using the Harmonic AB = CD + Fibonacci pattern - Crypto Academy / S4W2 - Homework position for Professor @lenonmc21


Introduction
Dear Steemians,
I welcome you once again to week 2 of season 4 in crypto Academy. I hope you have been enjoying the academy since the commencement of this season. I am Kehinde Micheal and my username is @msquaretwins. I am very happy to be submitting my homework post for Professor @lenonmc21 who have explained extensively on the topic "Basic trading strategy using the Harmonic AB = CD + Fibonacci pattern" in the dynamic beginners' class. In this post I will be answering the questions posted in the homework section of his post. Happy reading!

THEORY
1. Define in your own words what Harmonic Trading is
In finance trading, the movement of price over time forms wave and the waves that occur as a result of continuous movement of price over a period of time later form different patterns in market. Harmonic pattern is one of the patterns that exist in financial market and it is use as a trading strategy.
Harmonic trading is a concept that is used in financial market to represent the trend pattern in market. Harmonic Trading is a price pattern that occur in a chart relating with a Fibonacci retracement number. The concept establishes that trend occurs in a wave to predict the direction of price in market.
Harmonic trading solely rest on Fibonacci retracement numbers. Fibonacci retracement level is used to confirm the authenticity of harmonic trading.
In short, Harmonic Trading means that there will always be repetition of what happen in market. For instance, wave or cycle that occurs in market will repeat itself. Trend will repeat itself overtime again and again.
The concepts says there will be recurrent of movement, cycle, direction etc in market. That is, any movement that price makes in market is subjected to repetition. In that case, we can clearly say that the first impulse at the beginning of a trend will repeat itself after retracement of the first impulse. Anf base on the harmonic trading concept, the second impulse is equivalent or almost equal to the first impulse. Similarly the same is seen in the retracement made. The first retracement is also similar to the second one and the cycle keeps on repeating itself over and over again.
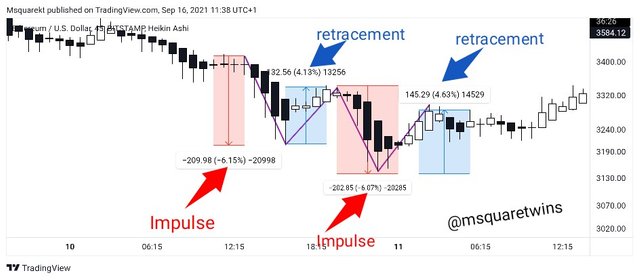
For instance, the screenshot below shows the concept of Harmonic trading. The screenshot below shows a chart of ETHUSD. As seen in the screenshot, the impulse legs are marked with red price range. The first impulse records -6.15% as indicated by a red arrow and the second impulse records -6.07% which is almost the same as first impulse. Similarly, the bearish retracements are marked with blue price range with first retracement reading 4.13% and the second one 4.63%. This shows harmonic phenomenon explained above between impulse legs and retracement leg.

2. Define and Explain what the pattern AB = CD is and how can we identify it?
The Harmonic pattern AB = CD is a pattern used for harmonic trading. It was developed by a technical analysist called H.M. Gartley in 1932. He based his study on raw price action and patterns that form in market recurrently. Harmonic pattern is similar to chart pattern called head and shoulder because they operate on the same price action. Harmonic patter is based on market geometry and Fibonacci retracement level.
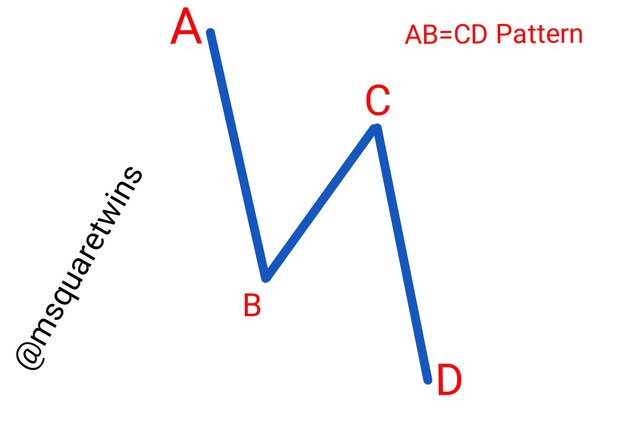
The pattern gets it name from the four movement in market which is called A, B, C and D. The image of this movement is described in the screenshot above. This movement forms what we know as wave in market. Often time, traders enter buy order (long) when price is at discount level and market may rise from this area. Also, when price is at premium level, traders do enter sell order and price may fall from this level.
The good thing about this pattern is that you can see it in any time frame you are working it. Also, it is a pattern that is used in almost all financial market. It is applicable in crypto trading, stock market, forex trading, commodity etc.
Having said this, let me show you how to identify this pattern for both bullish and bearish market.
How to Identify AB = CD Pattern
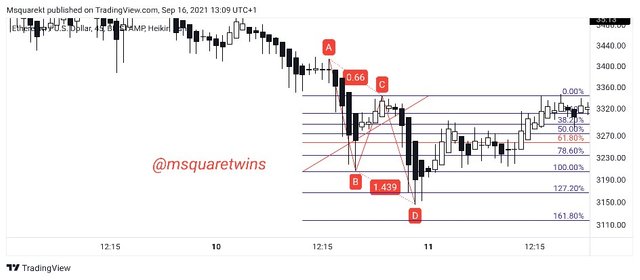
AB = CD -Bullish : To know the next bullish run, you must first identify a bearish market. This shows that the four movement A, B, C and D must be taken when market is falling.
The image below displayed this.
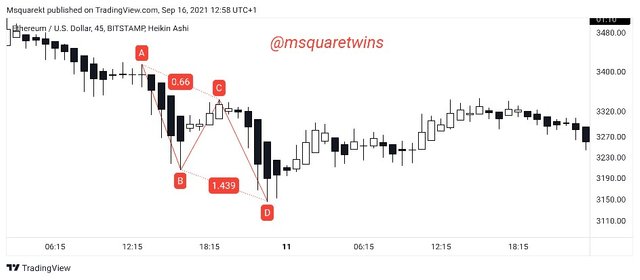
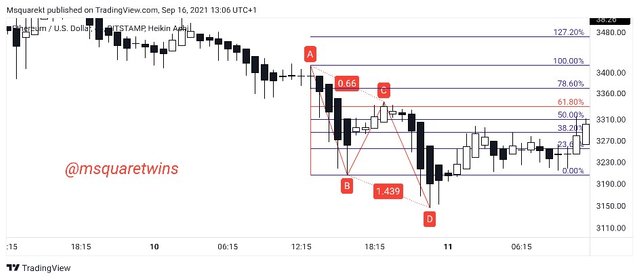
From the picture above, we see that the market is bearish and we have identified the four movement in the direction of the market price. The next thing to do is to determine the validity of this AB = CD Pattern that we have identified. We determine this validity by using Fibonacci retracement levels.
The rule for validity are;
• There must not be any movement that go beyond A and B in the in the movement represented in the screenshot.
• The retracement of leg A and B which is point C must always be below A and must be between 61.8% and 78.6% Fibonacci levels.
• Point D must always be between 127.2% and 161.8% Fibonacci levels.
Let's see the screenshots below for further clarification
AB = CD - Bearish: This is the direct opposite of what we did for bullish. To identify the next bearish movement, we must identify four movement A,B,C,D in the ongoing bullish market. I.e price must be in a bullish trend to identify the the four point.
Let's check the screenshot below to see this.
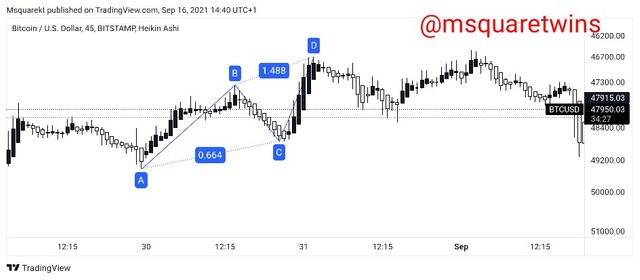
From the picture above, we can see that the trend is bullish and that price is rising. When then identify the four movement in this direction of the trend.
Also we need to determine the validity of this AB = CD Pattern that we have identified by using Fibonacci retracement levels.
The rule for validity are;
• There must not be any movement that go beyond A and B in the in the movement represented in the screenshot.
• Point C must always be below A and must be between 61.8% and 78.6% Fibonacci retracement levels.
• Point D must always be between 127.2% and 161.8% Fibonacci retracement levels.
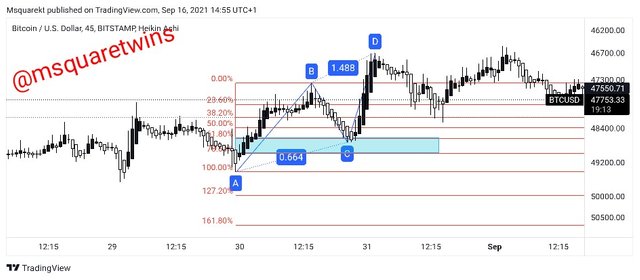
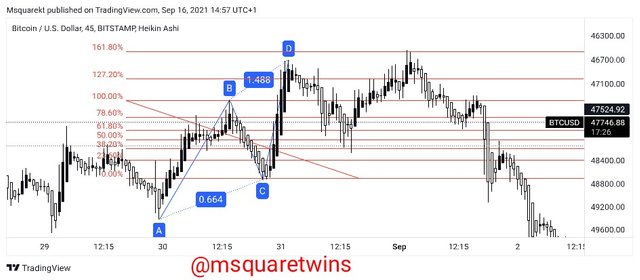

3. Clearly describe the entry and exit criteria for both buying and selling using the AB = CD pattern?
Entry Criteria for Buy
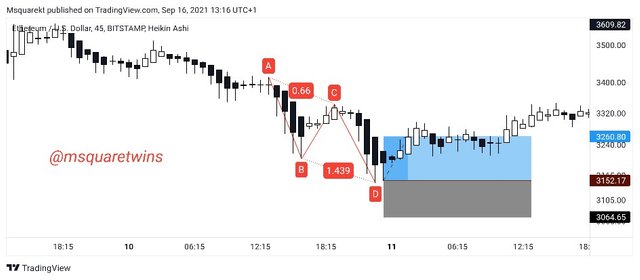
• For buy criteria, the market must be bearish. We then identify the points A, B, C and D. This is the first step we need to do.
• After the identification of the 4 points, we must then validate that C is between 61.8 and 78.6 of the Fibonacci leveland that D is between 127.2% and 161.8% of the Fibonacci retracement level with the help of Fibonacci retracement tool. Otherwise we discard this pattern and look for another one.
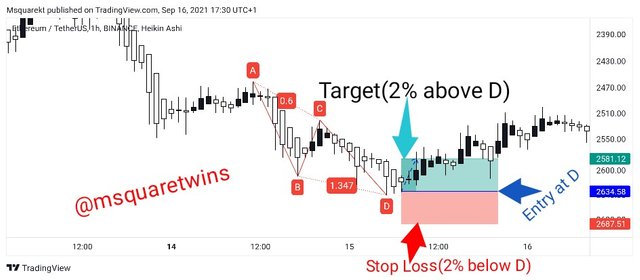
• Then if the above point is in place and the four points have been confirmed with Fib retracement, the entry of a buy order is then initiated immediately after the formation of point D. The stop loss is set at 2% below point D and the target which is TP is set at 2% above point D.
Below is the screenshot of entry criteria for buy.
Entry Criteria for Sell
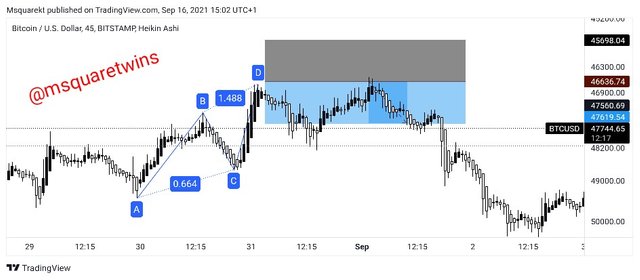
• For sell criteria, the market must be in uptrend. We then identify the points A, B, C and D as in the screenshot below.
• After the identification of the 4 points, we must then validate that C is between 61.8 and 78.6 of the Fibonacci level and that D is between 127.2% and 161.8% of the Fibonacci retracement level by using Fibonacci retracement tool. Otherwise we discard this pattern and look for another one.
• Then if the above point is in place and the four points have been confirmed with Fib retracement, the entry of a sell order is then initiated immediately after the formation of point D. The stop loss is set at 2% below point D and the target which is TP is set at 2% above point D.
Below is the screenshot of entry criteria for sell

PRACTICE
1. Make 2 entries (Up and Down) on any cryptocurrency pair using the AB = CD pattern confirming it with Fibonacci.
Down Entry Using AB = CD Pattern
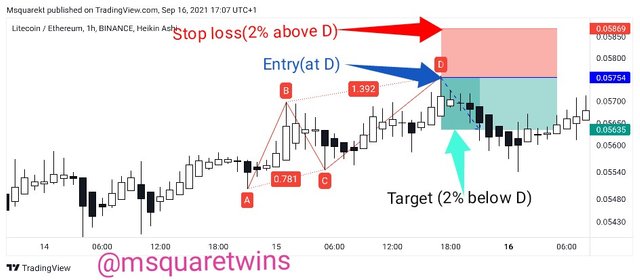
For down entry, we need to identify 4 points that form harmonic pattern which must be in bullish direction. The picture below shows four points I identified in the bullish direction on LTCETH
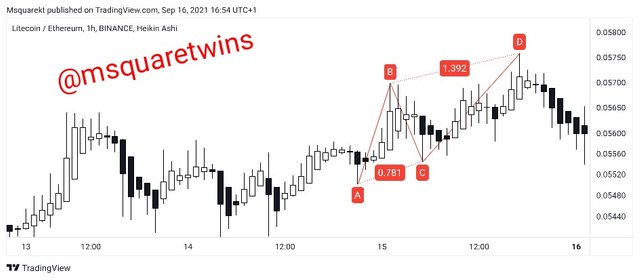
We know that for this to be valid, point C must be lower than point A and it must be between 61.8& and 78.6% Fib level. For this my point C is found between these two levels. Check the screenshot below.
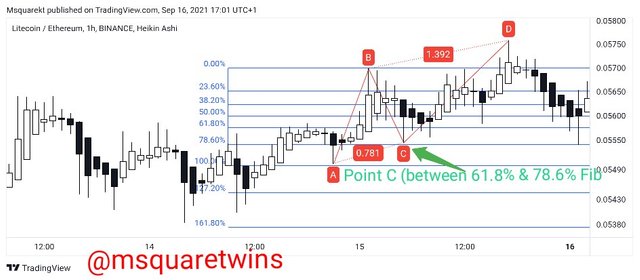
Also, point D must be found between 127.2% and 161.8% of Fibonacci retracement. Also, this is valid for the point D identified. The picture below attest to this fact.
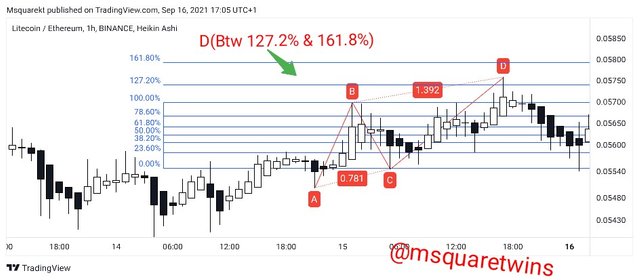
Having confirm the validity of the points, I then placed a sell order at point D. The stop loss was placed at 2% above D and target was set at 2% below D. The screenshot below shows details of this order
Up Entry Using AB = CD Pattern
We know that to have a up entry, the four points of the harmonic pattern must be identified in the bearish trend. So I spotted the points on ETHUSDT chart in the bearish direction as seen in the picture below.
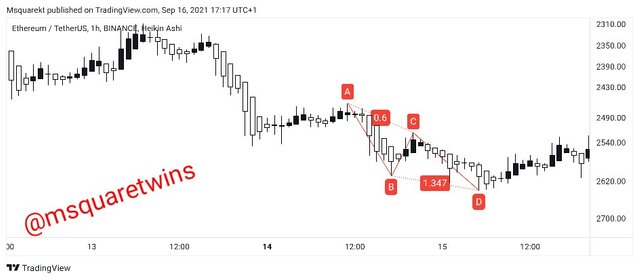
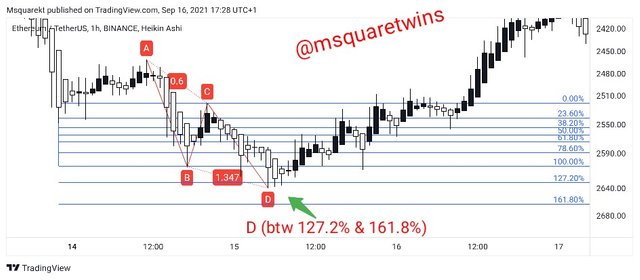
To confirm the validity of the points below, we then use fibonacci retracement tool. Point C must be lower than point A and it must be between 61.8 & and 78.6% Fib level. For this my point C is at 61.8% Fib level. Check the screenshot below.
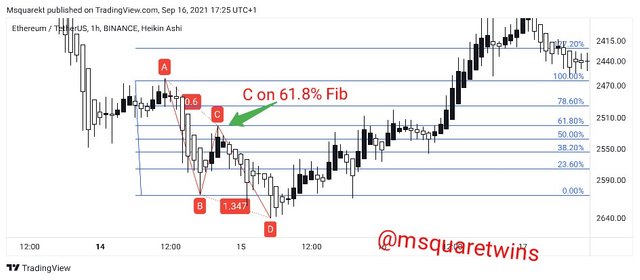
Also, for it to be valid point D must be found between 127.2% and 161.8% Fib level. D is valid for the point selected as seen in the screenshot below.
After the successful confirmation of the points, I placed a buy order at the point D and stop loss was set 2% below point D and target was set at 2% above the point D. Check the screenshot below to see the order analysis.

Conclusion
Through the lecture and the homework given by our able Prof @lenonmc21, I got to understand the Harmonic trading. Not only this I was able to practice what I learn in the class. Special thanks to Prof for this wonderful lecture. It's really great learning new thing in market.
Written by : @msquaretwins
Cc:- lenonmc21