Advanced Technical Analysis Using Fractals ]-Steemit Crypto Academy | S5W8 | Homework Post for @reddileep


Introduction

Hello Crypto Lovers!
I welcome you to this new year. I pray you have a prosperous year ahead. I am Kehinde Micheal and my username is @msquaretwins here on this great platform. I have gone through the lecture presented by Professor @reddileep on "Advanced Technical Analysis Using Fractals" in the advanced class of the steemitcrypto academy. Therefore, in this post, I will be answering the questions posted n the homework section. Happy reading!

1. Define Fractals in your own words.

In trading, price of an asset forms different pattern on chart. These patterns are employed by traders to make good judgement and good market decision. Fractals are also price patterns which occur repetitively on chart either in a bullish direction or bearish direction. Fractals are simply pattern that form over and over again and can be spotted with the use of either bar chart or candlestick chart. It is a price pattern that forms over 5 bar or candles on any time frame in used.
Cryptocurrencies are assets that change continuously and as such, what has happened in market in the past is believe to be capable of happening again, and when this start to be forming from smaller time frame, it is bound to occur in other time frame as well. Hence, the saying "price is fractal". This means, what is seen in higher time frame is a result of development from smaller time frames.
Fractal occur upon five bars or candlestick on chart. This means that for intra day traders that use say 2 hours time frame, it will take 10 hours for it to complete when it occurs on chart of 2 hours. But for a day trader, fractal will occur over 5 days of candles.
The fractal pattern has 5 bars or candles. The number three candle is the middle candle, and it is the highest high or lowest low among the candles for bearish and bullish fractals condition respectively.
The fractal pattern is used by many traders to predict the future movement of price. More so, there are various indicators that are used in the identification of fractals on chart. Most commonly used indicators are; William Fractal indicator, bar pattern, Exponential Moving averages indicator, Fibonacci retracement tools etc.

2. Explain major rules for identifying fractals. (Screenshots required)

Below are the major rules that need to be put into consideration.
In identifying fractal in market, there must be minimum of five bar or candles for correct and accurate identification. Although, the number of candles can be more than give candles at times. However, if the number of candles or bars is less than five, the accuracy of the fractal pattern will be low or may not be considered as fractal at all.
There are two main types of fractals, the bullish fractal and the bearish fractal. The bearish fractal occurs at the end of a bullish move while the bullish fractal occur at the end of a bearish move.
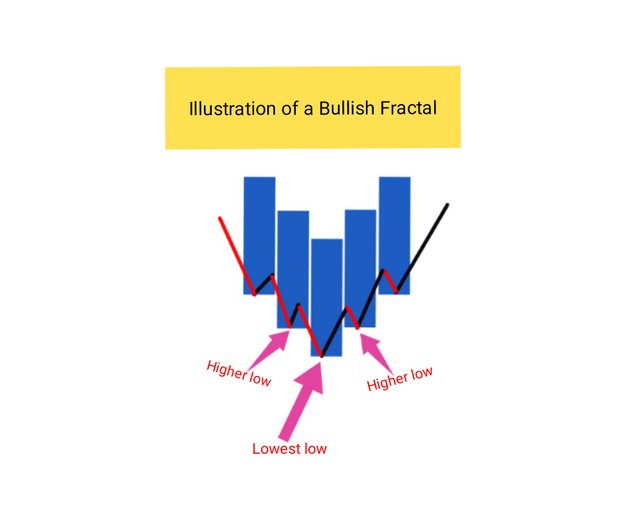
The bullish fractal occur over 5 candles with the candle in the middle of the fractal pattern forming the lowest low and the candle on the sides forming the highest low. The illustration of this is uploaded in a screenshot below.
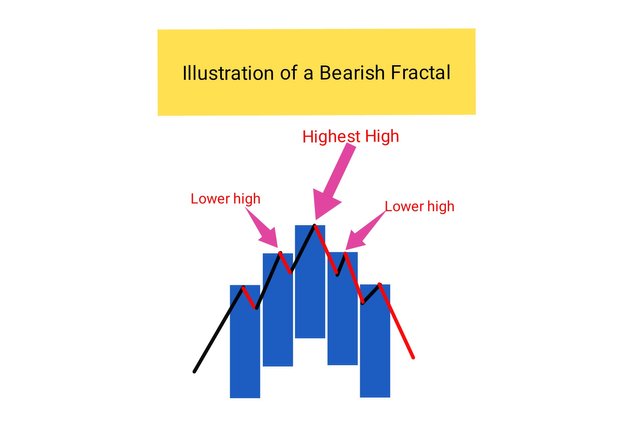
- The bearish fractal occur when the candle in the middle of the fractal forms the highest high and the candles on the sides of the fractal form the lower high. The illustration of this is uploaded in the screenshot below.

3. What are the different Indicators that we can use for identifying Fractals easily? (Screenshots required)

There are many types of indicators that can be used for identifying fractals easily. The most popular indicator for this is William Fractal indicator. Some other indicators that are used are fractal support-resistance, fractal breakout, Fractal Indicator etc.
William Fractal indicator
For this question, I will discuss the William fractal pattern and how it is employed on chart. I will use tradingview.com platform for this illustration with proper or necessary screenshots.
Firstly, Let me explain how to add the William fractal indicator to the chart.
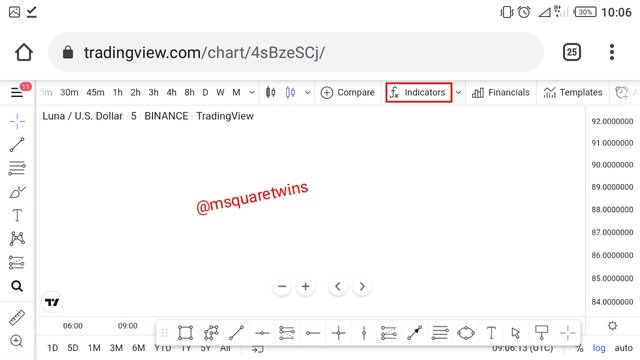
• When you launch your chart on tradingview.com, look for indicator icon at the top of the chart as indicated by a red box in the screenshot below. Then, click it.
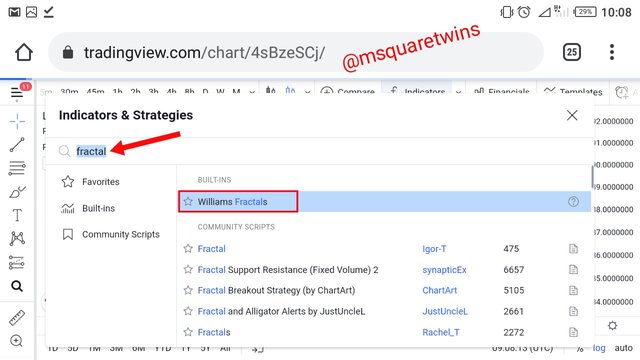
• Then indicator page will appear for you as displayed below. From the search button, search "Fractal" as indicated by a red arrow in the screenshot. Then William fractal will appear as indicated by a red box. Click on it to add it to the chart.
• As you can see from the image uploaded below, William fractal indicator has been added successfully to the chart. It contains series of dot with green and red colour as seen in the image.
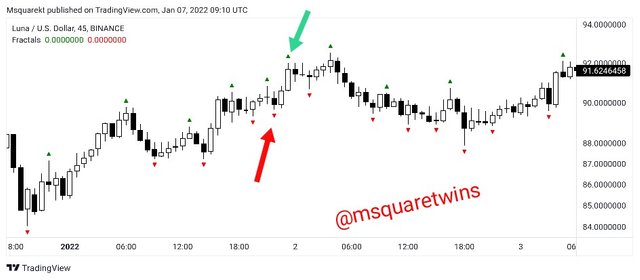
The green arrows are at the top of the candles and the red arrows are at the bottom of the candles. What this means is that the William fractal indicator can be used to detect price reversal on chart. In this case, the green arrow indicate the sell signal while the red arrow indicate the buy signal.
Fractal Support and Resistance Indicator
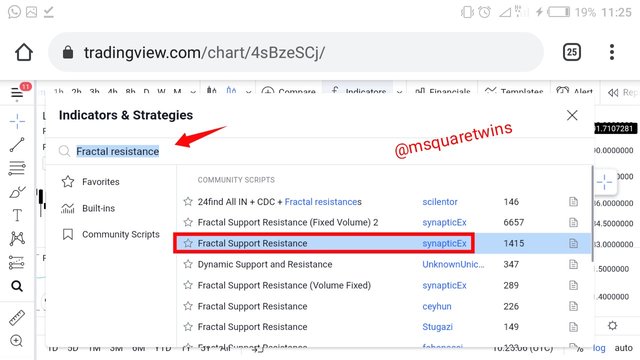
Fractal suppprt and resistance indicator is another indicator that is used to identify fractal especially at the support and resistance zone. To add this indicator to chart, kindly click the indicator icon at the top of the chart on trading view chart platform as indicated in the screenshot, and the search "fractal support and resistance " as indicated by a red arrow in the screenshot. Then click on it as indicated by a red box.
• Then when you click it, it will be added to the chart as displayed below. As we seen below, there are series of dots that form a horizontal lines in the screenshot uploaded below. The green horizontal line is the fractal resistance line while the red horizontal line is the fractal support line.
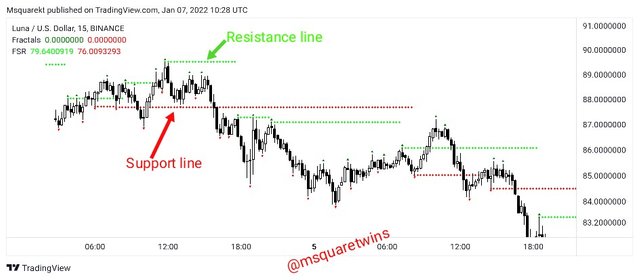
The fractal support and resistance is used to identify support and resistance level. More do, it helps to confirm the forces of supply and demand. This type of indicator can be applied to any market.

4. Graphically explore Fractals through charts. (Screenshots required)

As said earlier, different means can be used to identified fractal on chart. Part of the indicators that are used to identify fractal had already been discussed above. But beyond that, we can use chart to identify fractal by simply looking at the chart. This is done by comparing the past data of price with what price is doing in market. We simply check if the past bearish run or bullish run is the same with the present price pattern on chart.
For instance, the past pattern of price of LUNA/USD on an intra day time frame can be used to find the area of reversal for the current price pattern of this asset.
Follow me closely as I used the trading view platform to explain what I meant by using past data of price to determine the point of reversal for the present chart
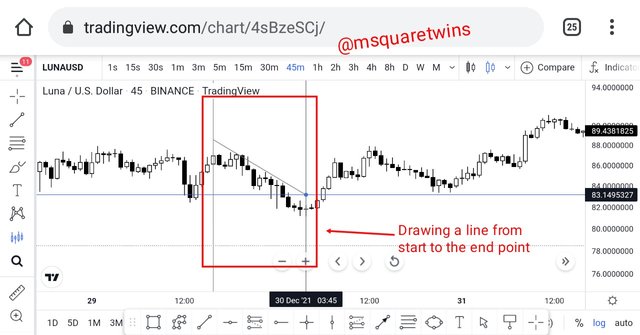
On the trading view chart platform, at the left side of the chart, there is panel that contains all the drawing tools., there is a unique tool called Bar Patterns tool which is indicated by a blue box in the screenshot below. This tool is used for identifying fractal on chart by observation.
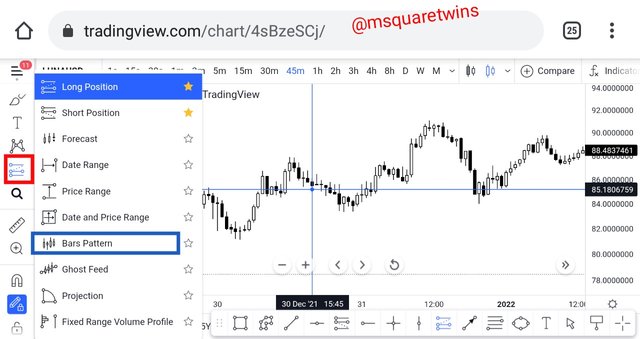
When we click on the bar pattern as indicated in the above screenshot, we will see a tool where will be require to draw from a point to another. As we can see, I drew a line from the left to the right at my desired place as indicated by a red box in the screenshot below.
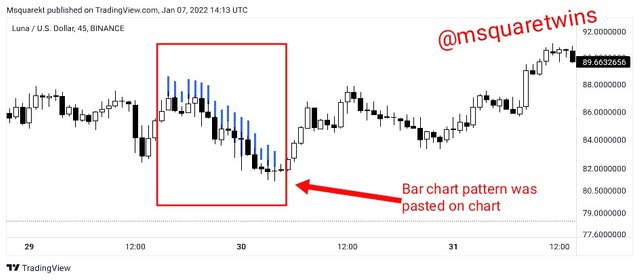
Then the bar pattern, when I finished clicking the second point appeared on chart for me as seen in the image below. It is now a moveable pattern and we can move it for comparison to the present price pattern.
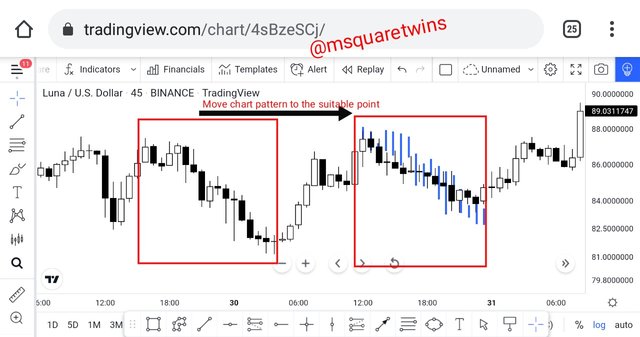
Then I moved the copy-pasted bar pattern on chart to a suitable place as displayed in the screenshot below.
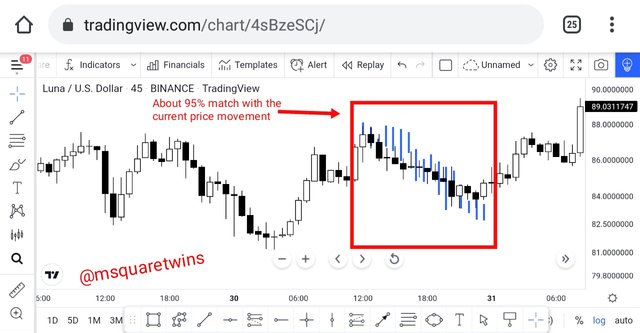
As we can see in the screenshot below, the past price pattern is almost the same with the suitable one used. Therefore, we can use strategy to determine the reversal point of the present trend in market with easy.

5. Do a better Technical Analysis identifying Fractals and make a real purchase of a coin at a suitable entry point. Then sell that purchased coin before the next resistance line. Here you can use any other suitable indicator to find the correct entry point in addition to the fractal. (Usually, You should demonstrate all the relevant details including entry point, exit point, resistance lines, support lines or any other trading pattern)

For this task, I will be doing a technical analysis with a William Fractal indicator together with 20exponnential Moving average(EMA) and 50 EMA. The platform on which this technical analysis will take place is tradingview.com.
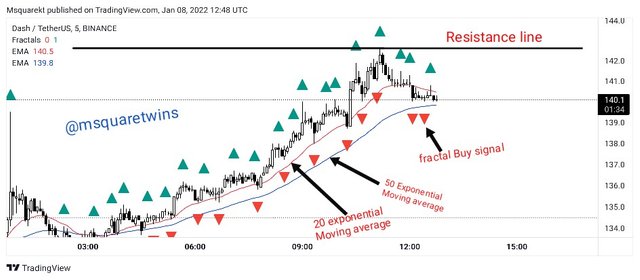
The chart uploaded above is the chart of DASH/USDT on a 5 minutes time frame. The 20EMA is the red line that keep moving along with price as seen in the screenshot. The blue line is the 50 EMA. As seen from, price keep creating series of higher highs and higher lows, and this confirms that the asset is in uptrend. Then at a point, price retraced downward and the 50 EMA acts as support as 20EMA is above the 50EMA. I then took a buy order after the formation of a fractal buy signal as seen in the screenshot.
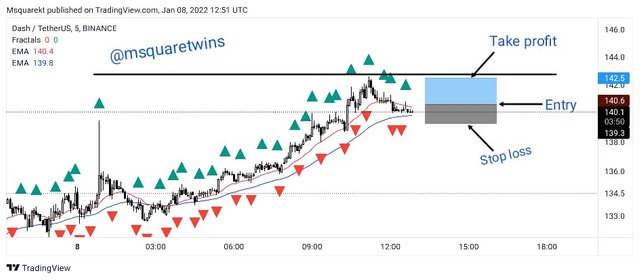
The entry was at $140.6 with a stop loss order slightly below the 50EMA which at the $139.3 The take profit order was placed before the next resistance zone at $142.5
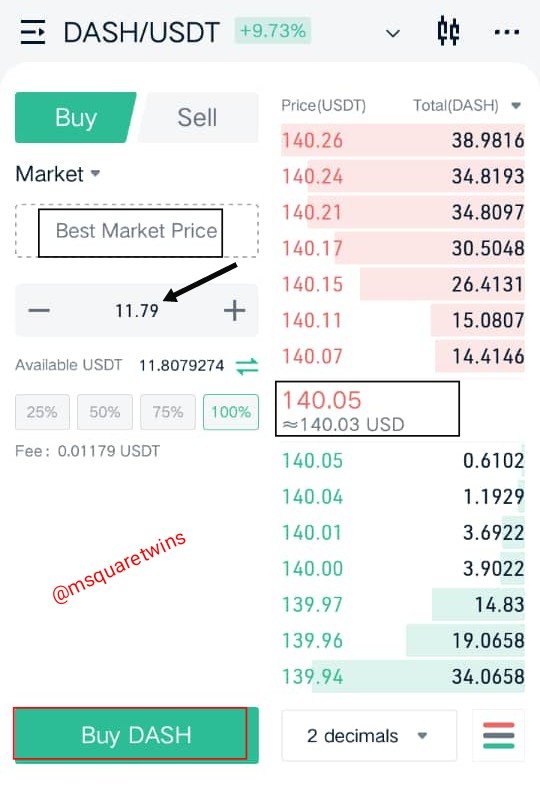
Then I open my Kucoin App to place the order. The order was executed at current market price which is $140.5 as seen in the screenshot above.
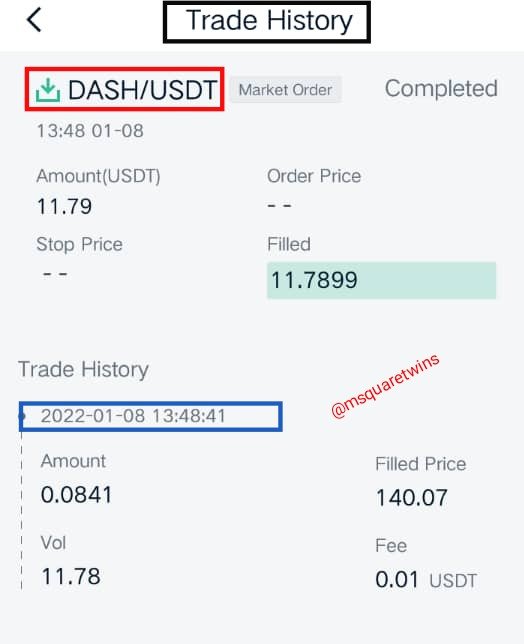
The the order was filled and the screenshot of the tradr history is uploaded above.
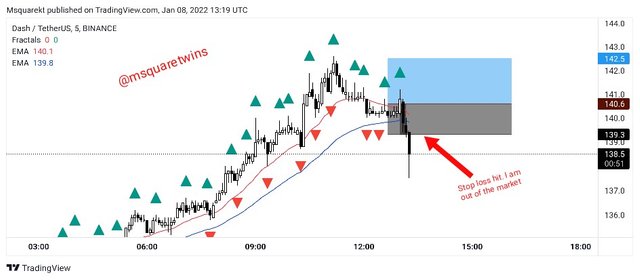
Then after a while, I checked the trade order and I saw that price came back and hit my stop loss. Since this happened like that, it means the order has been invalid.
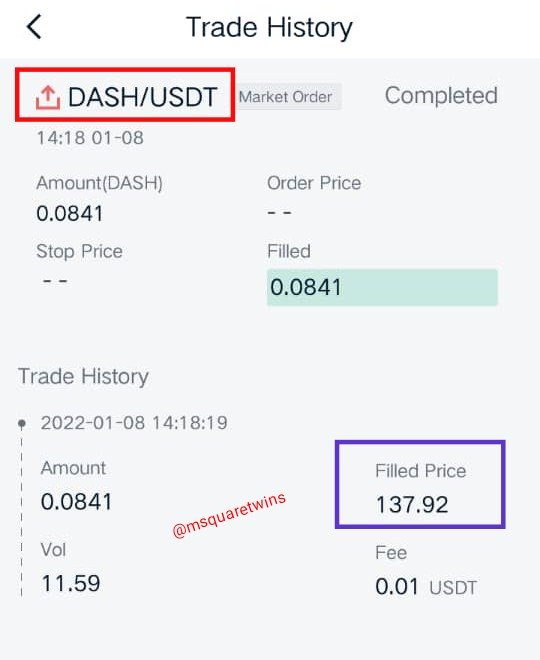
Then I left the market as seen in the screenshot above.

Conclusion

Fractals are a price patterns which occur in manner either in a bullish direction or bearish direction on chart. They are pattern that form over and over again and can be spotted with the use of either bar chart or candlestick chart. I is a price pattern that forms over 5 bar or candles on any time frame in used.
In this post, I have explained my understanding of fractal and the ways to easily identify fractal on a chart was fully explained with necessary screenshot from chart. More so, I explained two indicator that can be used to identify fractal on chart. I also explore fractals on chart by using a popular tool called "bar pattern" to explain possible way of getting present reversal point by using past data of the price of an asset.
Finally, I did a technical analysis of a DASHUST with the help of a fractal indicator along with 20EMA and 50 EMA and the result of the order was displayed. Special thanks to professor @reddileep for this wonderful lecture.
Cc:-@reddileep