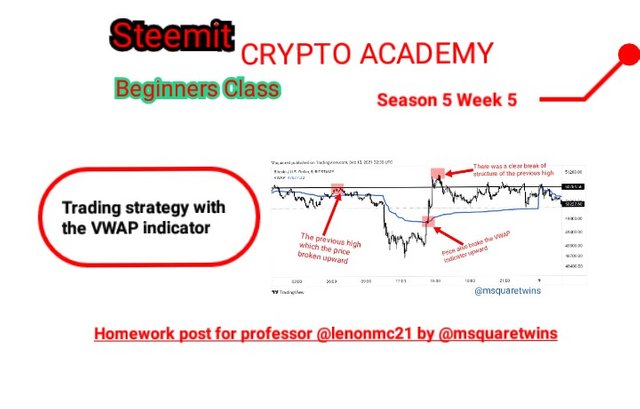
[RPOST] Trading strategy with the VWAP indicator - Crypto Academy/S5W3 - Homework post for @lenonmc21

Introduction
Hello crypto lovers,
It is another great week in the steemit crypto academy. I am Kehinde Micheal and my username is @msquaretwins here on this platform. I have gone through the lecture presented by professor @lenonmc21 on the topic "Trading strategy with the VWAP indicator " in the beginners class. Therefore, in this post, I will be answering the questions posted in the homework section. Happy reading!
THEORY
1. Explain and define in your own words what the “VWAP” indicator is and how it is calculated (Nothing taken from the internet)
VWAP is an acronym of Volume Weighted Average Price. VWAP indicator is one of the great indicator that is used by many traders to take good market decision. It is an indicator that is price and volume dependent and gives the average trading price of an asset a day.
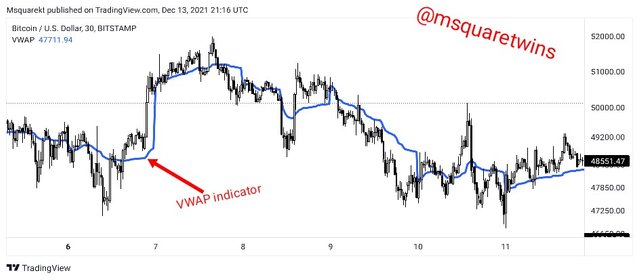
VWAP indicator just like moving average indicator is a single line on a chart that moves along the direction of a price on chart. This means that it helps traders to know the direction of a trend as well as the value of an asset at a particular period of time.
The Volume weighted average price indicator is very unique compared to several other indicators. The unique thing about volume weighted average price indicator is that while many other indicators varies on chart when view in different time frame, it usually maintain its appearance on different timeframe. I.e VWAP indicator does not varies with time frame, this means that in 15minutes time frame, 30mins, 1hr etc, it is the same on chart.
VWAP indicator very similar to moving average indicator but different from Moving average indicator in that VWAP calculate the product of the addition of price and the volume divided by the total volume while moving average indicator calculate the sum of close of price and which is divided by the period under consideration.
How To Calculate the VWAP indicator
There are three important feature of VWAP indicator. And this features are part of the name Volume Weighted Average Price.
These features that VWAP put into consideration in its calculation are;
- Price
- Volume of money that's traded.
- Numbers of candles in a day
Now, VWAP indicator is calculated by adding the price traded over a certain period of time and the volume of the asset traded and then divide it by the number of daily candles.
Mathematically,
- VWAP = (Price + Volume of asset traded)/Number of daily candle
2. Explain in your own words how the “Strategy with the VWAP indicator should be applied correctly (Show at least 2 examples of possible inputs with the indicator, only own charts)?
In this question, I will explain how to correctly execute VWAP indicator strategy on chart. Nut before that, let's me first explain how to add VWAP indicator on the trading view chart.
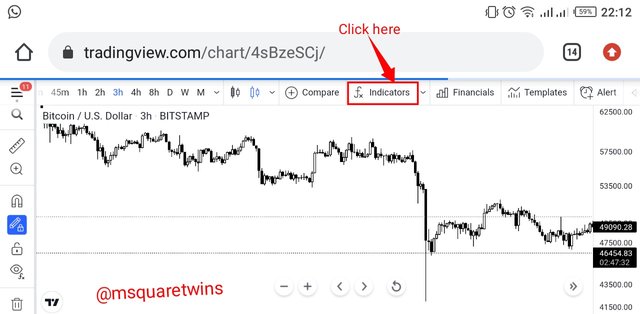
• Go to www.trading.com and launch chart. From the top of the chart, locate indicator icon and click it as indicated by a red box in the screenshot.
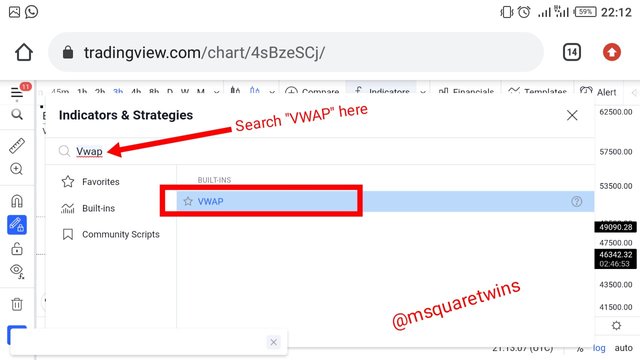
• Then, Indicator page will appear for you. From there type "VWAP" and search it, it will display for you as seen in the screenshot below. Click it to add it to the chart.
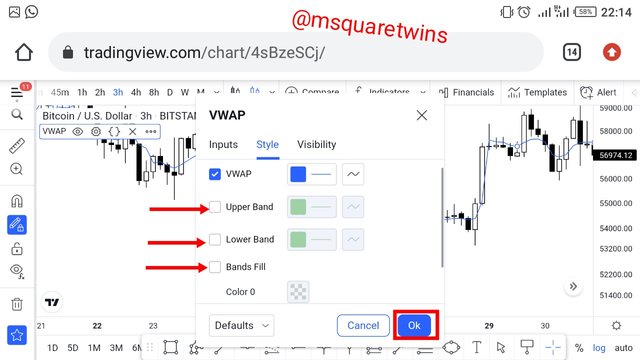
• Then, click on the indicator, and locate edit button to edit the indicator. From the indicator configuration unmarked the options "Upper Band", "Lower Band" and "Bands Fill" and then click on "accept" to effect the changes.
• Lastly, click the line of the "VWAP" and select the largest thickness for it and click on "accept." With all put in place, the indicator will be ready to use.
Guidelines to follow for Correct execution of VWAP strategy.
To correctly use the strategy with the VWAP indicator, there are some steps to follow. These steps are listed and explain below.
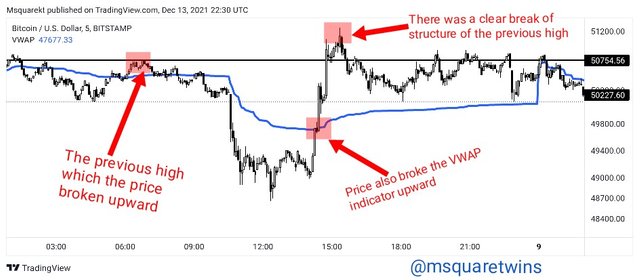
• Bullish or Bearish Structure Break: The first thing to determine in using strategy with VWAP indicator is to identify the last high or low based on the trend we are in and then wait for this previous high or low to be broken upward or downward. Also, there must be a break of VWAP indicator as well. There must be clear break out of the previous high or low for this to be valid.
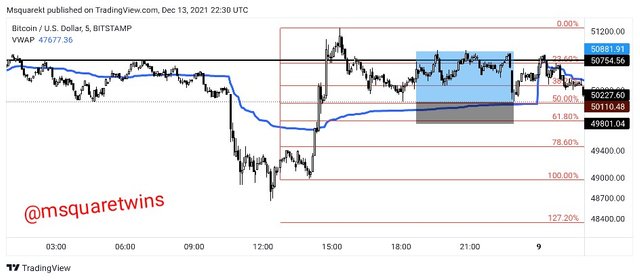
• Retracement to the VWAP/Use of Fibonacci: After a clear break of previous high or low, the next thing is to wait as price retraces. That is after an impulsive leg that break the previous high or low, price will retrace. We then clearly watch and monitor this retracement as it retraces toward the VWAP indicator. We then make use of Fibonacci retracement tool and measure from the bottom of the impulse move to the top or otherwise as the case may be. We then wait and clearly monitor level 50% and 61.8%, this two level are the entry level for strategy with VWAP indicator.

• Risk Management: The trade other should be placed around 50% and 61.8% with a stop loss order just below this zone. That is below 61.8%. The take profit order should be 1.5 times the stop loss order from the entry point. This means the risk to reward ratio will be 1:1.5, or at maximum 1:2.
3. Explain in detail the trade entry and exit criteria to take into account to correctly apply the strategy with the VWAP indicator?
The entry and exit criteria for strategy with the VWAP indicator is not difficult but the steps listed above must be met before entry must be made in market. Therefore we must make sure that;
The structure is broken either to the upside or downward side as the case may be. That is the the previous high or low must be clearly broken. This is very important. If the previous maximum (high) or minimum (low) is not broken, the strategy may not come out very well. So it is very important to note this.
The retracement is clearly monitored. After the confirmation of structural break to the upside or downside based on the direction that the market currently trending, we must wait for retracement of the impulsive move that breaks the previous high or low. We then draw the Fibonacci retracememt connecting the low level and the high level of the impulsive leg that causes a break of structure. We watch for 50% and 61.8% retracement level in confluence with VWAP indicator around the aforementioned Fib level.
Good risk to reward ratio is used. For good risk management, a stop loss order should be placed below the 61.8% Fib Level.
Take profit order of 1.5 times the stop loss order. A 1:1.5 risk to reward ratio is recommended or maximum 1:2.
Example of a sell order and a buy order is uploaded above.
PRACTICE
1. Make 2 entries (One bullish and one bearish), using the strategy with the “VWAP” indicator. These entries must be made in a demo account, keep in mind that it is not enough just to place the images of the entry, you must place additional images to observe their development in order to be correctly evaluated.
For this question, I am going to be making two entries, one for buy and the other for a sell order.
Buy Order
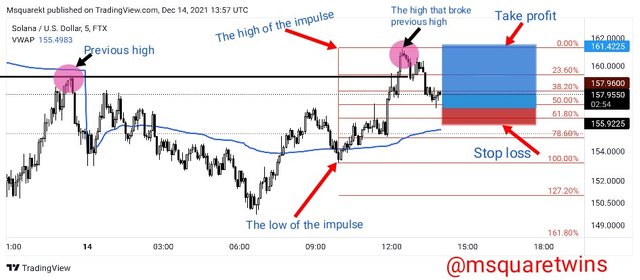
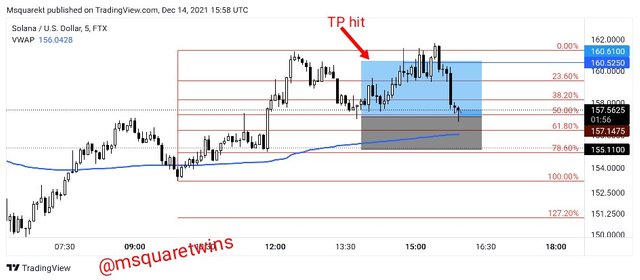
• The image uploaded below is the chart if SOL/USD on a 5 minutes time frame. As seen in the screenshot, we have a previous high which was broken by price by another one. Also, price broke the VWAP indicator upward.
• Then at the break of the previous high, I waited for the retracement of the impulsive move that broke the previous high. I then drew the Fibonacci retracement line by connecting the low of the impulsive move to the high reading 0 to 100 as seen in the screenshot.
Then I watch out for price to retrace to 50% to 61.8% Fib level. When price got slightly below 50% Fib level, I made an entry order with stop loss just below 61.8% Fib level and take profit order was also set with almost 1:2 risk to reward ratio.
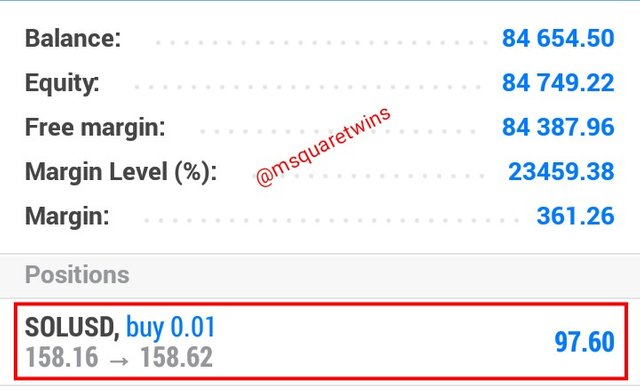
I then go to MT4 platform to take the buy order as explained above. The details of the order I took on MT4 platform is uploaded below.
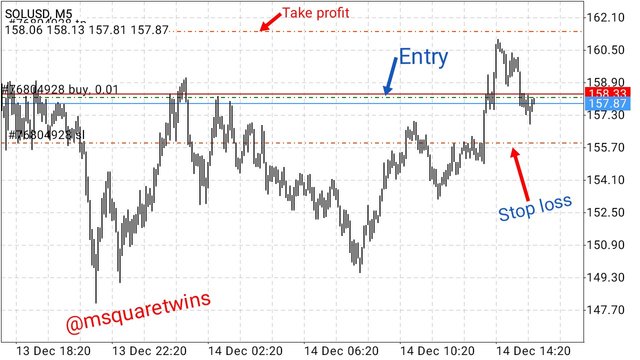
The picture below shows the running order of SOL/USD immediately after it was taken.
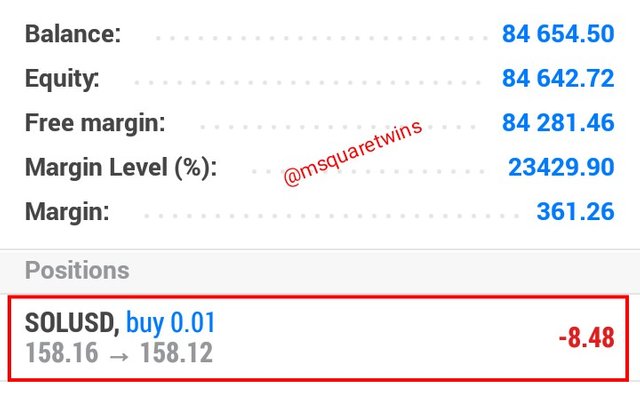
After about 20 to 30 minutes , I checked the order to see what price is doing. Below is the running order taken after few minutes.
Then the order later went as projected. The screenshot below is the screenshot taken from tradingview to see the final result of the buy order taken. As seen in the screenshot above, price got to our target point.
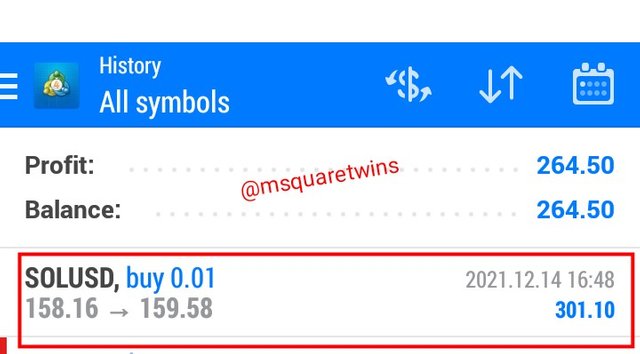
The screenshot below show the profit made from the buy order of SOLUSD.
Sell Order
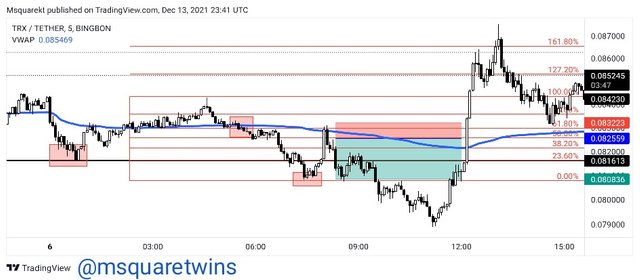
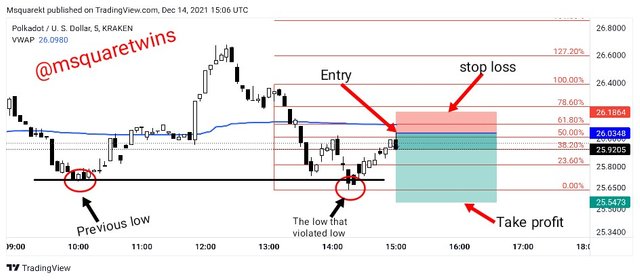
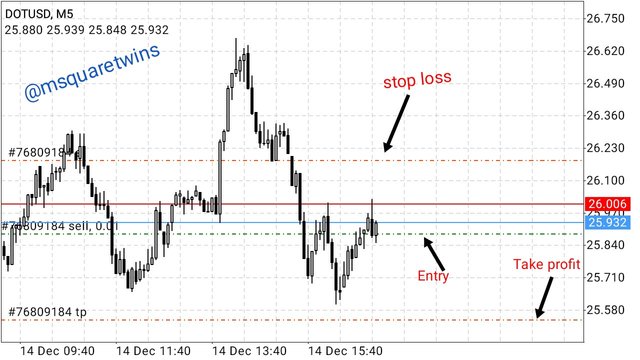
The image uploaded above is the chart of DOTUSD on a 5minutes time frame. As seen in the screenshot below, the last low formed was broken as indicated by a black horizontal line and the two circles in the screenshot.
Then I waited for the retracement of the impulsive down move that broke the previous low. As the retracement was forming, I drew Fibonacci retracement line from the high point of the impulsive leg to the low point reading 100 to 0. Then, I watched out for 50% and 61.8% Fib level.
I placed a sell order when the retracement got to above 50% Fib level and i put the stop loss slightly above 61.8% Fib level. The take profit order was also set in such a way that the risk to reward ratio read 1:2
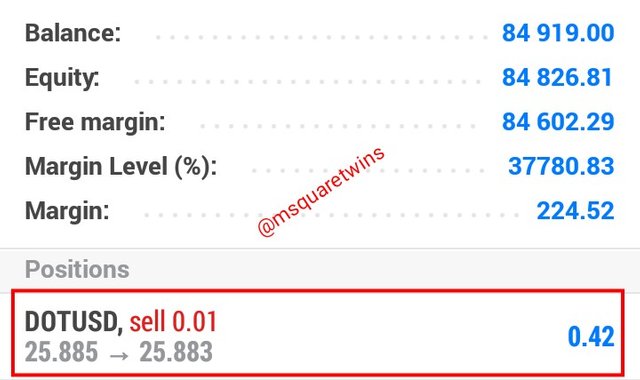
I then went to MT4 platform to take the sell order. The screenshot uploaded below shows the sell order taken on MT4 platform.
The screenshot uploaded below shows the running order which was taken immediately after the sell order was taken.
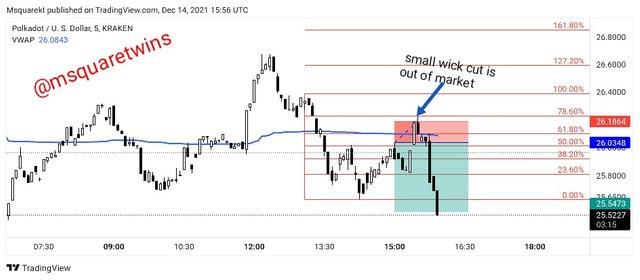
Then after a while, I checked the sell order bit it was unfortunate that it went against the prediction. Although it later went as predicted but it first took me out of the market by a little wick as indicated in the screenshot below.
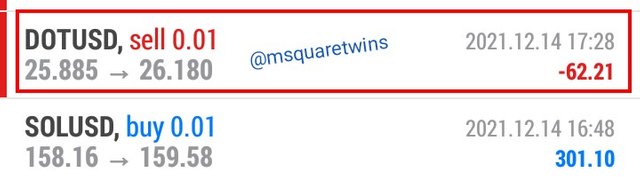
The picture uploaded below shows the lost I had for the sell order.
Of we compared the two trades, though we made a lost in one and a win in the other, but overall, I am still profitable. That is the power of a good risk management.
Conclusion
Volume Weighted Average Price is a great indicator that helps traders to know trend direction which in turns help them to take good trade decision. It is a special and unique indicator which has a great potential to remain the same irrespective of the switch of the timeframe from one form to another. This means that, VWAP indicator maintain how it looks like on chart regardless of temporalities. This is unlike many indicators use in market where the switching of timeframe distort the orientation or their form on chart.
In this post, I have clearly explained how to configure the VWAP indicator on trading view chart. I have also explain how to correctly execute the strategy with VWAP indicator for both buy and sell order. More so, I have explained the entry and exit strategy with VWAP indicator.
Lastly, I took two demo trades by using strategy with VWAP indicator as discussed above. Special thanks to lenonmc21 for this amazing lecture.
Thank you for reading.
Cc: @lenonmc21
Cc: @steemcurator02
Cc:- steemcurator01
Cc:- @sapwood
Thank you.
The link to the expired post is pasted below.