REPOST: Trading Using Wedge Pattern- Crypto Academy / S5W5 - Homework Post for @sachin08


Cover Page created by me, @msquaretk |created with imarkup App
It is a new week in the Crypto Academy. This is week 5. The past four weeks were awesome. We learnt different lessons from our Professors. Thanks to them and the management entirely.
This post is written in response to Professor @sachin08 ' assignment given to us after his lecture on "Trading wedge Pattern. In this post, I will be answering the questions one after the other based on my own understanding. Follow me closely.

1. Explain Wedge Pattern in your own word.

In this part of the task, I am going to be explaining wedge pattern. There are different types of pattern which traders look forward to in predicting the price of an asset. Generally we have candlesticks pattern and chart pattern. The formation of different candlesticks form chart pattern. We have looked at rectangle and triangle pattern. Now, another pattern is wedge
Wedge pattern is a type of chart pattern which forms after a prevailing trending leg in the market. In essence, the pattern is a consolidation to a prevailing leg in which price is seen being converged together and the identification of this is two trendlines that Connect the lows and highs of price during the formation are seen coming close to each other or contracting.
This type of pattern can be a continuation of the trend or reversal pattern. When it's formed in the middle of the the trend, either uptrend or downtrend, it may mean a continuation of the trend and when it's formed at the extreme peak level of price or low level of price, it may reverse the trend.
The formation of wedge pattern signifies a pause in the market. That's, during the formation of this pattern in an uptrend, the buyers are seen to take a break from the market as their bull effect is not recognized because the price will be seen contracting with a little downward in trend. And on the other hand, in a downtrend, the sellers are seen in a break as their bear effect is not recognized because price will be seen contracting with a little upward in trend.
There are two types of wedges. I am going to talk about these types in the next question. Let's take a look at the screenshot below. It's an example of wedge pattern.
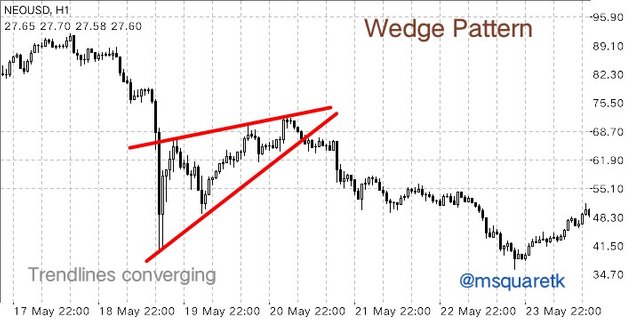
Graphical Representation of Wedge Pattern | Screenshot from MT4 App
If you look at the screenshot above, you will notice after a bearish move, there's a consolidation and the price was converging as the trendlines show it, that's what is called wedge pattern

2. Explain both types of Wedges and How to identify them in detail. (Screenshots required)

In this task of the task, I'm going to be explaining the two types of wedges and how to identify them. Generally, there are two types of wedge:
- Rising wedge
- Falling wedge.
Let's start with a rising wedge.
Rising Wedge
A rising wedge is a type of wedge which forms during a bearish trend. Hence it is called bearish fashion of the pattern. It forms after a bearish leg to the downside has occurred and the consolidation which is the retracement to bearish trend forms the pattern when the price begins to contract to the upside.
During the formation of rising wedge, the highs and lows which the price create are seen converging to a single point before a break of the pattern occurs. When the trend lines are drawn connecting at least two points of low price and two points of high price, they will be seen contracting and at point the trend line should cross each other. Hence, the pattern is sometimes referred to as contractile pattern in a bear market.
A rising wedge is a continuation or reversal pattern. This means, when it forms in a downtrend which is the consolidation or retracement to the bear leg, the breakout should occur to the downside so that bear will continue the move to the downside. It's a reversal pattern when it's formed at a very peak area of price in which the uptrend is reversed to downtrend.
So in essence, it should be noted a rising wedge that forms when an uptrend is about to end signifies reversal pattern, and the one that forms during a bearish trend is a retracement leg to the bearish leg and signifies continuation pattern.
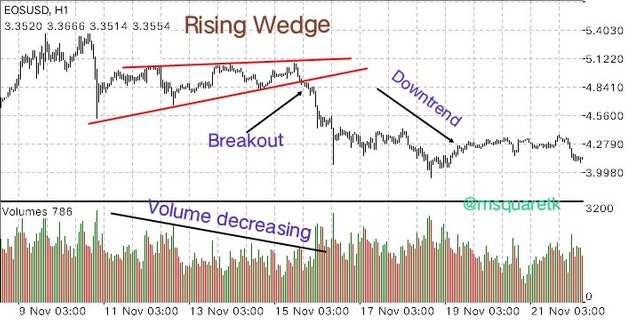
Rising Wedge Pattern | Screenshot from MT4 App
As it is seen in the screenshot above, the graph above is the representation of rising wedge pattern on the past chart. We can see that prior to the formation of the pattern, the was a bearish leg to the downside, then follow by the consolidation which form the pattern.
The two trendlines used to join the highs and lows of the price contracted and the price keeps converging until it broke down the pattern. This type of pattern is known as falling wedge and in the screenshot above it served as a continuation pattern.
Let's look at how to recognize this pattern.
How to recognize Rising Wedge
This pattern, rising is kind of difficult to recognize on the chart especially if you are not familiar with it. I will be discussing how to recognize them in the next paragraphs.
Identify the trend
The first thing is to know the trend which the market is. Mostly, rising wedge forms after a bearish leg to the downside which is a continuation pattern, although it can also form at extreme peak area in an uptrend which is a reversal pattern.
Two trendlines converging
After knowing the trend, then the next thing is to watch for when the price begins to contract and at the same time price should be seen trending up making lows and highs. Then when trend lines are drawn connecting the highs and lows, they should be seen sloping up.
Touches of highs and lows of the price.
For this pattern to be valid, at least each trend lines should touch three lows and and two highs and vice versa.
Volume during formation and Breakout
During the formation of this pattern, volume should be decreasing which signifies that there's no or little momentum in the market. Sometimes volume during breakout is heavy and it can be light as well but generally it is always more than average.
Falling Wedge
This is another type of wedge pattern which forms during a bullish trend. Hence it is called the bullish pattern of the trend. It forms during a bullish leg to the upside and if the retracement to the leg of this bullish trend forms in such a way that the price contracts while making a downtrend, then the pattern is called falling pattern. Although the pattern can also form in a very low peak area of a downtrend which is the reversal in that case.
During the formation of a falling wedge, the highs and lows which the price create are seen converging to the downside direction in a bullish trend to a single point before a break of the pattern occurs. When the trend lines are drawn connecting at least three points of low price and two points of high price, they will be seen contracting and at point the trend line should cross each other.
A falling wedge may be a continuation or reversal pattern depending on where it forms. When it forms in an uptrend which is the consolidation or retracement to the bull leg, the breakout should occur to the upside, breaking the resistance line of the pattern, so that the bulls can continue the move to the upside. It's a reversal pattern when it's formed at a low peak area of price in which the downtrend is turned to uptrend.
So we can say that the falling wedge that forms during a bullish trend and broke the resistance up and price rally to the upside is known as continuation pattern of the uptrend. While the one that forms at a very extreme low of a downtrend in which the trend changes to uptrend is known as reversal pattern.
Let's see the screenshot below.
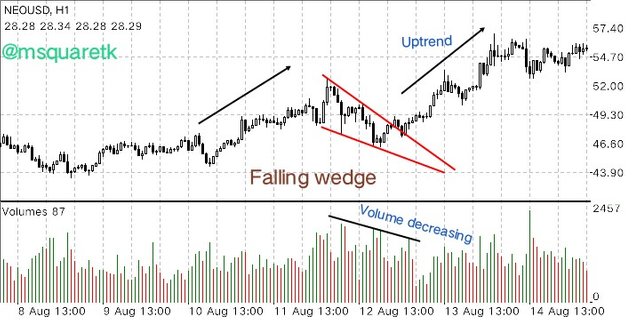
Falling Wedge Pattern | Screenshot from MT4 App
As we can see from the screenshot above, there was a move, bull move to the upside, before a falling pattern formed. After the bull legs, price was seen contracting to the downside which forms what is called a falling pattern.
If you look at the trend lines which join the highs and lows of the price, you will notice that they are converging to the downside. Then after some touches, he price broke the resistance line and the bullish trend continued. This example of a falling pattern is a continuation pattern.
During the formation of this pattern, the volume should be seen decreasing which will signify that there is a low momentum in the market. Traders wait for price to break the pattern before placing their entry. Having said this, let's look at how to recognize it.
How to recognize Falling Wedge
Just like rising wedge, if you are not familiar with falling wedge you may not be able to recognize it. Some tips explained below may be of help in identifying this pattern.
Identify the trend
The first thing is to know the trend which the market is. Mostly, falling wedge forms after a bullish leg to the upside which is a continuation pattern, although it can also form at extreme low area of a downtrend which is a reversal pattern.
Two trendlines converging
After knowing the trend, then the next thing is to watch for when the price begins to contract and at the same time price should be seen trending down making lows and highs. Then when trend lines are drawn connecting the highs and lows, they should be seen sloping down.
Touches of highs and lows of the price.
For this pattern to be valid, at least each trend lines should touch three lows and and two highs and vice versa.
Volume during the formation and Breakout
During the formation of this pattern, volume should be decreasing which signifies that there's no or little momentum in the market. Sometimes volume during breakout is heavy and it can be light as well but generally it is always above average than average.

3. Do the breakout of these Wedge Patterns produce False Signals sometimes? If yes, then Explain how to filter out these False signals.

YES! Sometimes , the breakout of these patterns produce false signals. And it's important to combine one indicators or tools with the pattern. Now, to filter a false signal, I am going to combine a volume-based indicator called On-Balance Volume indicator with the pattern.
On balance volume indicator is an indicator which shows the volume inserted in to the market. It consists of a single line which oscillates up and down its indicator window. When the volume is to the upside the indicator will be seen making higher highs and higher lows which signifies that the buyers are in control of price. On the other hand, when the volume is to the downside, the indicator line will be seen making lower lows and lower highs which signifies the bears are in the market. When the trend (higher lows and lower highs) of the indicator breaks, it signifies a shift in the direction of trend.
So, in essence, the indicator shows trend of an asset by showing where the volume goes in the market. Traders look for the opportunity to buy or sell when the trend of this indicator breaks. OBV also shows divergence which signifies a weaknesses in the current trend. Divergence occurs when price makes higher high and OBV makes lower high in an uptrend market and when price makes lower lows and OBV makes higher low.
Now, let's discuss how to use this indicator with the pattern. Normally when a rising wedge is forming, we know that the price will be experiencing a higher highs and lower lows to the upside, the OBV line should also be seen making higher highs and higher lows. When the rising wedge breaks, then the OBV line also supposed to break. This will signifies that the trend is changing. See the screenshot below.
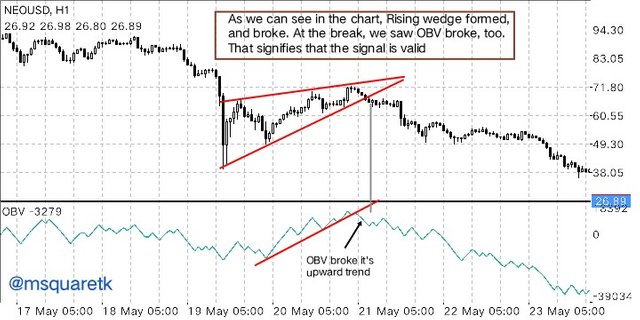
Combining OBV with Wedge Pattern | Screenshot from MT4 App
As we can see in the screenshot above, a rising wedge formed and price broke the pattern to the downside. At the break of the pattern, OBV also broke its upward trend showing that the bullish trend is changing to downtrend. When we see this, we have gotten two confirmation, signal from the pattern and signal for OBV. This shows that we have confluence for the trade.
In a situation where the OBV doesn't break, most of the time, the signal that the pattern give may be a false signal. Then, traders should be careful not enter the trade. Let's see the screenshot below where a rising wedge pattern gave a false signal.
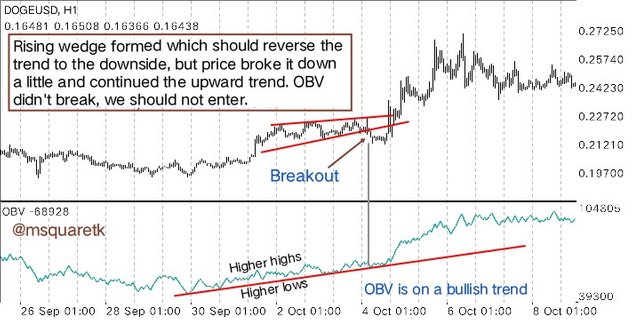
False Signal given by a rising Wedge Pattern | Screenshot from MT4 App
In the screenshot above, we can see that a rising pattern was formed at a peak of an uptrend. When rising pattern forms like that, then we expect reversal of that uptrend to downtrend. But as you can see, the price broke the support of the pattern, but price didn't go far, instead it continued its uptrend. That's a fake signal. Now, if you look at the OBV, at the time of booking of the pattern, OBV supposed to break as well if the signal is valid, but OBV didn't. This shows that the volume is still to the upside since OBV didn't break the higher low.

4. Show full trade setup using this pattern for both types of Wedges.( Entry Point, Take Profit, Stop Loss, Breakout)

In this last task, I am going to be showing full trade setup for both buy and sell using the wedge pattern strategy. Let's begin with a buy trade set up.
Trade Setup for Buy
So far, we have discussed how to recognize wedges on the chart. When I was discussing them, I said the first thing to look for is identifying the trend so you will know how to ride the wave. And then, we should look out the wedge pattern. If price starts converging and we draw the highs and lows of price with trend line also contracting, then we know that a wedge is forming. And of course we know we trade buy for a falling wedge that either form in a bullish trend or at a low peak area of downtrend.
I am going to show a buy trade set up on the chart of NEOUSD, H1 timeframe. See the screenshot below.
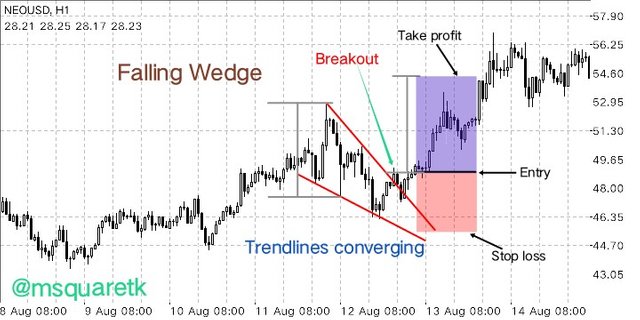
Buy Trade Setup using Wedge Pattern Strategy | Screenshot from MT4 App
As we can see in the screenshot above, the falling wedge pattern form during a bullish trend. This means, after the break out we are going to enter a buy trade. During the formation, that's when notice that the price has started contracting, we will draw trendlines connecting the lows and highs of price together an we will wait for price to break above the resistance of the pattern.
Entry should be taken at the break of the resistance and stop loss should be placed below at the support level, the tip of the wedge or below the support level of the pattern. Take profit is measured from the start of the wedge to the first support level as seen in the screenshot with grey line.
Sell Trade Setup
Also, when we want to use the pattern to take a sell trade we should first know the trend and then after that, we should know what price starts to contracting and use trend lines to join the lows and highs of the price. Of course we know that the pattern we should look out for when we want to sell is rising wedge either during the bearish trend or at the peak of the price of an uptrend.
I'm going to show a sell trade setup using the chart of NEOUSD, H1 trade setup. Let's see the screenshot below.
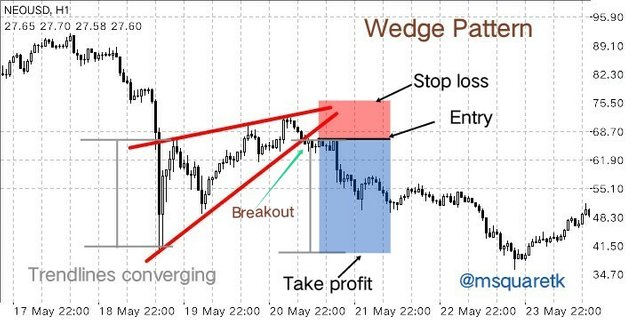
Sell Trade Setup using Wedge Pattern Strategy | Screenshot from MT4 App
As we can see, after a bearish trend, a rising wedge forms. And as you can see, the trend lines also show that the price was converging in an uptrend direction. This means we can take our entry at the break of the pattern.
Sell Entry should be placed at the break of support of the pattern. Stop loss should be placed at the tip of the wedge or above the resistance resistance of the pattern. Take profit is measured from the start of the wedge to the first resistance level made by the wedge as it is seen in the screenshot.

Conclusion

Chart patterns play a vital role in predicting the direction of price. There are some people who only trade chart patterns but of course they must be very good at recognizing the patterns because sometimes identifying these patterns can be very difficult. Wedge Pattern is one of the patterns which traders look out for on the chart. It's formed on the price chart during a retracement or at the end of a trend when price begins to contract before a breakout. Trendlines are used to join the lows and highs of the price and the trend lines should be also seen converging and should cross later.
There are two types of wedge pattern: rising wedge and falling wedge. When rising wedge is formed, traders look for the opportunity to trade a sell entry at the break of the support level of the pattern. And when a falling wedge is formed, traders position themselves to ride a buy wave at the break of resistance level of the pattern. It should however be noted that while some traders trade the patterns alone, confluencing them with other indicators or tools can increase the success rate of the pattern.
Thanks to Professor @sachin08 for bringing up the course. So far, I have learnt some chart patterns from you. It's awesome as I have been able to read more on the pattern and do more research on them. I look forward to seeing more from you.

NB: All screenshots are taken from my MT4 App.
Below is the link to my expired post: https://steemit.com/hive-108451/@msquaretk/trading-using-wedge-pattern-crypto-academy-s5w5-homework-post-for-sachin08
CC: @sachin08
@steemcurator01
@steemcurator02
Written by @msquaretk