REPOST: Trading strategy with the VWAP indicator – Crypto Academy/S5W3 - Homework post for @lenonmc21
Cover Page created by me, @msquaretk | created with imarkup App
Hello Stemians.
It's a great week again in the Crypto Academy. The past four weeks were awesome as they were full of experiences from our Professors in the Academy. Thanks to all the Professors and the management of this great academy.
Today, I will be making a post in response to Professor @lenonmc21' assignment he gave us after his lecture on "Trading strategy with the VWAP indicator". He explained the indicator very well by showing us the understanding of it and how to trade with it. So, I will be answering the questions he asked one after the other. Follow me closely.

THEORY
1. Explain and define in your own words what the “VWAP” indicator is and how it is calculated (Nothing taken from the internet)?
In this first task, I am going to be explaining what VWAP is and how it's being calculated. In the previous class we have learnt so many indicators from Prof and how to trade with them. Another important indicator is VWAP.
VWAP means Volume weighted average price. It's an indicator which is very used by many traders on price chart to predict the direction of price. Based on price and volume of an asset, VWAP shows the average of price of an asset throughout a particular day. VWAP is an indicator which the traders use to confirm the trend and the value of an asset.
VWAP consists of a single line like moving average which moves with the price. Traders buy the asset when the price crosses above VWAP and sell the asset when it is below the line of VWAP. Price above the VWAP means that the trend is bullish and below it means that the trend is bearish.
VWAP indicator is very different from all other indicators. We have all added one or more indicators to the chart and use them on different timeframes. These indicators when switch to other timeframes, you will see them change phase. And this means if you want the indicator to be effective, you may need to stick to the timeframe you added it or re add in another timeframe. But VWAP is not like that; it doesn't change phase or orientation in different timeframes. That's, when you add the indicator to the chart on M15 timeframe, if you switch to H1 timeframe, you will still it align with the price, not changing as in other indicators.
Calculation of VWAP
The indicator is takes three important parameters in its calculation. These are:
- Price
- Volume
- Numbers of candles per day
It's on these parameters that VWAP in formed on the chart. VWAP is calculated as the addition of the price and the volume of money traded divided by the number of daily candles.
Mathematically, the formula for calculating the VWAP is given below:
VWAP= P + V$T / NDC
Where P = price
V$T / NDC = Volume of money traded
NDC = Number of daily candle
Looking at these parameters that VWAP takes into consideration in its calculation, we will realize that it has edge since it gives the precise average price. And of course, because it takes daily candles, that means the data of this will be resetting each day.
2. Explain in your own words how the “Strategy with the VWAP indicator should be applied correctly (Show at least 2 examples of possible inputs with the indicator, only own charts)?
In this task, I am going to be explaining how the strategy with VWAP indicator should be applied correctly. This strategy has to take into consideration what we have learnt so far like market structure, fibonacci retracement tools and the indicator itself. I will explain better. But before that, let me show how add the indicator to the chart and how to configure it properly.
To add the indicator to the chart, I am going to be using tradingview platform. Go to tradingview.com. click on the chart on the menu icon at the left hand side.
Upon clicking on it, the chart will be opened. At the top of the chart, look fo "fx indicator". Click on it
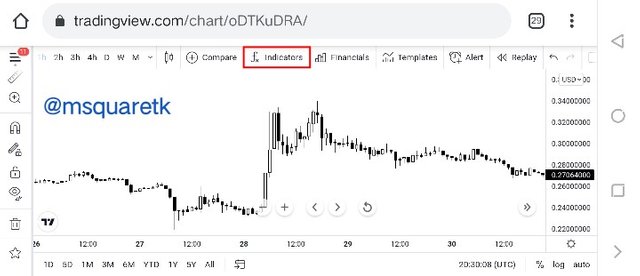
Screenshot from Trading view | SOURCE
- Upon clicking on it, a box will appear where you can search the indicator you want to add to add to the chart. Type "VWAP" on the box and click on it.
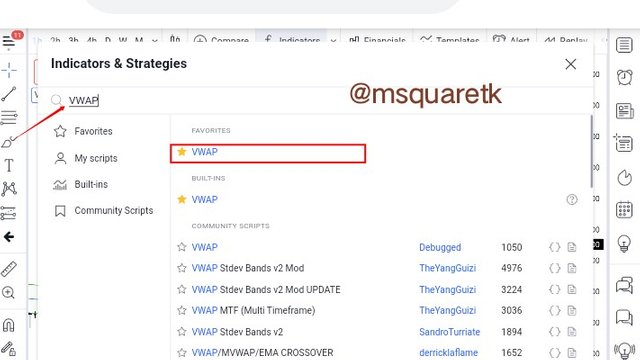
Screenshot from Trading view | SOURCE
- Once you click on it, it will be added to the chart. Now to configure the chart, click on the indicator at the top left side. You will see an icon like gear , click on it. Then, once you do that a page will appear where we will configure the indicator. On the style section, unmark the lower and upper band. Then go to VWAP line, and increase the thickness for maximum visibility on the chart. Then click ok*.
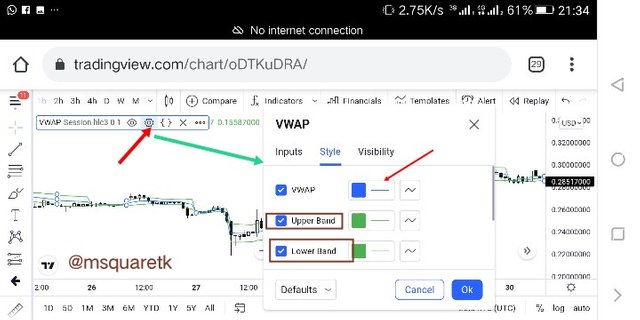
Screenshot from Trading view | SOURCE
Then, once you click on "ok", the VWAP should appear neatly on the chart. In the screenshot below you will see that VWAP has been added to the chart and configured.
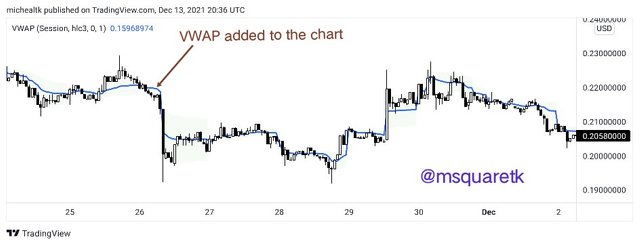
Screenshot from Trading view | SOURCE
Now, having seen how to add the indicator to and configure it on the chart, let's now look on how to apply the strategy with this indicator.
VWAP indicator is a kind of indicator that attracts the price and also repels it away. This means this indicator is a very good tool which can be used as support and resistance on the chart price. When we see price cross above the VWAP line, this may mean that the trend is about to reverse. Then, we must wait for the price to come near the indicator before we take entry. Actually, we are going to use the knowledge of market structure in addition with the break of the VWAP indicator line and then we will use fibonacci as a confluence before we can take the entry. Let's discuss this in full.
Steps to Follow to apply the strategy with VWAP Indicator correctly
Since we have already added the Indicator and configured very well to suit our strategy. Remember I told you earlier that the strategy involves adding together what we have learnt in the previous classes such as market structure, resistance and support and fibonacci retracement. Without wasting too much time, I am going to be listing and explaining the steps to be followed to use the strategy correctly.
1. Break of market structure (BMS) from bullish to bearish and vice versa
To use this strategy, the first thing we must look out for is the break of structure. We must wait for a bearish trend creating lower lows and lower highs to be broken if we want to take a buy entry; in this case, the previous lower high must be broken which will signify a change I trend. On the other hand, if we want to take a shower entry, we must wait for a bullish trend creating higher highs and higher lows to be broken; which means, the previous higher low must be broken which will signify a weakness in an uptrend and a change of trend to the downside. Also, VWAP line must be broken and this will give more confirmation that the trend is shifting.
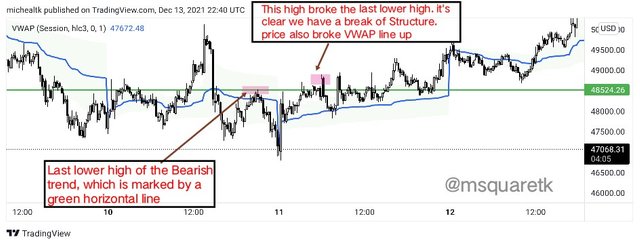
Screenshot from Trading view | SOURCE
2. Pull back to VWAP line and confirmation with Fibonacci retracement
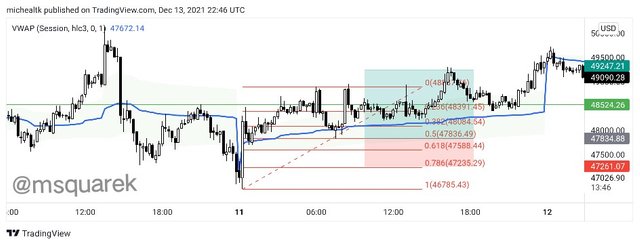
Now, the next thing we need to watch after the structure has been broken and that the VWAP also broken is that we must watch the counter move, the retracement to the leg that broken the structure. The leg that broke the structure is regarded as the start of a new trend and the counter move is the retracement leg. Now, we need to watch price comes to VWAP line. Once the pull back starts begin to happen, we should take our fibonacci retracement tool and draw from the start of the leg that broke the structure to its end (bottom to top). The retracement should be at 50% and 61.8% and when the price is around or on the VWAP line.
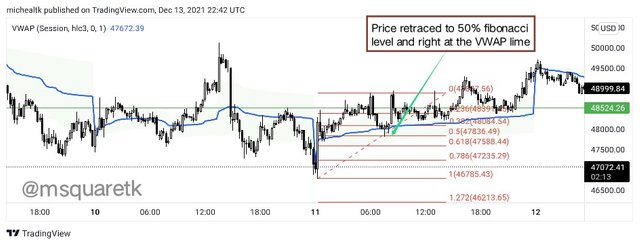
Screenshot from Trading view | SOURCE
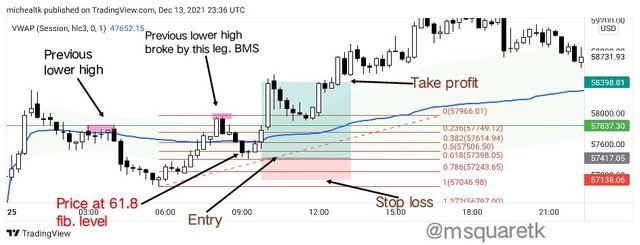
3. Trade Management
Now, when the price is at our zone, the zone of 50% and 61.8% fibonacci retracement, the stop loss should be placed below these levels (50% or 61.8%) and take profit should be around 1.5 times the pips of the stop loss to have risk reward of 1:2
Screenshot from Trading view | SOURCE
3.Explain in detail the trade entry and exit criteria to take into account to correctly apply the strategy with the VWAP indicator
In this part of the task, I am going to be explaining entry and exit criteria to take into consideration to correctly apply the strategy. In the next paragraphs, I am going to explain this for both bullish and bearish together.
Now, the first to take into consideration is that, the price should break the structure, that's when you want to place a buy order, the price should break the maximum of the price and also the VWAP should also be broken to the upside and if you want to trade sell entry, the price should overcome the previous low by breaking it and VWAP line should also be broken. This should clearly be seen that price breaks the previous high or low. If this doesn't happen, the first condition hasn't be met.
Now, after the price has broken the previous high or low depending on the entry you are planning to take, we must wait for the price to retrace back to the VWAP. Then as the price begins retracing, we must draw the fibonacci and as I explained our is confluence 50% or 61.8% level, when the price retrace back to the VWAP. Once this happens, we can take our entry, but if it fails, that means the setup is invalid and we should look for another setup.
Buy or sell entry should be placed when the price retrace back to the VWAP line and the price is between 50 and 61.8 of fibonacci level
Stop loss should be placed below these fibonacci levels.
Take profit should be 1.5 times the stop loss to give a risk reward of 1:1.5 or 1:2.
Screenshot from Trading view | SOURCE
PRACTICE
1. Make 2 entries (One bullish and one bearish), using the strategy with the “VWAP” indicator. These entries must be made in a demo account, keep in mind that it is not enough just to place the images of the entry, you must place additional images to observe their development in order to be correctly evaluated.
In this part of the task, I am going to be making two entries using one buy and the other sell using VWAP indicator. Let's start with a buy entry.
Buy Order
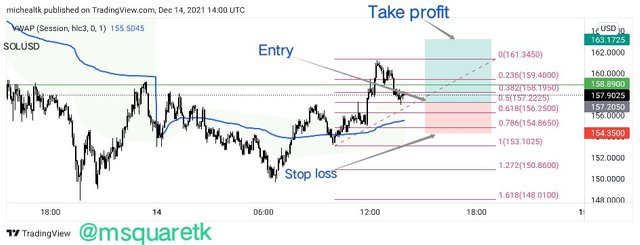
For a buy order using VWAP strategy, I am going to be placing a buy order on the chart of SOLUSD. The first thing we must take note I we are using the strategy is that we must make sure that the structure breaks. And on opening the chart of SOLUSD, M15 timeframe, I saw that the structure has broken. As you will see in the screenshot below, the last previous high on the bearish trend was clearly broken. And price has also broken the VWAP line up.
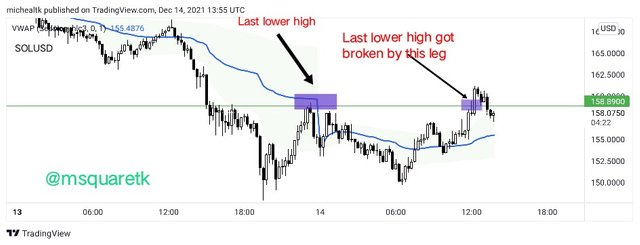
Screenshot from Trading view | SOURVE
Then, since I have seen that, the next thing is to wait for the price to come back to the VWAP line as retracement. And of course we need to draw our fibonacci retracement from bottom to the top of the bullish leg that broke the structure. So, I drew the fibonacci. The level which we use as confluence are 50% and 61.8%. In the screenshot below, you will notice that the price is at 50% which means, it is on one of our levels.
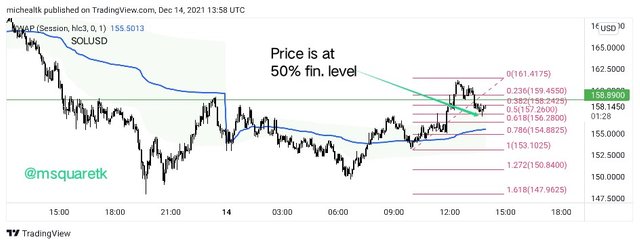
Screenshot from Trading view | SOURVE
Then, next is to place a buy entry since all the criteria have been met. So, I placed a buy entry at the level of 50% fibonacci retracement and stop loss was placed a little bit below the entry and take profit was 2 times the stop loss to have a risk reward of 1:2
Screenshot from Trading view | SOURVE
As we will see in the screenshot below. I used Mt4 app to place the buy trade. The screenshot below also shows entry, stop loss and take profit
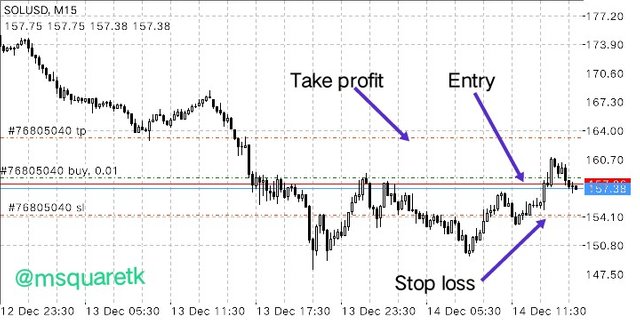
Screenshot from MT4 App
Then, some minutes after the execution of the trade, the trade hit my take profit. Which means, the trade went in my favor and I made profit from the trade. The screenshot below shows the profit history of my trade.
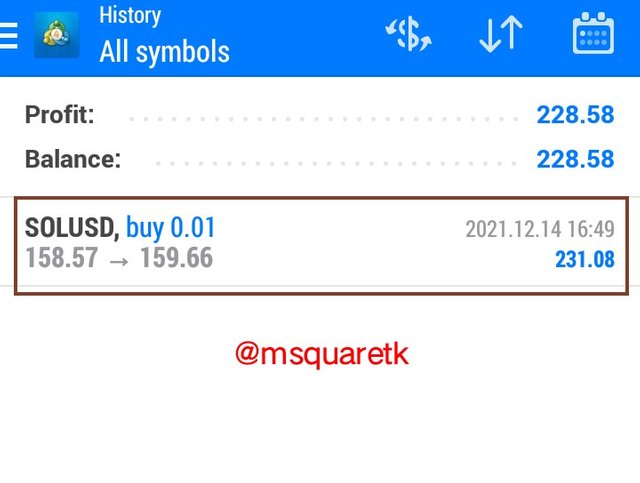
Screenshot from MT4 App
Now, having seen a buy order using the VWAP strategy, let's see a sell order with this strategy. As we know, the same procedure is followed for both buy and sell.
Sell Order
For this sell order, I am going to be using the chart of DOTUSD to demonstrate my understanding of the strategy with a sell demo trade. Upon opening the chart of DOTUSD, M5 timeframe, I realized that the price has just broken the previous low. This means that a break of market structure (BMS) has just happened. And as we know that, to sell with the strategy VWAP indicator, the previous low made by price must be overcome, that's a bullish trend should be broken. Then, I also saw that price has also broken the VWAP line.
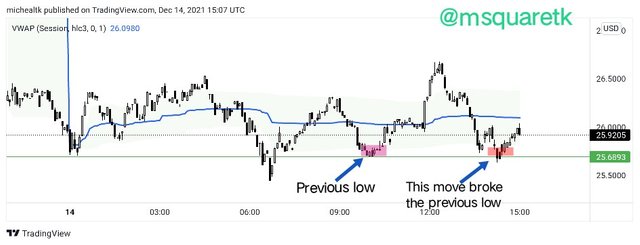
Screenshot from Trading view | SOURVE
Then, next, after seeing that the low has been broken and VWAP has also broke, is to draw the fibonacci retracement tools and wait for the price to back to VWAP line. Then, we can place a sell entry if price comes to 50% or 61.8% fibonacci really level. Then, as we will see, price retraced back to VWAP and confluenced with 50% fibonacci level. See the screenshot below.
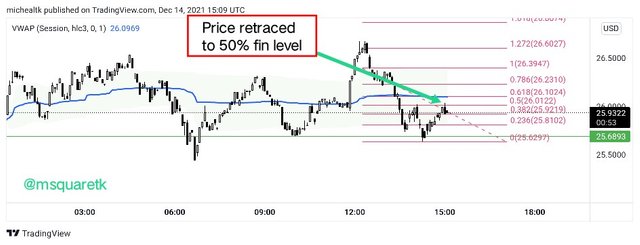
Screenshot from Trading view | SOURVE
Then, having seen that all criteria were met, structure broken, price retraced back to VWAP and confirmation with fibonacci retracement with price on 50% fib. level, I placed an instant sell entry. Stop loss was placed above 50% level and take profit was 1.5times the stop loss to have a risk reward of 1:1.5. See the screenshot below.
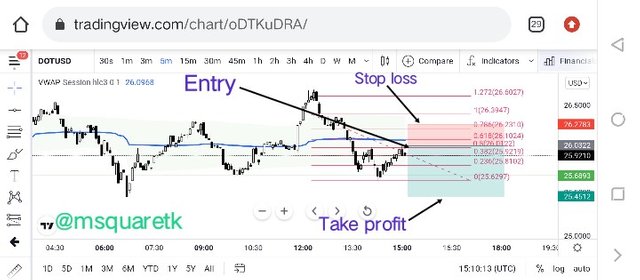
Screenshot from Trading view | SOURVE
I used my MT4 app to execute the sell trade. As you will see in the screenshot below, it shows the entry, stop loss and take profit for the sell trade of DOTUSD.
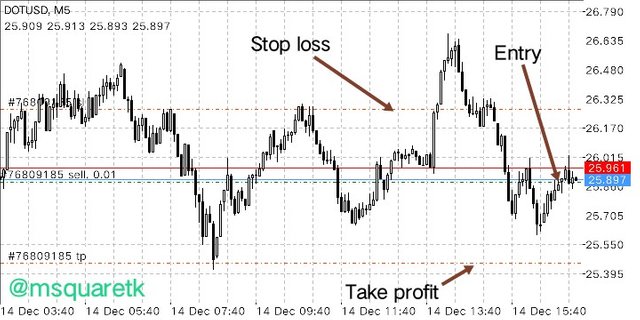
Screenshot from MT4 App
Then, some minutes after the execution of the trade, it smatched my take profit. This means, I have made profit since the trade went in the predicted direction. See the screenshot below; It shows the profit of DOTUSD. In fact, you will see history of the profit of the two trades .
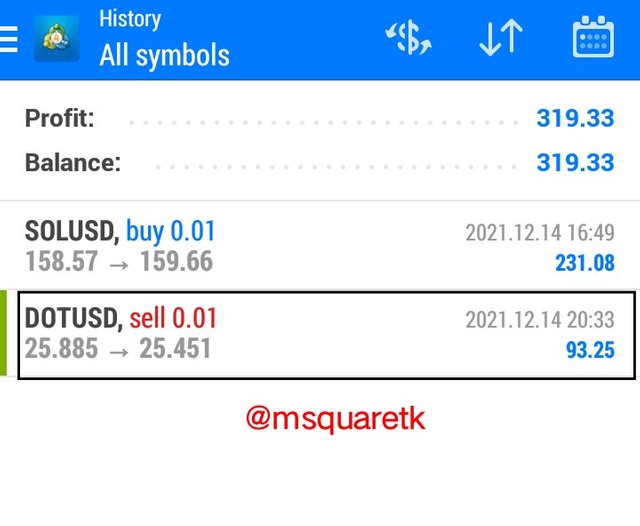
Screenshot from MT4 App
As it can be seen in the screenshot above, both trades went in the predicted direction and both are profits.
Conclusion
Technical indicators is one of the tools which traders use in technical analysis. VWAP is a great indicator which can be used to place entry position in the market. The strategy used in this task combines the use of VWAP indicator, market structure and fibonacci retracement tools. And by combining these great tools, we were able to predict the movement of price to some degree of accuracy.
I have been able to demonstrate my understanding of the indicator by using it to place demo trades, buy and sell. Thanks to Professor @lenonmc21 for bringing this course up. I habe learnt one or two things from the strategy. I look forward to seeing more from you.
Thank you all for visiting my post.
NB: All unsourced screenshots are taken from my MT4 App.
CC: @lenonmc21
@steemcurator01
@steemcurator02
Below is the link to my expired post which wasn't curated:
https://steemit.com/hive-108451/@msquaretk/trading-strategy-with-the-vwap-indicator-crypto-academy-s5w3-homework-post-for-lenonmc21
Written by @msquaretk