REPOST : Perfect Entry Strategy using Stochastic Oscillator + 200 Simple Moving Average - Crypto Academy/S5W3 - Homework post for @lenonmc21


Cover Page created by me, @msquaretk |created with imarkup app
Hello everyone.
This is the third week of the season 3 in the Steemit Crypto Academy. This post written in response to Professor @lenonmc21 'ssecond lecture in the season 3. He taught us "'Perfect Entry' Strategy using Stochastic Oscillator + 200 Simple Moving Average". He explained the strategy well and gave the criteria for the strategy to be valid and entry and exit criteria to trade it. After his lecture, he gave us four questions in which three are theories and one is practice. So, I will be explaining the questions one after the other based on my own understanding. So, follow me closely.

THEORY
State in your own words what you understand about the Perfect Entry Strategy (Place at least 2 examples on crypto assets)?
In this first task, I am going to be explaining my understanding about "perfect entry" strategy taught by Prof. @lenonmc21.
The strategy called "perfect entry" strategy is a strategy which can help us predict the movement of price and take advantage of the signals given. Perfect entry strategy is a strategy that comprises of the use of price action, 200 period moving average, and Stochastic oscillator Indicator.
We know that the market can either be ranging or trending. It's not advisable to trade when the market is ranging because there won't be movement in the market. In essence, profit is made when trading a trending market, and infact, when going in the direction of trend. Why is this necessary? It's important because perfect entry strategy is used in a trending market. So, we will be using the strategy in a very clear trending market.
Like I said earlier, the strategy is comprised of using price action, market structure together with 200 moving average in which Japanese candlestick that forms at the 200 period moving average gives signal and the stochastic oscillator also added to filter the signal.
Now, I am going to go deeper in how the strategy works. Now, to use this strategy, there are some things we must see on the chart. 200 period moving average and Stochastic oscillator Indicator should be added to the chart. Then after this, then, there are criteria that must be met or steps to be followed.
1. Determination of trend:
This is the first thing that we must examine if we want to use perfect entry strategy. Like I said above, we use this strategy in market that is trending. So, we must determine the prevailing trend of an asset, is the trend bullish or bearish. Then, this is where market structure comes in. Although, 200 MA can also help us in knowing the trend. But market structure is best for this. We know that a trend is bullishwhen the price moves from a lower concentration of price to a higher concentration of price with series of higher highs and higher lows. On the other hand, when price moves from a high concentration of price to a low concentration of price with a series of lower lows and lower highs, that trend is bearish. It's by the help of market structure that we will determine the trend in the market. So, after trend determination, we look at the next step.

Screenshot from Trading view | Source

Screenshot from Trading view | Source
2. Confluence of Japanese Candlestick with 200 moving average.
The next step we must examine after determining the trend is to look for confluence when the price touches or near the 200 period moving average. Now, the candle that forms at the or near the 200MA is very crucial in this strategy. Do, it's very important that we watch the price action around this moving average. The candle that we use for this strategy is small candle with long wicks below and above it. The body of the candle must be very small. The small body of the candle will signify that there is no momentum in the current direction of price and the wick will signify that there's rejection in that direction and sellers or buyers will take control of the price, henceforth.
Then, after identifying the confluence of the candlestick with the 200 moving average, the next step is to look at stochastic oscillator.

Screenshot from Trading view | Source

Screenshot from Trading view | Source
3. Look at stochastic oscillator Indicator for signal
The next thing or step is to check the Stochastic oscillator at the point where price touches the 200MA and small Japanese candlestick adds more confluence. Stochastic oscillator is an indicator which is scaled from 0-100. It comprises of two lines which oscillates up and down the scale. The scale of 20–0 is called oversold zone and 80 – 100 is called overbought zone.
When the stochastic lines cross 20 and below, it is often signifies that the sellers are exhausted, that the bearish trend is getting weakened and bullish trend is likely to be forming or buyers take over the market. So, when these lines are in oversold region, the sellers begin to leave the market and take profit because of the fear that the price is devalued. The cross of the two lines at the oversold region is often reffered to as buy signal.
On the other hand, when the Stochastic lines cross 80 scale and above, it is a signal that the bullish trend may likely come to an end as the price has entered overbought zone. And we know that overbought zone is a zone when the price is at the premium price, price at the peak. So, this point, buyers are afraid because they know sellers may take control of the price, then they begin to take profit and exit the market. The cross of the lines at the zone of overbought is often regarded as the sell signal.

Screenshot from Trading view | Source

Screenshot from Trading view | Source
2. Explain in your own words what candlestick pattern we should expect to execute a market entry using the Perfect Entry Strategy.
In this part of the task, I am going to go deeper by explaining the candlestick pattern we should expect to execute a market entry using the "perfect entry" strategy. Remember I said that the type of candlestick that forms when price touches the 200 period moving average is very crucial to our strategy. Candlestick pattern is one of the indicators which traders use , some combine these patterns with their strategy and others trade only the pattern.
The candlestick we expect to form on or near the moving average, 200MA is a candle with small body which has wick up and down. Now, the small body of the candle near the moving average signifies that the momentum at which the buyers or sellers, depending or the direction, are coming with has greatly reduced. This may signify that the power of buyers or sellers is weakened. And the wicks that form both at above and below the candle is a sign of rejection. This means, there's a rejection at the dynamic support or resistance level in which 200MA is the one acting as support/resistance level.
So in essence, for perfect entry strategy, the candlestick at the the or near the 200MA must be small candle with wicks up and down. This shows rejection in the retracement leg. And this means that traders, either buyers or sellers in the short term trend will soon be out.
Now if we look at the screenshot below as an example, we will notice that the prevailing trend is bullish trend. Meaning we have healthy market structure, and the trend is to the upside. If we look at what happened when price touched the 200 period moving average , you will notice that a small candlestick pattern formed which has wicks up and down. See the screenshot below.

Screenshot from Trading view | Source
If you look at the screenshot very well, you will notice that the candle I described above was what formed on the chart. It can also be said that the candle is like doji candlestick pattern. As it has small body and long wick.
If we consider the formation of the candlestick pattern very well, around that small black candle (bearish candle) that formed on the 200 MA, we can say, the candlestick pattern that form is morning star. An morning star is a reversal candlesticks pattern. Although, I am not saying that there will always be a formation of morning star or evening star around the 200 MA. The most important thing is that, the small candlestick pattern which resembles indecision or doji must form to consider the perfect entry strategy valid.

Screenshot from Trading view | Source
Now, if you look at that screenshot, we can see that something like morning star formed. And see how the price rallied greatly to the upside. If this type of candlestick pattern formed in a retracement of a prevailing bearish trend, it's called evening star. Both of them are reversal candlestick pattern.
Sometimes, inside bar candlestick pattern the pattern that may form when the small bodied candlestick form on 200MA. This pattern is also a reversal pattern. Inside bar comprises a candle which shows volume and one with reduced volume in which it is inside that the previous candle.

Image Created by me, @msquaretk | Created with imarkup
Then, the formation of pattern that may form when this small candle form can also be in form of bullish engulfing or bearish engulfing. When the next candle that forms after the small candle engulfs it, then, it is called Engulfing pattern.
3. Explain the trading entry and exit criteria for buy and sell positions in any cryptocurrency of your choice (Share your own screenshots)
In this part of the task, I am going to be explaining entry and exit criteria. As we have seen how to use the strategy. Then, we need to know how to enter and exit the market with "perfect entry strategy.
Now, the first thing we should do if we want to trade with this strategy is to add 200 moving average and Stochastic indicator to the chart. After adding them, the next thing is that we must make sure that the three steps mentioned above are fulfilled. That's, determination of the trend must be the first thing, follow by waiting for the price to touch the 200 MA and making sure that the candle that formed on it is small bodied candle. And then we look at the Stochastic for sell or buy signal.
If any of the conditions fails, then, that means we don't have a valid set up. Then we will need to wait for another set up to forms. This is to ensure that we will follow the rules or criteria of "perfect entry" strategy.
The market structure must be valid. That's it must be clear trend either bullish or bearish trend. If the market is ranging, it is better we leave the market until there's a clear trend.
For buy entry, after all conditions are met, entry should be placed immediately after the Small bodied candle formed at or near the 200MA. stop loss should be placed below the candle and profit should be taken when stochastic enters or cross 80*.

Screenshot from Trading view | Source
- For sell entry, after all criteria or condition are met, entry should be placed immediately after the small bodied candle that forms on or near 200MA. Then stop loss should be placed above the candle and profit should be taken when the Stochastic enters or cross the scale of 20

Screenshot from Trading view | Source
PRACTICE
1. Trade 2 demo account trades using the “Perfect Entry” strategy for both a “Bullish” and “Bearish” scenario. Please use a shorter period of time to execute your entries. Important you must run your entries in a demo account to be properly evaluated.
In this practice question, I am going to be making two demo trades, one buy and the other sell entry. Let's start with a buy entry.
Buy Entry Using "Perfect Entry" Strategy
To place a buy using perfect entry strategy, we first add 200 moving average and Stochastic oscillator to the chart. For this task, I am going to us MT4 platform.
Opening the chart of SOLUSD, I found out that the prevailing trend is bullish. Which is the first thing we must determine. As we will see in the screenshot below. The price was making higher highs and higher lows according to market structure.
Then, we need to wait for price to touch the 200MA. That's we want to join the bullish leg, then price must retrace and we will join the bullish trend. Then, as soon as the price comes near the moving average, I was watching. Then a small bodied candle was formed very close to 200MA.
And of course, we need to look at the Stochastic oscillator to know what signal it is giving. Looking at the Stochastic, I realized that, it has entered oversold zone. This means I could take buy entry.

Screenshot from my MT4 app
Then, I placed a buy entry immediately. See the screenshot below. Stop loss is placed below the small bodied candle. And take profit is when the the Stochastic crosses 80
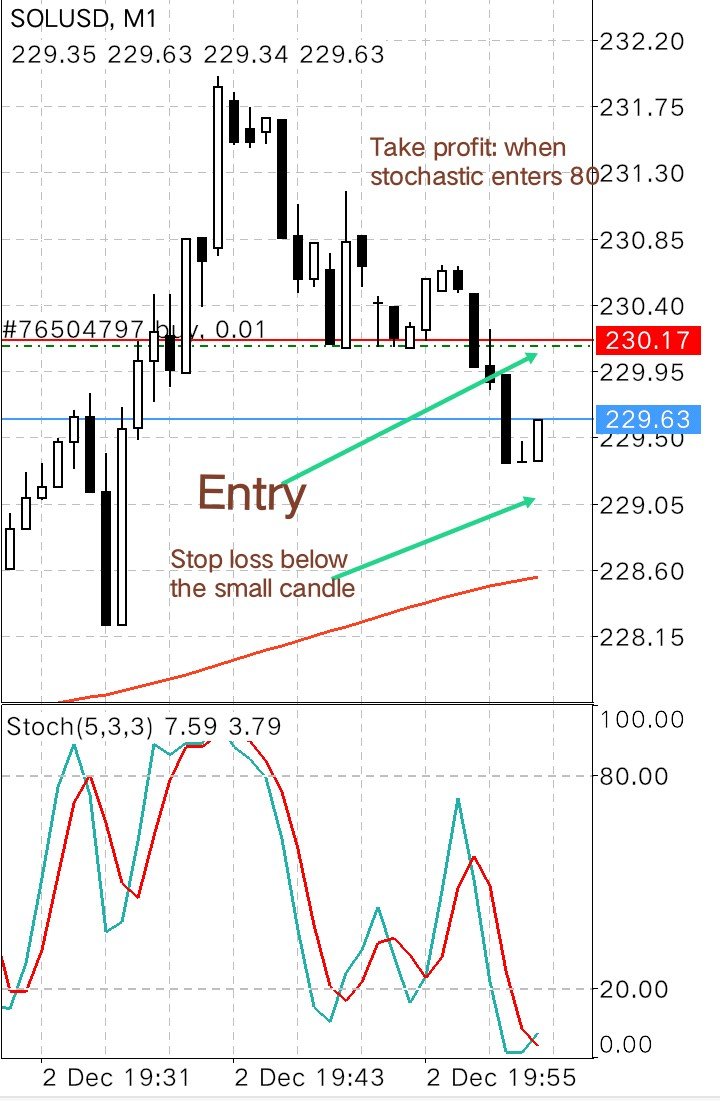
Screenshot from my MT4 app
After some minutes, just about 5 minutes because 1Minute timeframe is used, the stochastic began to cross 80. Then, we will have to exit the market and close the trade.

Screenshot from my MT4 app
Then, I closed the trade when the stochastic entered 80. See the screenshot below. This is the profit made from the buy entry.

Screenshot from my MT4 app
Sell Entry Using "Perfect Entry" Strategy
Also, for the sell entry, the criteria must be met before placing a sell entry. For the sell entry, I am going to be placing demo sell entry on ETHUSD. Since I am interested in selling, then the prevailing trend should be bearish, then I will be waiting for the price to retrace and candlestick to reject the 200MA.
And as we will see in the screenshot below, the price was making lower lows and lower highs which signifies that the trend is bearish. So, I was interested in joining the prevailing trend and I was waiting for price to touch the moving average. And as the price touched the moving average, the type of candle (small bodied candle with wicks) which we use for the strategy formed on the 200MA. Then, lastly I looked at the Stochastic, and I saw that it had entered overbought. Then, all the criteria or conditions are met.

Screenshot from my MT4 app
Then, immediately, I placed a sell entry with stop loss above the small bodied candle and take profit to be when Stochastic go below 20.

Screenshot from my MT4 app
Then, after some minutes, stochastic went below 20. That means I would take profit and exit the market.

Screenshot from my MT4 app
Then I closed the trade at 138BIT. See the screenshot below.

Screenshot from my MT4 app
Conclusion
There are many strategies which traders use to trade in cryptocurrency trading. The best of the strategies are those which include price action. The reason is, using technical Indicators alone may be misleading. Im this task, I have discussed 'perfect entry' strategy which is a combination of signals from technical Indicators and price action. It comprises of 200 MA, stochastic oscillator and private action.
I have been able to use the strategy to make two trades, buy and sell. The strategy is simple once all criteria are met. Thanks to Professor @lenonmc21 for bringing up this topic. I have learnt one or two things.
N:B– All screenshots are taken from trading view and my Mt4 App.
CC: @lenonmc21
@steemcurator02
@steemcurator01
Written by @msquaretk
###Below is my link to the ask not curated: