REPOST — Crypto Trading Using Trix Indicator - Crypto Academy /S6W3-Homework Post for kouba01

Cover Page made by me, @msquaretk | Made on imarkup app
It's a new week in the Crypto Academy. This is week 3 of lecture in the Academy. Thanks to all our Professors for delivering quality content and lectures in the academy. This post is written in response to Professor @kouba01 's assignment. He taught Crypto Trading Using Trix Indicator and at the end of his lecture he gave some questions for assignment. I will be responding to his questions one after the other.

1. Discuss in your own words Trix as a trading indicator and how it works

In this first task, I'm going to be discussing Trix indicator. Trix is a triple exponential average. Meaning it gets its name from the formula uses to calculate it which take into consideration three exponential moving average.
We know that there are three types of moving averages, simple, exponential and weighted moving averages. Simple average has a limitation in the sense that it is very slow to react to price changes, however, exponential is very fast to react, but sometimes it also reacts faster which may lead to wrong decision in the market. The idea of using triple exponential indicator is to solve this problem.
Due to the limitations of exponential moving average, reacting very fast to price fluctuation, traders take position which they ought not to take and the prediction goes against them because of the false signals. Triple exponential average indicator is designed to solve this limitation by involving in its formula three different exponential averages.
Although this indicator called Trix solve the issue of false signals and unnecessary fluctuation of price of an asset, but it doesn't give entry signal I the market. However, it's a very good indicator which can be used for identifying trend changes in the market. It works well when it's combined with other technical tools or indicators which give entry in the market.
How Trix Works
The working principle of Triple Exponential Average (Trix) is very similar to that of exponential moving average since its formula contains three of exponential moving averages. We know that exponential moving average is plotted on the chart as the price of an asset moves. However, Trix has its own indicator window.
It contains of a single line in its own indicator which oscillates to and fro the indicator window. This is unlike exponential moving average which is added on the price chart. The exponential moving average is very sensitive to price and reacts very fast to price action. However there's a limitation with it, but when it's compared with simple moving average, recent values is given more weight by exponential moving average.
Although exponential moving average being reacted fast to the price changes and more weight given to the recent values recent values is an importance but its also a weakness in the sense that there may be false signals in which traders may fall victim of taking them. Noticing this, Huston was very passionate to come up with a method which will solve this issue. Thus, proposing of Trix came into existence.
Trix was developed to combat the issue associated with simple and exponential moving average. The method of combining three exponential moving averages together to develop a more accurate indicator which will eliminate to some extent the issue of false signals of the exponential was actually given birth to Trix.
Like I said earlier, Trix has its own indicator window. It oscillates to and fro its window. This indictor shows when the price of an asset is bullish and bearish. When the line of Trix crosses above zero scale, it means the market is bullish and when it crosses below zero scale, it means the market is bearish. Trix can also be used to identify trend reversal in the market.

2. Show how one can calculate the value of this indicator by giving a graphically justified example? how to configure it and is it advisable to change its default setting? (Screenshot required)

In this part of the task, I'm going to be explaining how to calculate Trix indicator, how to configure it and state my opinion on whether it's advisable to change it's default settings.
Like we know, most of the technical indicators are calculated by using information of either the previous or recent prices such as high, low closing price and opening price. So, we will see how this is calculated. Like I said earlier, Trix indicator takes into consideration in its formula triple moving averages. Hence we need to see how exponential moving average is calculated first to better understand that of Trix.
The calculation of exponential moving average is very simple. It often uses the data of the past or previous price in its calculation. Majorly, it uses the closing price over a particular period. Traders can use any period of their choice to do the calculation. Mostly, 14 period or 15 period are always used when calculating the Trix. I will consider using 14 period here.
Now, the formula for calculating EMA is given as:
EMA = (CP × W ) + (p EMA) × (1- W)
Where,
CP = closing price
W=Weight
p EMA = EMA of the previous day
Now, since since we know the formula EMA, we can interpolate the data to get the triple EMA.
So, Double EMA will be
2 EMA = EMA (1 EMA)
where
1 EMA = First EMA
2 EMA = Double EMA
Then, we can also get the triple EMA
So, triple EMA will be,
3 EMA = EMA (2 EMA)
Where
3 MA = Triple EMA.
Hence, we can now calculate the Trix indicator. The formula for calculating it is given below.
Trix =[ 3EMA(CP) - 3EMA(CP - 1)] / 3EMA(CP- 1
Where
p = Closing price
The graph of Trix is given below.
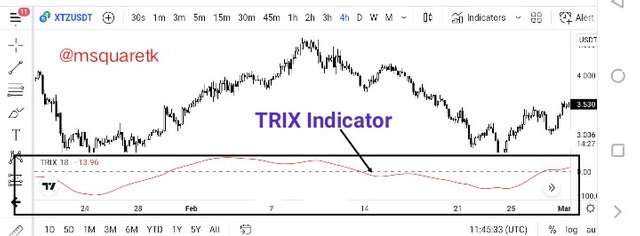
Screenshot from trading view | SOURCE
To configure the indicator, firstly add it to the chart. Then after adding it to the chart, click the gear like icon, the setting icon beside the indicator. It's circled in red in the indicator below.
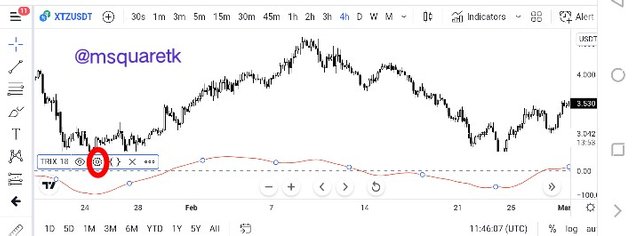
Screenshot from trading view | SOURCE
Once you click on it, you will see where to edit the Indicator. There are three features to edit there. You will see the input section, the style and visibility. Click the input and you will see the period or length for the indicator. The default settings is 18, you can change it to your liking.
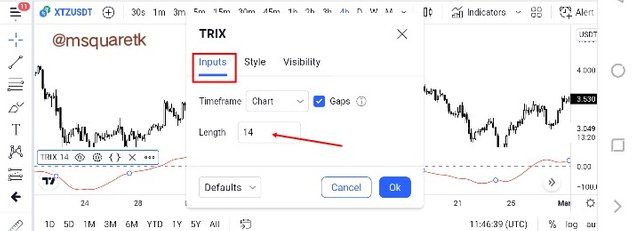
Screenshot from trading view | SOURCE
Traders can also change the color by going to the style. The default color of this Indicator on trading view is red. See he screenshot below.
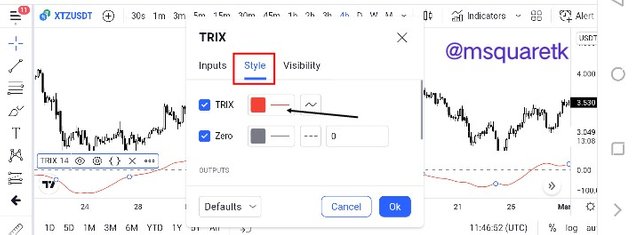
Screenshot from trading view | SOURCE
Traders can change the default settings of this indicator. Thanks depends on the trading strategy of the traders. However z it's pertinent that traders test different periods and see which one fits their strategy and suit their taste.
In the screenshot below, I have changed the period of the indicator to 14. Also, see that I have changed the color to blue. If you prefer any other color to red, you can change it. The only setting you need to be careful in changing is the period. You must be sure of your trading strategy and know if it fits it. Once it fits it, you can use any period of your choice.
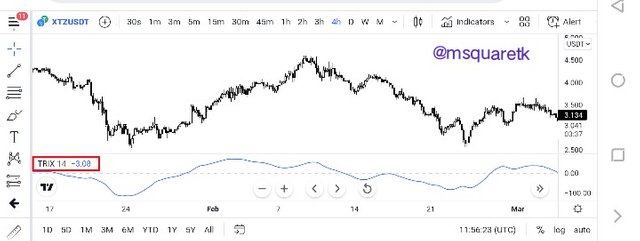
Screenshot from trading view | SOURCE

3. Based on the use of the Trix indicator, how can one predict whether the trend will be bullish or bearish and determine the buy/sell points in the short term and show its limits in the medium and long term. (screenshot required)

In this part of the question I'm going to be showing how to know if the trend will be bullish or bearish with the use of Trix indicator. Then i will show the but and sell points in the short term. Like I said earlier, EMA is a good indicator for identifying the trend of an asset. And since Trix indicator takes EMA into consideration , it's also good in determining or predicting the trend.
The Indicator, Trix has a scale of zero. The Lin of Trix goes to and fro this indicator and it crosses below and above the zero scale depending on the direction of price or trend.
The trend is said to be bullish when the line of Trix crosses above the zero scale. At this point the buyers are said to be gaining momentum to push the price of the market to the upside. Thus the crossing of Trix line above zero scale signifies an uptrend or a bullish trend. See the screenshot below.
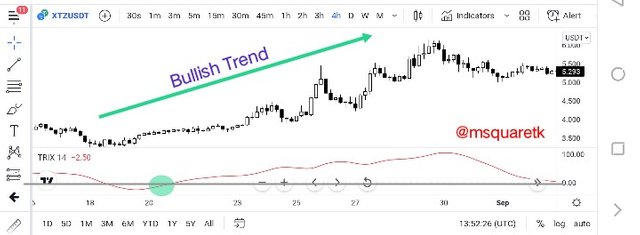
Screenshot from trading view | SOURCE
As it is seen in the screenshot above, the line of Trix crossed above the zero scale scale. That signifies that the trend is going to be bullish. And as we can see, the price rally to the upside.
Similarly, the trend is said to be bearish when the line of Trix crosses below the zero scale. At this point the sellers are said to be gaining momentum to push the price of the asset to the downside. Thus the crossing of Trix line below zero scale signifies a downtrend or a bearish trend. See the screenshot below.
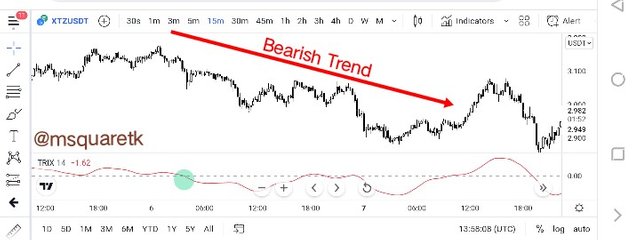
Screenshot from trading view | SOURCE
In the screenshot above, we saw how pro rallied to the downside after the Trix line crossed below the zero scale.
Trix indicator is very helpful and useful in filtering the signals. Hence, it's considered as one of the best trend indicators. It's very effective, especially in the long term. But in the short and medium term, we will be able to see its limit. I will be explaining its limit in short term with a graphic below.
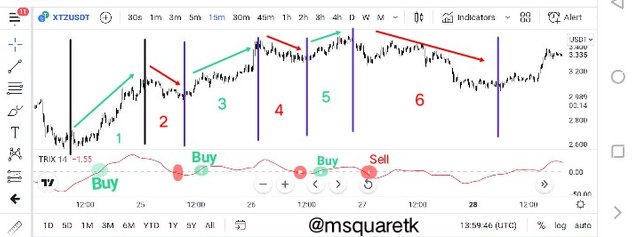
Screenshot from trading view | SOURCE
Overall, Trix indicator works well in a trending market. Then in short term, it works well by giving the signal in the direction of trend. Meaning if the trend is bullish, it will give accurate bullish signal. If you look at the screenshot above, you will notice the trend is bullish and the crossing of the line above zero represent bullish signal which was very effective for that bull trend.
For example in part 1, TRIX gave a buy signal and it was not lagging as we saw the line of Trix crosses above the zero scale and there was a bullish leg. But in part 2, which is the retracement of the bullish move, Trix gave a bearish signal very late as the whole move was almost over before the line of Trix crossed below zero scale.
In part 3 and 5, we can also see TRIX gave the bullish trend signal very early, whereas in part 4, the bearish trend signal was very much late. Now, if you look at the part 6, Trix gave a bearish trend signal early and we can see that the trend changed from bullish to bearish. Conclusively, we can say that Trix gives trend signal early if it's in the direction of trend.

4. By comparing the Trix indicator with the MACD indicator, show the usefulness of pairing it with the EMA indicator by highlighting the different signals of this combination. (screenshot required)

In this part of the task, I'm going to be comparing TRIX with MACD. In the previous question, I have already discussed how to determine the trend, that's whether it's going to be bearish or bullish by using Trix indicator and the crossing below or above the zero scale is very important in determining this. Now, we can also place sell and buy position when this indicator, Trix is at the extreme peak or bottom of its indicator window. But we normally use EMA of period 9 of Trix Indicator.
Now the MA and Trix will appear on an indicator window. They oscillates up and down. When the Trix line crosses the moving average line upward, long position could be taken by the traders because it's a signal for buy. Also, when the Trix crosses the moving average downward, traders could take short position because it's a signal for sell.
I have compare this indicator with MACD by using a graph below. Let's see this graph and examine it.
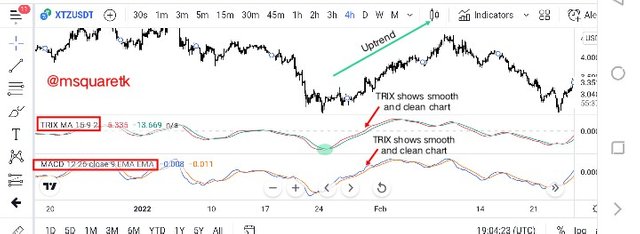
Screenshot from trading view | SOURCE
In the screenshot above, I have added 9 period moving average with 15 period Trix and MACD (12,26,9). Although both indicator have almost similar line oscillating to and from their indicator windows, but there is difference between the two. We can also see that these indicators have zero scale and their lines cross below and above the scale depending on the direction of price.
Furthermore, looking at these two indicators, we can see that the Trix shows a very clean and smooth chart compared to MACD. The MACD chart is not clean and smooth. It shows too much noises whereas Trix filters all the noises.

5. Interpret how the combination of zero line cutoff and divergences makes Trix operationally very strong.(screenshot required)

In this part, I'm going to be explaining how the combination of zero line cutoff and divergences makes Trix operation to be more effective I determining the trend. Remember I said earlier that Trix has zero scale and its line goes up and down this scale. When the line of Trix crossed above zero, it's a signal that the trend will be bullish and when it crosses below zero scale it signals a bearish trend.
Now, when the price has been extremely oversold or overbought, and the sellers get weakened in a downtrend or buyers get weakened in an uptrend, divergence may form. And divergence is a signal for reversal in the market.
A bullish divergence occurs when the price makes lower lows and the line of Trix makes higher low. This is a sign that the sellers may be out of the market very soon and the buyers will take over the market. It's a signal for a bullish run or trend. Then, once this happens, a cross above the zero scale of the Trix indicator also confirms a change of that trend. See the screenshot below.
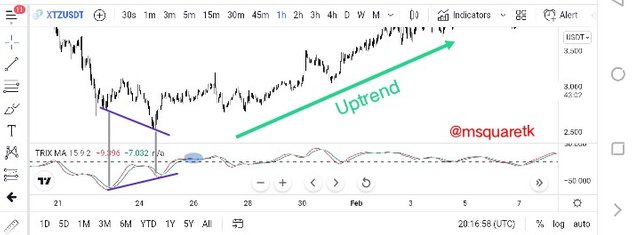
Screenshot from trading view | SOURCE
In the screenshot above, we can see that a bearish divergence occurred and follow by a cross above the zero scale and the trend changed and price rallied to the upside.
A bearish divergence occurs when the price makes higher high and and the line of Trix makes lower high. This is a sign that the buyers may be out of the market very soon and the sellers will take over the market. It's a signal for a bearish run or trend. Then, once this happens, a cross below zero scale of the Trix indicator also confirms a change of that trend. See the screenshot below.
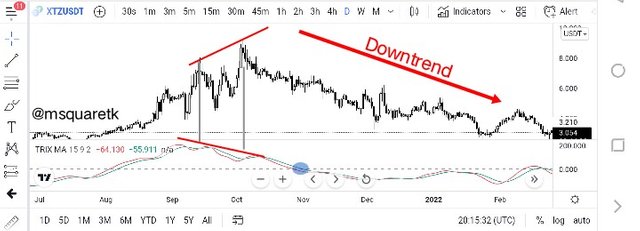
Screenshot from trading view | SOURCE
In the screenshot above, we can see that a bullish divergence occurred and follow by a cross below the zero scale and the trend changed and price rallied to the downside.

6. Is it necessary to pair another indicator for this indicator to work better as a filter and help eliminate false signals? Give an example (indicator) to support your answer. (screenshot required)

In this part of the task, I'm going to be stating why it's necessary to pair other technical indicator with Trix. Like I have discussed earlier, Trix indicator is very good indicator for identifying the price trend in the market. I have discussed this importance of zero crossing in identifying the trend. Remember I said when the price crosses above zero scale, it's a signal for bullish trend and when it crosses below zero scale, it's a signal for bearish trend. It's however pertinent to know that this indicator can give false signal.
Generally, technical indicators give false signals and it's advisable not to be using an indicator to predict or take trading decisions in the market. That's why traders are often encouraged to combine at least two indicators together and read them to have confluence before they take position.
Here, I'm going to be combining one of the best indicators that works well with Trix indicator. We will see how the indicator will help filter false signals. Therefore, the name of the indicator I will combine with Trix is Aroon Indicator.
Aaron indicator is a trend-based indicator. It's used to identify trend and trend change in the market. It also measures the strength. It consists of two lines in its Indicator window, Aroon up line and Aaron down line. When the up line is above the down line, the trend is bullish and when the down line is above the up line, the trend is bullish. Thanks crossing of these lines signifies a change in trend and buy or sell signals.
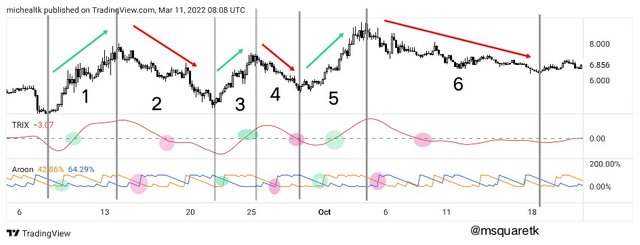
Let's see how Aroon and Trix indicator are combined paired together. In the screenshot below, you will see that I have added the two indicators to the chart.
Screenshot from trading view | SOURCE
Looking at the Indicator window of Aroon, we saw two line, yellow line(Aroon up line) and blue line (Aroon down line). They both oscillates together. Now, let's see the signal they give. You will notice that buy signal is given when the Aroon up line crosses above the Aroon down line and sell signal is given when the Aroon down line crosses above Aroon up line.
In part 1, Aroon gave a buy signal and not too long we saw a bullish trend signal from Trix indicator too. So that means a trader could have capitalized on that buy. Same thing happened in part 2, although both Indicator delayed a bit.
In part 4, Trix indicator delayed and if a trader has jumped in the market when it gave a sell signal, the price would have rightly reversed in his presence. So, it's better not to use Trix indicator as a standalone tool.

7. List the pros and cons of the Trix indicator

In this part of the task, I'm going to be listing the pros and cons of the Trix indicator. Let's start with the pros.
Pros of Trix Indicator
- Trix indicator is a very good indicator for trend identification. It shows when the trend is bullish or bearish.
- It combines triple exponential average in its formula which is very much effective than a single exponential moving average.
- Trix divergence strategy can be used to determine reversal in the market.
- It works effectively well when combined with other indicator
Cons of Trix Indicator
- Trix indicator sometimes lag behind. The trend would have started and even almost finished before the indicator will identify the trend.
- It gives false signals. That's why it's advisable not use an indicator as a standalone tool.

Conclusion

Technical indicators are very useful in technical analysis. They are used to predict the direction of price of the asset. I have discussed extensively on Trix (Triple Exponential Average) indicator. Trix indicator is used to determine or identify the trend of the asset. It consists of a single line which oscillates up and down its indicator window. It has a zero scale which this line crosses above and below. The cross above zero scale is an identification for bullish trend, while the cross below the zero scale is an identification for bearish trend. Its divergence is also useful to spot trend reversal in the market.
Trix indicator is very similar to MACD. However, they are different in the sense that Trix indicator filter noises in the market, whereas MACD shows the noises. We can see this when Trix was compared with MACD.
Although Trix indicator is shows trend in the market and filter the noises, but it's advisable not to use it alone because of its limitation. Hence, it is effective and efficient when it's combined with other technical indicator. In this post, I have combined it with Aroon indicator and we saw how it help filter false signal.
Thanks to Professor @kouba01 for this insightful and educative lecture. I have learnt one or two things from this lecture.

CC: @kouba01
@steemcurator01
@steemcurator02
Written by @msquaretk
Good day Prof. @kouba01. I hope you are good.
I will like to call your attention to this. I have not received upvote from steemcurator 01 as one of the top gears of the week in your class.
Also, I have not received upvote from steemcurator 02 for my assignment I submitted. This is my repost. Please help call their attention to it.
Thank you.
@kouba01
Ok.
Thanks. I meant, I have not. Post edited.