REPOST — Basics to trade cryptocurrencies correctly. | Part 2 - Crypto Academy / S6W3 - Homework post for nane15.

Cover page created by me, @msquaretk | made on imarkup app
It's a new week in the Steemit Crypto Academy. This is the week 3 in the Academy. The past two weeks of lectures was wonderful and the two weeks of trading competition were full.of experience. Thanks to the Admins and all the Professors in the Academy. This post is written in response to Professor @nane15 's assignment. He gave us questions to answer after his lecture. I will be responding to his questions one after the other. Follow me closely.

1. Explain your understanding of charts, candlesticks, and time frames. (Use your own words and put screenshots)
In this first task, I'm going to be explaining charts, candlesticks and timeframes.
CHART
Charts is one of the most important part in technical analysis. In fact, without chart, there's no technical analysis. From our elementary economics, we know what chart is. We we're taught different types of chart, bar chart, pie chart etc. There are many types of chart in finance trading which traders use to do the analysis. Below is the examples of different types of chart:
- Japanese Candlestick Chart
- Line chart
- Bar chart
- Heiken Ashi etc
Chart in finance trading show the behavior of sellers and buyers over a particular period of time. It shows information of what has happened in the past to a particular asset, how buyers and sellers are reacting to the price of an asset and the movement of price, downward and movement of price of the asset. It also show what's going on in the present.
Traders gather information about an asset by looking at the chart to see what has happened in the past and what is happening in the present so they can know what's going to happen in the future.
Screenshot from Mt4 App
The screenshot above shows an example of a type of the chart. We can see how the price was going up and down. It shows how buyers and sellers react to price over a particular period of time. There was a time buyers took over the price and the price is seen to be rising and another time, the sellers took over and price goes to the downside.
CANDLESTICK
Candlestick is one of the components of the chart. It's the one which represents the price movement on the chart. Although there are different symbol to use to represent how price moves on the chart. In fact, these are what's given rise to types of chart. For example, line can be used. When line chart is used on the chart, the chart is called line chart. Candlestick has been one of the most effective One because of the tons of information it shows on the chart.
Candlesticks are of different types and each type shows unique information about what sellers and buyers do over a particular time. Some of the types of candlestick are, Doji, Harami, hammer, inverted hammer etc.
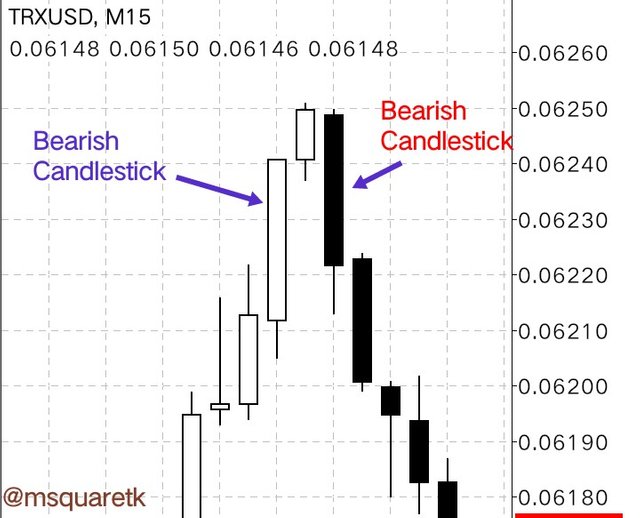
Screenshot from Mt4 App
The screenshot above shows candlestick on the chart. Generally, candlesticks are of two kinds: bullish candlestick and bearish candlesticks. The candlestick that forms when the price of an asset increases is called bullish candlestick. While the candlestick that forms when the price decreases is known as bearish candlestick.
Majorly, the color of bullish candlestick is green and bearish is red. But in mt4, the default color of bullish and bearish candlestick is white and black, respectively. It's pertinent that you can change the color to suit your taste. What is important is to identify if the candle that forms is bullish or bearish.
A Candlestick comprises of
- Body
- Wick
- Low
- High
- Opening price
- Closing price
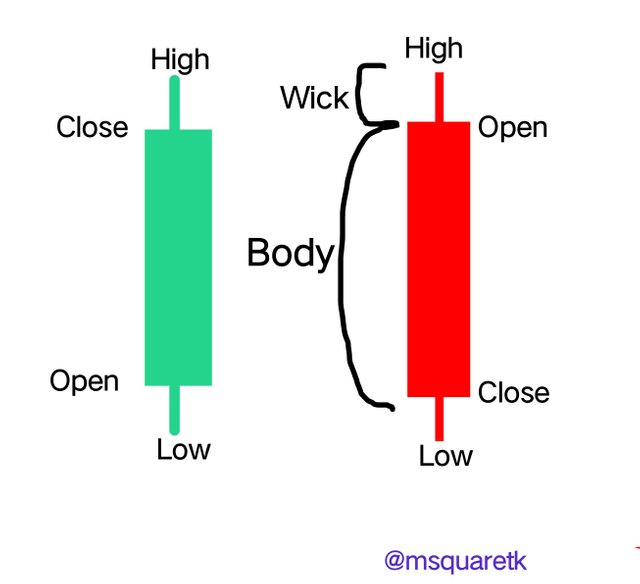
Made on imarkup app
TIMEFRAMES
Time frames are different time which chart can be shown to see much more details in which a particular timeframe can not show. A timeframe will show an information of an asset of that particular time. For example if you want to see an information or what price does on a day, you will can switch to a daily timeframe. When a candlestick chart is used, you will see only a candlestick for that particular day.
Now, but with a candlestick on daily timeframe, you may not know what has actually happened during the day. A daily candle can show a bullish candle, whereas during the day, sellers may have also participated in the market. Switching to lower timeframes will let us know if we have had sellers take part in the market and how much they influence the price.
In the screenshot below, you will see that a bullish candle is currently forming on a daily timeframe the th Chart of TRXUSD. But, if we see to other timeframes, we should be able to get more information regarding what the price is doing.
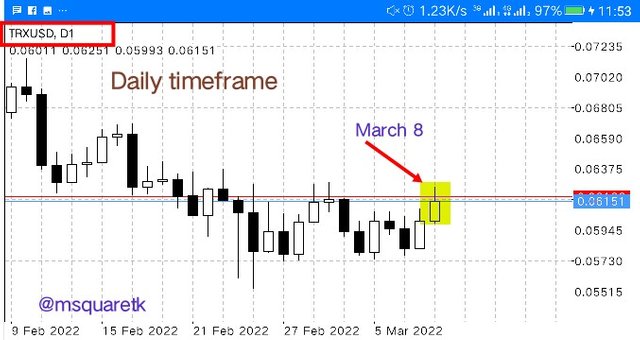
Screenshot from Mt4 App
On H4 timeframe, we can see many candles and this will tell us more about the reaction of buyers and sellers.
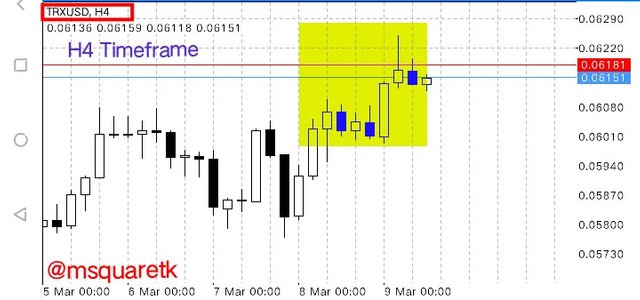
Screenshot from Mt4 App
On H1 timeframe the day, March 8 started on a retracement leg, the short bearish leg. But at the end of that bearish leg, bullish engulfing pattern formed. Traders can capitalize on this if they have done there analysis very well. See the importance of using different timeframes.
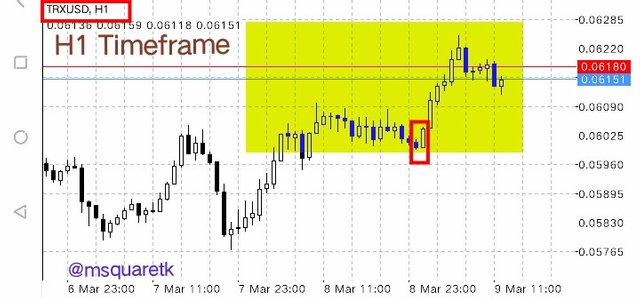
Screenshot from Mt4 App
Then, we con a 15 minutes timeframe, we also saw many information and the behavior or sellers and buyers on this timeframe.
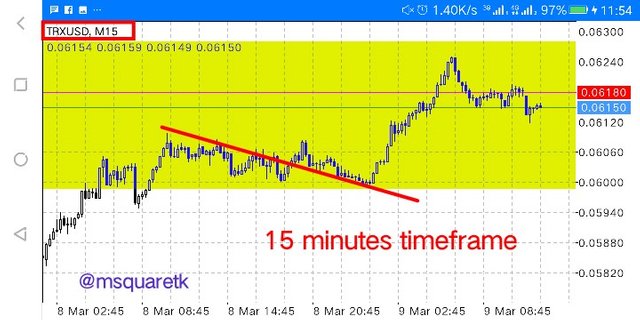
Screenshot from Mt4 App
There are many importance of using different timeframes for analysis. It helps us reduce risk. For example a trader can do his analysis on a higher timeframes and come to lower timeframe to take a position. This will definitely reduce his stop loss and thereby decreasing his risk.
Further, there are specific information which a timeframe may not show. But by using multiple timeframes, we can actually see these information and capitalize on them to either enter the market or stay a way for a while.
2. Explains how to identify support and resistance levels. (Give examples with at least 2 different graphs)
Here, I'm going to be explaining how to identify support and resistance levels. Support and resistance levels are very important on the chart and it's important that traders learn to identify and draw them correctly on the chart.
There are about two types of support and resistance which are drawn on the chart. The two types of support and resistance are:
- Static or horizontal support and resistance
- Dynamic or sloppy support and resistance.
Static or horizontal support and resistance is a type that forms in a ranging market. It's often formed when the price of an asset seems to undergo a pause in the market. Horizontal resistance and support are represented by lime or zone on the chart. It's advisable to treat support and resistance as zone and not as line.
Support and resistance are areas where price is likely to bounce back and change the direction. Hence, buyers gather at the support zone or level because they know there's probability that there's a change in the direction of price when are hits the area. And sellers gather at the resistance level because of how the price had rejected the zone in the past and they know if price hits it again, there's tendency for a change of direction.
To recognize and draw support and resistance correctly, you need to look open your chart and pick your drawing tools.
- Look for a clean chart and zoom out the chart to clearly see it.
- Identify areas where price has supported and resisted more than two times
- Draw a zone by connecting these areas together for support and resistance levels.
In the screenshots below, you will see an example of support and resistance I have drawn on two different chart. See how I did the drawing.
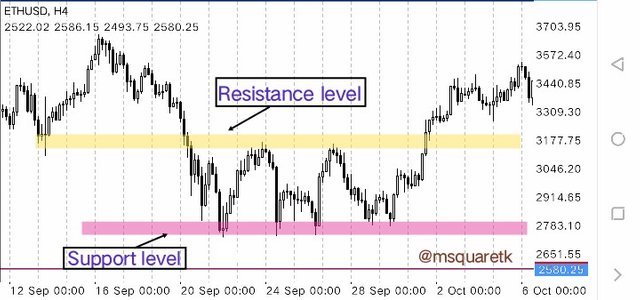
Screenshot from Mt4 App
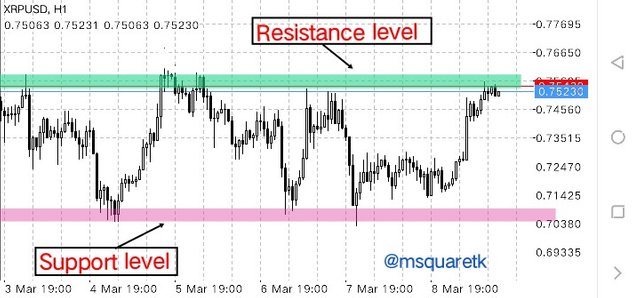
Screenshot from Mt4 App
Dynamic or sloppy Support and resistance is another type of resistance which traders look out for. It's the type that forms during a trending market. And that's how the name dynamic comes into being. This type of support and resistances are not static; the move.
Trendlines are used to identify or represent dynamic or sloppy support and resistances. It's pertinent to note that technical Indicators, trend-based indicators such as moving averages, bollinger band etc. can also be used to identify dynamic support and resistance.
During an uptrend, support is always drawn to tame the price and to be able to join the current trend after the end of a pull back. To correctly draw support in an uptrend:
- Correctly identify if the market is in an uptrend by using market structure. If the price makes higher highs and higher lows, then the market is in an uptrend
- After identifying the market trend, draw a trend line connecting the higher lows of the price together. At least two lows must be connected together perfectly.
- If the lows don't match, don't false it. Look for another chart in which they match.
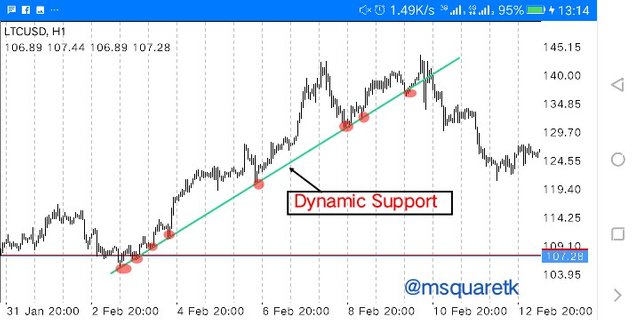
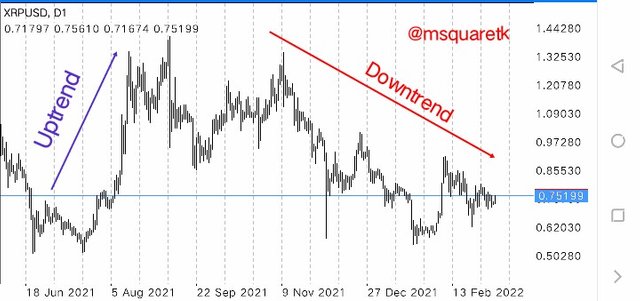
Screenshot from Mt4 App
During a downtrend, resistance is always drawn to tame the price and to be able to join the current downtrend after the end of a successful pull back. To correctly draw resistance in an downtrend:
- Correctly identify if the market is in a downtrend by using market structure. If the price makes lower lows and lower highs, then the market is in a downtrend.
- After identifying the market trend, draw a trend line connecting the lower highs of the price together. At least two highs must be connected together perfectly.
- If the highs don't match, don't false it. Look for another chart in which they match.
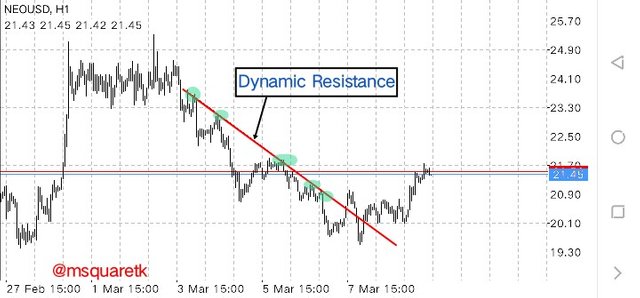
Screenshot from Mt4 App
3. Identifies and flags Fibonacci retracements, round numbers, high volume, and accumulation and distribution zones. (Each one in a different graph.)
In this part of the task, I am going to be explaining how to identify Fibonacci retracement, round numbers, high volume and accumulation and distribution zones. Let's start with Fibonacci retracement.
Fibonacci Retracement
One of the most important tools in technical analysis is fibonacci retracement. The tool is used by by many traders because of its effectiveness in predicting the direction of price.
It's used to identify potential support and resistance on the chart. And it's best used in trending market. That is when marketing is trending to the upside or to the downside.
The fibonacci retracement tools has fibonacci numbers which is in percentage. These numbers are significant numbers that when the price hits them, it's likely going to bounce back. On the chart, the lines of Fibonacci retracement tools are seen with the numbers beside or at the middle of these lines depending where the traders position the numbers.
Fibonacci retracement can be drawn on a bullish and bearish market. To draw Fibonacci retracement during an uptrend market, we start the drawing by placing the fibonacci retracement from the origin in view (low of the price or support level) to the next significant resistance level.
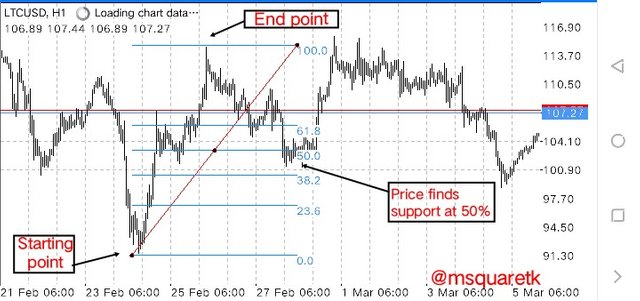
Screenshot from Mt4 App
To draw fibonacci retracement on a downtrend market, we start the drawing by placing the fibonacci retracement tool from the origin in view (high of the price or resistance level) to the next significant support level. See the screenshot below.
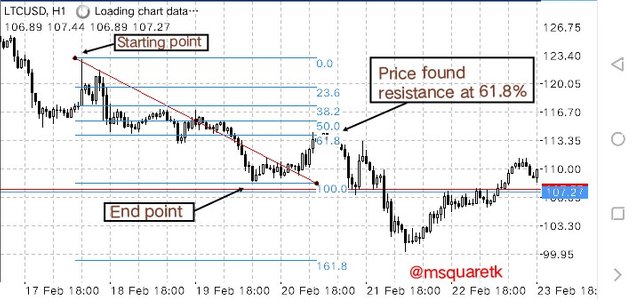
Screenshot from Mt4 App
Round Number
Round number is one of the concepts in finance trading which is believed that price has a tendency of reacting to round number and finds it difficult to break the area. This round numbers are used by traders to see what the price would do when it approaches or is on them.
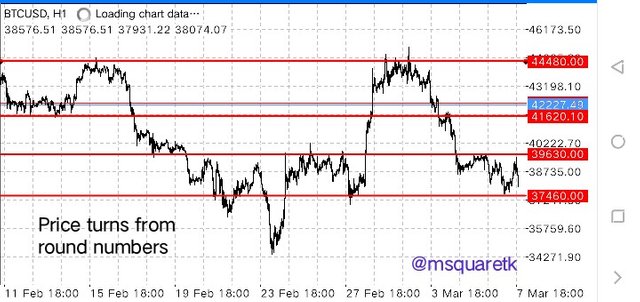
Hence, round numbers can be used to identify support and resistance on the chart. When the price touches these round numbers, it's expected that the price bounce back. In the screenshot below, I have identified some round numbers on the chart of BTCUSD. See the screenshot below.
Screenshot from Mt4 App
In the screenshot above, we can see how price turns on the round numbers. See multiple rejections of price on these round numbers identified in the screenshot above. We can use them as support and resistance and watch what price will do when it gets to them. For example, see how price rejected $39630 and it's currently close to another round number of $37460.
High Volume and accumulation and distribution
Here, explain another concept which is very important in technical analysis. Volume is very important when we are talking about the reaction of sellers and buyers in the market and as such, I'm going to be explaining the behavior of volume when we have accumulation and distribution of price.
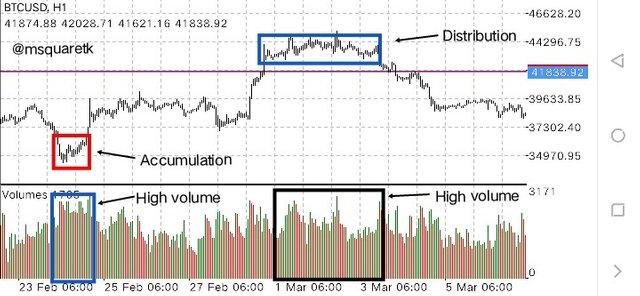
Accumulation and distribution are terms which every traders should know but they also need to understand them.in practice because of the major role they play in finance trading. Accumulation occurs at the extreme low area of price while distribution occurs at the extreme peak area of price.
Accumulation occurs as result of the gathering of buyers at an oversold area of price. This means, it's always happened when the price of an asset has been oversold. At this time, the sellers are exhausted and buyers are ready to take over the market. The accumulation phase is actually a discount price level. This enables buyers to accumulate more of the asset because of the discounted price.
Distribution, however occurs at the extreme peak area of price. Buyers gather here because the price has been overbought and it could not go any more higher at that particular time. At this time, the buyers who have accumulated the asset at a discount price can't hold the asset because the price may reverse and hence, they will take profit and exit the market. Sellers distribute the asset as result of the premium price level which an asset is.
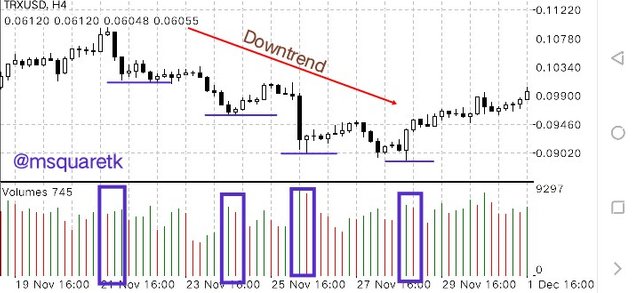
Now, explaining the volume with this concept. When there's accumulation and distribution at the bottom and top of a trend, there's always a high volume due to the momentum with which then sellers and buyers pushes the price to these phases. See the screenshot below.
Screenshot from Mt4 App
It's also important that the phases of accumulation and distribution show no main direction, this means no too much interaction between the buyers and sellers during these phases until a breakout occurs and the price goes in favor of the buyers for accumulation and I favor of the sellers for distribution.
4. Explain how to correctly identify bounce and breakout
Rebounce and breakout are terms used in cryptocurrency trading. Rebounce occurs when the price hits a key level area, either support and resistance and the price turns to the opposite side. For example, if the price is coming from a low area and meets a key resistance area and the price get stucked and reverse to the downside, then what happened is said to be a rebounce. Also, if the price is coming from a high area and meets a support level, and the support supports the price that the price turns to the upside, then that's called rebound.
A breakout however is a scenario where the resistance cannot resist or support cannot support the price. Hence, the price breaks these key levels and continue in the same direction. Usually, when there's a breakout of a level, the price is expected to continue in the same direction unlike that of rebounce when the price will turn back and change direction.
See the screenshot below.
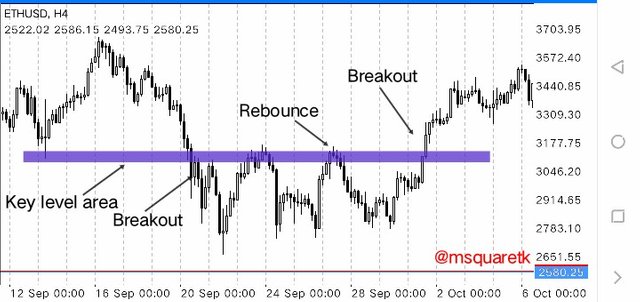
Screenshot from Mt4 App
As it can be seen in the screenshot above, the price rebound at a key level area and after some time, the area weakened and the price broke the area.
5. Explain that it is a false breakout. (Screenshots required.)
In this part of he question, I'm going to be explaining the false breakout. Resistance and support zone may get broken and later comes back to the range and price reverse to the opposite direction.
A false breakout occurs when price breaks the range of the price and quickly comes back to the range. It is always done to induce the buyers or sellers in the market. A false breakout can occur at the support zone and the resistance level.
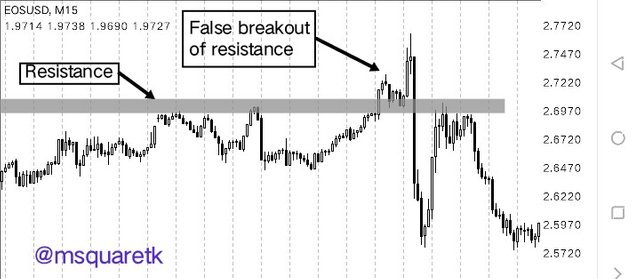
Screenshot from Mt4 App
When it occurs at the support level, it's called a false breakout of the support and when it occurs at resistance level, it's called a false breakout of the resistance level.
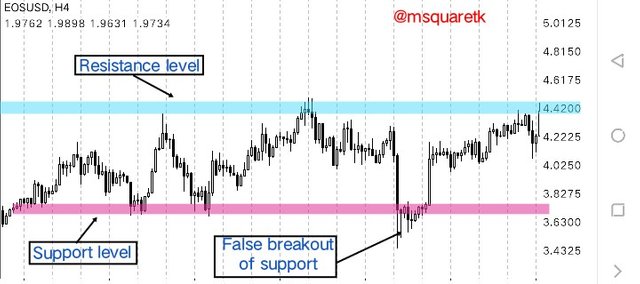
Screenshot from Mt4 App
Most of the times, a false breakout is always initiated by the institutional trades and whales to induce the retail traders. It's important that the retail traders learn how to identify false breakout. Some other technical tools or indicators are always combined with support and resistance levels to filter the false breakout.
6. Explain your understanding of trend trading following the laws of supply and demand. It also explains how to place entry and exit orders following the laws of supply and demand. (Use at least one of the methods explained.)(Screenshots required.)
In this part of this task, I'm going to be explaining how to trade trend following the law of demand and supply and how to place entry with the same law.
Trend Trading Following the Law of Demand and Supply.
We all know the law of demand and supply from our elementary economics. We know that when demand increases, there's going to be an increase in price of the commodity and when supply increases, there's going to be a decrease in the price of such commodity. The same principle is applicable in finance trading.
We see the price of an asset rising when demand is greater than supply. This means more people are accumulating the asset and the price keeps rising. On the chart, you will often see the candles makes a series of higher highs which is an identification for an uptrend in the market. During this rising if price, the volume of the bull candle will be seen increase while that of bear decreases. See the screenshot below.
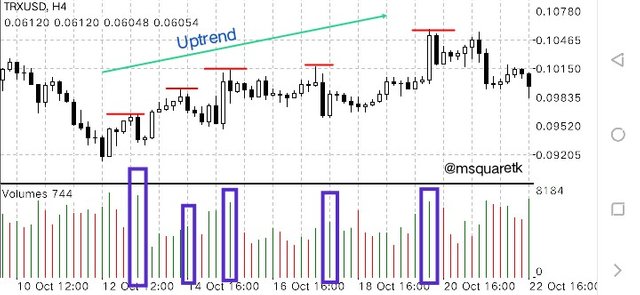
Screenshot from Mt4 App
Similarly, when supply is greater than demand, the price of an asset will decrease. This means more people are distributing the asset and the price keeps dropping. On the chart, you will often see the candles makes a series of lower lows which is an identification for a downtrend in the market. During this dropping of price, the volume of the bear candles will be seen increase while that of bull decreases. See the screenshot below.
Screenshot from Mt4 App
Placing Entry and Exit Following the Law of Demand and Supply
Here, I'm going to be discussing three ways to enter the market following the law of Demand and Supply. These three are:
- Final retracement following Elliot wave
- Entry after pull back
- Market Trap.
Let's start with the first one.
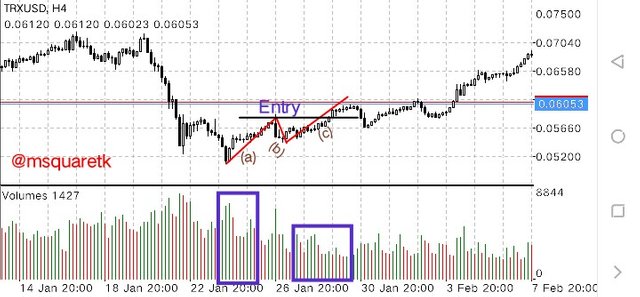
Final Retracement following Elliot wave
We know the Elliot wave which says, there are two waves, impulse and corrective waves. And that each complete market cycle must have five waves. Then retracement should follow where they will be wave abc.
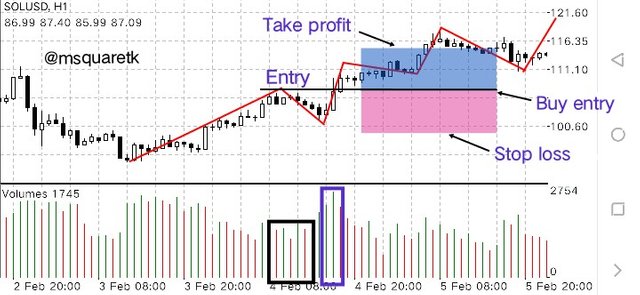
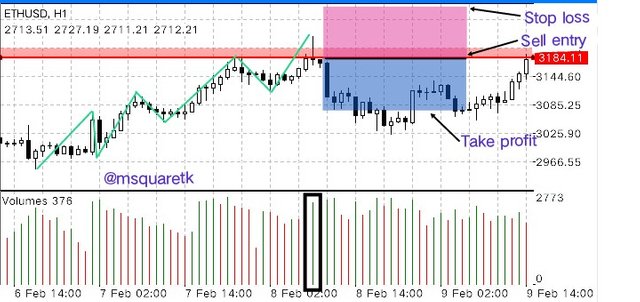
So in this strategy, we will wait for the end of wave. Meaning if the market is bullish, we wait for the bullish run to be over and if the trend is bearish, we will wait for the bearish run to be over. Once it's over, we start counting wave abc. Wave c when formed should have lower volume than wave a. And wave is expected to have a high volume. See the screenshot below.
Screenshot from Mt4 App
The stop loss should be placed below the wave c and take profit should be placed to have a risk reward of 1:1 or 1:2. See the screenshot below
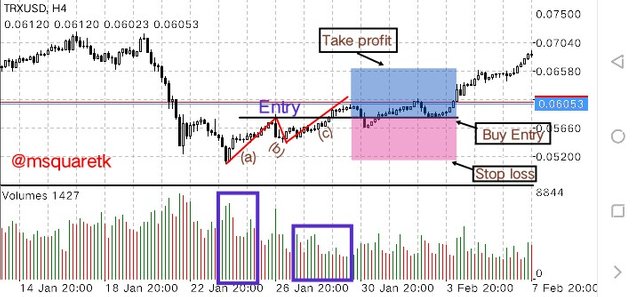
Screenshot from Mt4 App
Entry After Pull back
Entry after pull back is a strategy used in a trending market in which the traders want to join the current trend. Now, to join the trend, it's better to wait for the pull back to be over and join successfully when a new impulsive leg starts. Actually the retracement leg should have a low volume and there should be a candle in the direction of the new impulsive leg with a high volume.
An example of what I'm saying is attached below. In the screenshot, you will see that the retracement has a low volume, but at the process when the price breaks the previous high with a candle, there was a higher volume. Entry can be taken at this time. See the screenshot below.
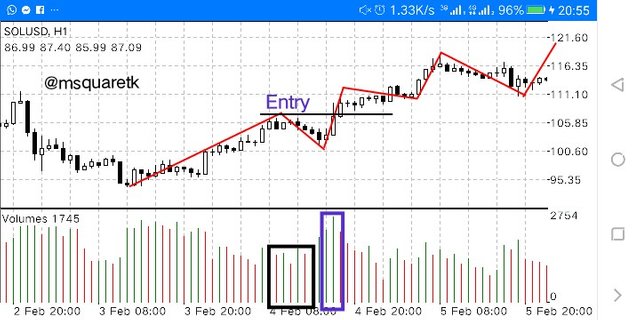
Screenshot from Mt4 App
The stop loss should be placed below the current low created before the new impulsive move started and take profit should be set to have a risk of 1:1 or 1:2.
Screenshot from Mt4 App
Market Trap
We can also use the strategy of market trap to take advantage in the market. Market trap occurs when a key level, support or resistance breaks very quickly and the price comes to support such a support or resistance such a resistance. It's a trap to induce the retail traders by institution traders and whales. In essence, it's a false breakout which we can take advantage of.
Entry can be made after the false breakout, and the stop loss placed above or below the false breakout and depending on the trend. Take profit should be placed to have a risk of 1:1 or 1:2.
Screenshot from Mt4 App
7. Open a real trade where you use at least one of the methods explained in the class. (Screenshots of the verified account are required.)
In this task, I'm going to be explaining how I took a real sell trade of NEOUSDT using one of the methods explained by Professor @nane15. The methods is final retracement following Elliot wave. And I'm going to be entering taken into consideration the law of supply and demand.
On the chart of NEOUSDT , 30 minutes timeframe, the price is seen on a bullish trend. But at the peak of this uptrend, wave abc formed which is what we normally wait for at the extreme peak or bottom of the trend. So, since I have seen wave abc form, I checked the volume Indicator to see if the volume of wave c is lesser than that of wave a. And behold, it's very lesser than wave a. This is one of the confirmation that I can enter the sell position.
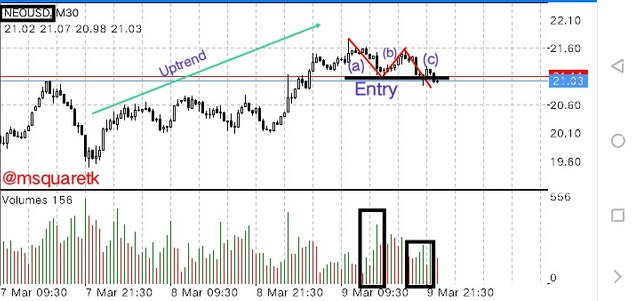
Screenshot from Mt4 App
Having gotten this, I entered at our entry point. The stop loss was placed above the start of wave c, at $21.65 and take profit was placed to have a risk reward of 1:1 at $20.66. See the screenshot below.
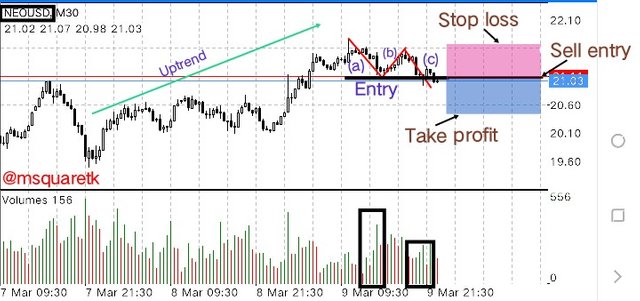
Screenshot from Mt4 App
Upon having the entry and exit price levels from the Mt4 app, i opened a real sell position on my binance exchange app using the margin trading option. The stop loss and take profit was set appropriately. See the screenshot below.
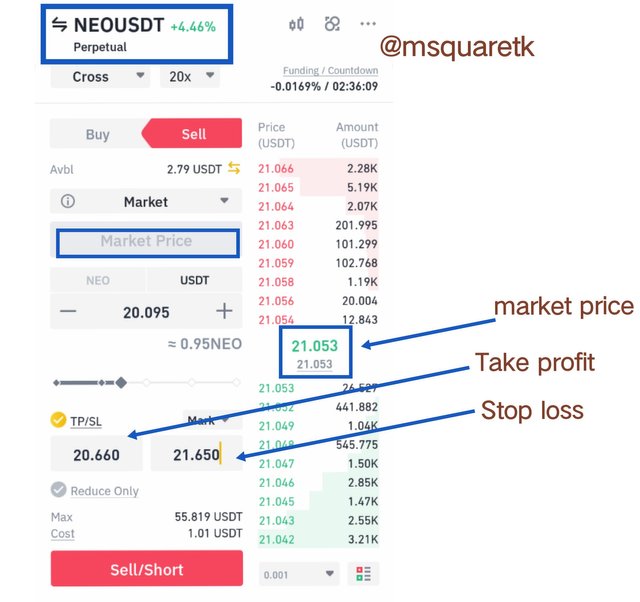
Screenshot from Binance App
Then the screenshot below shows the trade NEOUSDT after placing the trade. It's still running. I will be monitoring the trade.
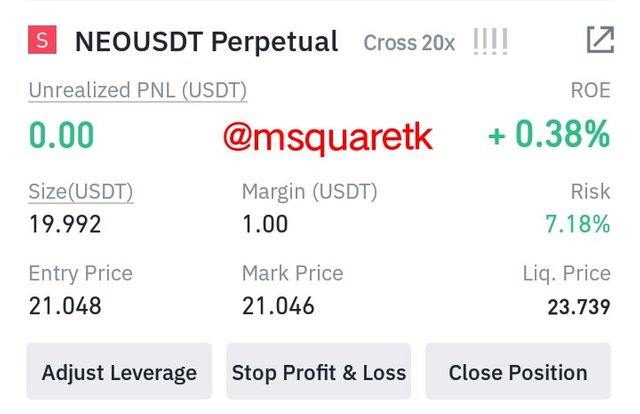
Screenshot from Binance App
Conclusion
In this post, i have talked extensively on many technical tools and strategy which can be used to predict the direction of price. Support and resistance are very important in technical analysis. Traders need to correctly identify them and draw them on the chart before trading. They can be used for entry and exit in the market. The use of multiple timeframes should also be employed by the traders to see as much as information which can be used in taking position.
Rebounce and breakout is one of the things traders should look for on key support and resistance levels. Accumulation and distribution with high volume can be used to take a long or short in the market.
We have also talked about the entry using the law of demand and supply and we talked about three methods which we can use to take position in the market. I have used one of these methods to take a real sell trade on my binance app after doing the analysis on Mt4 app. Thanks to Professors @nane15 for this insightful and educative lecture.
CC : @nane15
@steemcurator02
Written by @msquaretk
Hi Prof. @nane15. I hope you are good.
Please I will like to call your attention to this. I have not received upvote from Curator 02. This is my repost.
Also, I was among the top three gears of the week in your class, I noticed that remaining two people have received upvote from Curator 01 , but I have not received.
Please help me look into this and call attention of both Curators to this.
Thank you.
CC: @nane15
Hello, I hope you are well too, I will review your publication. And I will notify if necessary, good day.