Recognizing Simple Patterns in Trading - Crypto Academy / S5W2 - Homework Post for @sachin08

Cover Page created by me, @msquaretk | created with imarkup app
Hello everyone.
We are already in the second week of the season 5 in the Crypto Academy. The previous week was awesome. This post is written in response to Professor @sachin08. He taught "Recognizing Simple Patterns in Trading" and explained it very well. Some basic and simple chart patterns such as triangles and flag patterns were taught. He explained that how these patterns form and how to trade using them.
At the end of his lecture, he gave us about four questions to test our understanding about the topic. So, in the next paragraphs, I will be attending to these questions one after the other. Follow me closely, please.

1. What is your understanding about Triangles in Trading. Explain all forms of triangles in your own words. (Screenshot required)
Here, I am going to be explaining triangles in trading. In technical analysis, there are tools which traders use to predict the movement or direction of price. One of these tools is chart patterns. Chart patterns comprise of the formation of several candlesticks pattern on the he chart.
Triangle patterns are the pattern that occur during a trending market which often signifies continuation in trend. They are majorly consolidation in price after the movement of a prevailing leg. These consolidation moves in side way and the trend lines are used to join the lows and high of prices during this time. The price will be seen converging until a breakout occurs.
There are three types of triangle pattern which traders look out for in order to join the continuation of the prevailing trend. Once the breakout of these patterns occur, traders open a sell or buy depending on the direction of the breakout. These are: ascending, descending and symmetrical triangle. Let's see these types one after the other.
Ascending Triangle
Ascending pattern is a type of triangle pattern which is found in a bullish trend. It occurs after a bullish leg has been formed. Then, the market consolidates before another bullish run will happen. It comprises of a flat upper trendline and a rising or ascending lower trendline. The rising trendline makes high lows indicating buyers' strength to the upside. Whereas, the flat trendline shows multiple touches of price which is the resistance, showing that the sellers want to make a move. But, because buyers are strengthened, the price breaks to the upward.

Ascending Triangle Pattern | Screenshot from my MT4 App
Descending Triangle
This is another triangle pattern which is often found in a bearish trend. After a bearish move downward, the market consolidates and moves side way. The highs and lows of this consolidation are joined together with Trendlines. This pattern consists of a flat lower trendline which shows that the sellers are still with great momentum as the price is making lower highs and a descending upper trendline which is a support. The price will break through the flat lower trendline. Once the price breaks, the sellers open a sell entry after the close of the candle that breaks the flat trend line.

Descending Triangle Pattern | Screenshot from my MT4 App
Symmetrical Triangle
Symmetrical Triangle is another type of triangle pattern. This is different from ascending and descending Triangle in the sense that, there's no flat trendline here and that the pattern is neutral. Meaning it can break to any side of the trend. It comprises of two converging trendlines in which one is a descending trendline and the other is an ascending trendline. It should however be noted that breaking of this pattern majorly favours the direction of the prevailing trend. That's, if the trend is bullish, and this pattern forms, it's likely it breaks to the upside and if the trend is bearish, it's likely it breaks to the downside.

Symmetrical Triangle Pattern | Screenshot from my MT4 app
As it is seen in the screenshot above. The symmetrical pattern forms and breaks to the upside because the prevailing trend is bullish. Traders open a buy trade once the pattern breaks, at the close of the candle that breaks the pattern.
2. Can we also use some Indicators along with these Triangle Patterns? Explain with Screenshots
One of the best strategies is not a single tool in finance trading. This is because, a tool is not enough. There's what is called confluence in trading. Confluence is having more than one reasons to went or exit trade. It's the point at which two or more tools give the same signal.
We can use some indicators along with triangle patterns, too. This will increase our chances of winning. Combining one or more indicators with these patterns will enable us to see if the pattern is right or not. For example, a symmetrical pattern is forming and we don't know where it will break to, whether to the up or down. But if we combine one technical indicator with it, we may have seen the signal the indicator is giving, by then we will prepare to join the side where many people want to go in the market.
One of the type of indicators that can be used with this pattern is oscillator based indicator. Also, volume based indicators is also suitable to combine with these patterns. This will show us which side the volume is increasing to.
Now, I am going to explain how technical indicators can help us to increase the winning rate of these patterns. One of the oscillator based indicators that can be combined with these triangle patterns is Stochastic oscillator. Stochastic oscillator is an indicator which comprises of two lines which oscillates to an fro on the indicator window.
Stochastic oscillator is scaled from 0 to 100. The scale of 0-20 is known as oversold region, between 20 and 80 it's neutral, while 80–100 is known as overbought region or zone. When stochastic enters oversold region, it's a signal that the bearish trend may soon turn to bullish and when it enters overbought, it means that but may soon be exhausted and the trend may change to bearish.
Now, let's see combine this indicator with a triangle pattern that has formed in the past and see the signal the indicator will give. In the screenshot below, you will see a chart of LTCUSD formed a symmetrical pattern in a daily timeframe. Then, I added a stochastic oscillator to the chart. See the screenshot below.

Combining Stochastic oscillator with Symmetrical Triangle Pattern | Screenshot from my MT4 app
As it is seen in the screenshot above, the symmetrical triangle pattern formed on the chart. But if you notice the stochastic oscillator, you will realize that it entered oversold prior to the break of the pattern. And of course we know that when the Stochastic oscillator enters oversold, it is a signal that the sellers are getting exhausted and that the trend may change to bullish. This is another confirmation for the symmetrical pattern that's forming on the bullish trend. And as soon as the price breaks the pattern, there's great momentum to the upside.
I have used an oscillator based indicator, Stochastic oscillator to confirm the signal of the symmetrical triangle pattern. Now, I am going to use another type of indicator. Right now, I am going to combine a volume based indicators with the symmetrical triangle pattern. And the indicator I will be using is volume indicator.
Volume indicator is the popular volume-based indicator that traders use. It's easy to read and understand. Then, it gives high level of accuracy. Hence, most traders use volume indicator among others type of volume based indicator.
Let's see the signal it will give. In the screenshot below, you will see a volume indicator being added to the chart of LTCUSD in which a symmetrical triangle pattern was formed on it. See the screenshot below.

Combining volume indicator with Symmetrical Triangle Pattern | Screenshot from my MT4 app
As it is seen in the screenshot above, we have the symmetrical pattern formed on the chart of LTCUSD which I the consolidation which occurs after a bullish rally to the upside. But of you look at the volume indicator down, you will notice that during the period of this consolidation (symmetrical triangle pattern) the volume is seen decreasing. I labeled this period with (1). This signifies that there's no too movement in market during the period. But something happened when the price broke the pattern. As soon as the price breaks to the upside, the volume increased. I labeled this place as (2) in the screenshot. This signifies that, money is pumped to this side and the buyers have take over the market.
We can see the importance of combining indicators with triangle patterns. Firstly, stochastic showed oversold before the price broke the pattern and then, immediately the price broke the pattern, we saw increase in volume. Then these two more signals gotten from two indicators have shown that the price will rally to the upside. And as we can see, the price rallied with a very great momentum to the upside. Hence, the importance of combining indicators with triangle patterns cannot be overemphasized. Once the traders learn how to use the pattern and indicators, then he's good to go.
3.Explain Flags in Trading in your own words and provide screenshots of both Bull Flag and Bear Flag.
Flag patterns is a chart pattern which is common on the chart. It is a continuation pattern which formed after a quick rally up or down. That's these patterns form after the price move very rapidly in the direction of prevailing trend and what follow is the consolidation in the form of a channel or rectangle. During this consolidation, the volume will be greatly reduced, until the price breaks the flag pattern. The pattern has a flag pole which is the rally leg, follow by the flag itself.
Flag pattern is of two types: bull flag and bear flag. Let me start with a bull flag.
Bull flag
Bull or bullish fall pattern is type of flag pattern that forms in a bullish trend market. The pattern is a trend continuation pattern. It consists of:
the flag pole which is the rally up leg to the upside with a great and quick move. The flag itself which is the consolidation which forms channel like shape. Trendlines are used to join the high and lows of the flag, and the trend lines with be seen parallel to each other. See the screenshot below.

Bull Flag | Screenshot from my MT4 app
Let see what bear flag is.
Bear flag
Bear flag pattern is similar to bull flag, only that the bear flag pattern is formed in a bearish trending market. This pattern is also a trend continuation pattern. It occurs after a quick move to the downside. That's when the sellers drive the price of an asset to the downside with a great momentum. Then if the consideration that happens after this move is like a channel, then it's called a bear flag. The rally move to the downside is called flag pole while the consolidation that looks like a channel up is known as flag.
During the formation of the flag, the volume will be seen decreasing as there's no much movement in the market. But as soon as the flag breaks to the downside, the sellers drive the price downward with a very great momentum and volume. The screenshot below shows the bear flag.

Bull Flag | Screenshot from my MT4 app
4. Show a full trade setup using these Patterns on any Cryptocurrency chart. (Ascending Triangle, Symmetrical Triangle, Bear Flag)
In this task, I am going to be showing full trade set up using ascending and symmetrical triangle pattern and bear flag pattern. Let's start with ascending triangle pattern.
Trade setup for Ascending Triangle.
To trade ascending triangle pattern, the first thing to note is that, the market must be in a bullish trend. This means that a rally up to the upside must first happen. Then, a consolidation which will form the pattern will start.
The trend line is used to join the resistance which the pattern forms. This will be the upper trend line and it must be flat. The second trendline should be a rising or ascending lower trendline. Once these two trendlines are drawn we can wait for the price to break it to the upside.
Once the trendline breaks, the entryshould be at the at the resistance line that is the flat upper trendline. The stop loss should be placed at a level below the support line, that's the rising trendline.
For the target level, the rally up leg should be measured and should be subtracted from the high of the consolidation. See the screenshot below.

Ascending Triangle Trade set up | Screenshot from my MT4 app
Trade Setup for Symmetrical Triangle
For the symmetrical triangle, it's a neutral pattern. Meaning that it can form in a bullish or bearish trend. What's important is to know the trend which the pattern forms because the breaking side depends on the prevailing trend.
The first thing to note is that the must be a rally down or up depending on the trend. Now, for this set-up, the market is bullish. So we have the rally up to the upside. Then we wait for the consolidation to give us the symmetrical pattern. Trendlines are used to join the pattern. The upper trendline should be seen descending and the lower trendline be seen ascending. Once this trendlines are drawn, we wait for price to break.
The entry point is the break of the resistance line, the upper trendline in this set-up. The stop loss is placed below the support line, the ascending lower trendline. Then the target is set by measuring the first leg and subtract the first low made by the rally leg. In case of down trees for this set-up, it is the mirror.
See the screenshot below.

Symmetrical Triangle Pattern Trade set up | Screenshot from my MT4 app
Trade Setup for Bear Flag
To trade bear flag, first the flag pole must occur. And of course we know that it should be in a bearish market. Once the pole is formed, we will wait for the consolidation which will form the flag pattern.
Once the consolidation forms, trend lines should be drawn to connect its highs and lows together. The pattern should be seen like a channel like shape. That's the two trendlines will be parallel to each other. Then the next thing is to wait for the price to break the lower trendline to the downside.
The entry is placed at the break of support line, the lower trendline. Stop loss is placed a little above the high that broke the lower trendline. The target is set by measuring the start of the previous bearish leg to the high it makes. See the screenshot below.
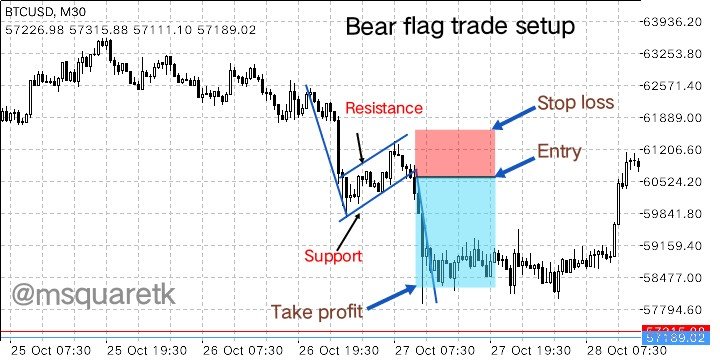
Bear Pattern Trade set up | Screenshot from my MT4 app
Conclusion
Chart patterns are one of the technical tools which the trader use to predict the movement or direction of price. There are many types of these patterns. In this lesson, we covered triangle and flag patterns. Triangle pattern are trend continuation pattern. It is of three types: ascending, descending and symmetrical triangle pattern. Both ascending and descending are direction dependent, whereas symmetrical is neutral.
Flag pattern is also a trend continuation pattern which occurs after a quick move of price in a trending market. The consolidation that takes place after this quickly move if forms channel like shape is called flag. It's of two types: bull and bear flag. Bull flag is a flag pattern that occur in a bullish market while the bear flag occurs in a bearish market.
Technical indicators can be combined with these patterns to increase the winning rate. This will give confluence and we will have more than a reason to take trades. Thanks to Professor @sachin08 for the teaching. I have learnt one or two things from the course.
N.B: All screenshots are taken from my MT4 App.
CC @sachin08
Written by @msquaretk