Crypto Trading With Linear Regression Indicator - Crypto Academy /S5W5-Homework Post for kouba01

Cover page created by me, @msquaretk | created with imarkup App
It's a great week in the Steemit Crypto Academy. We are already in week 5 of the season 5 in the Academy. I'm glad I am participant and thanks to our Professors and the management of the Academy.
Today, I am writing this post in response to Professor @kouba01 's assignment after his lecture on "Crypto Trading With Linear Regression Indicator". He did justice with the topic. So, I will be responding to his questions one after the other. Follow me closely.

1. Discuss your understanding of the principle of linear regression and its use as a trading indicator and show how it is calculated?
In this first task, I am going to be showing my understanding of linear regression, its usefulness to us as traders and how it is being calculated. Although, you may not find it simple to easily comprehend, but with the help of some infographics I will add to the explanation, at the end you may not have any question to ask.
Some of us who are students of science or who has taken statistics must have come across the linear regression before. And of course, we must have done one calculation or the other on it. For those who have not heard of linear regression before, I will make sure i keep this explanation as simple so everyone can flow along.
When we are talking about linear regression, there are some important things we must take note. We need a line and some series of points distance from that line. The distance of the points are also significant in linear regression. Thus, simply, linear regression is a way of finding a straight line by squaring the distance of each the of point on a graph. The concept of linear regression is studied in other to determine the correlation between two dimensions.

Linear Regression | Designed by me @msquaretk on imarkup app
If you look at screenshot above, it's a representation of linear regression on the graph. You will see a brown line drawn and the points are around it. It's gotten by calculating or measuring the distance of each of the point from the line and this distance is squared.
This means, by squaring this distance, it considers this as not a simple average. Then, also it should be noted that there are points which are very distanced to the line. Their distances when squared will have a great impact on the overall result of the linear regression. And by this, linear regression indicator is very different from moving average.
Now, let's see how this tool is used in trading. We have seen how they are used in statistics. I said it is used in the study of correlation between two dimensions. You remember I also said the points surround the lines and the distances of this point from the regression line is squared. Now, what are these points on price chart? The points are the price of an asset of a certain period of time. For example, we can take the highs and lows, closing and opening of the price as our points and plot and take these data to calculate our line of regression on the chart price.
Then, upon deciding what to use as points, then we will be asked, when inputting these values, the number of candles the calculation of the regression should take into consideration. Although, the standard value as recommended is 14 but individual trader can set it this value to suit their liking and their strategy.
Line of regression indicator is an indicator which is very similar to moving average, but have some differences. The indicator gives trend confirmation by showing the trend which an asset is. Apart from showing the trend, it is also used for entry position in the market. Further, traders take entry position when the price cuts the line of regression.
How Linear Regression is calculated
Linear regression is calculated by what's known as sum of least squares. This method involves the comparison of a series of straight lines so as to determine the one that best fits or suits the data which have been selected. Remember I said the points we use in trading are the price, which may be highs or lows, opening or closing of price. So, by comparing series of lines, the method will select the best for the the data which we select.
The following steps should be followed when calculating it:
- Data points should be plotted in a table
- The distance between each data point and the straight line in view should be measured or calculated
- Then, the distance should be squared
- The sum of these squares should be calculated.
- Then, the first four steps is then repeated for any other possible line in view.
- Then lastly, the line with the lowest sum of the squares is then selected.
For example, the sum of squares is calculated as this where
Price = 15.30 + 0.13 * day n.
Then, the distance is then measured and squared. This is repeated for the number of days in view and then sum all together to get the sum of squares.
Alternatively,
We can use the formula of a straight line to calculate the the sum of squares. The formula for this is
y = a +bx
Where,
y = price
x = date
b = slope
a = constant.
Then, to get the slope, b, we use the formula
b = ( nΣxy - ΣxΣy ) / ( nΣx² - (Σx)² )
And also, the constant, a is calculated as:
a = ( Σy - bΣx ) / n
Formula Source
2. Show how to add the indicator to the graph, How to configure the linear regression indicator and is it advisable to change its default settings? (Screenshot required)
In this task, I am going to be explaining how to add linear regression indicator to chart, how to configure it and state my opinion about whether it's advisable to change the default settings.
Now, to add the linear regression indicator to the chart, I am going to be using trading view platform. To visit their website, you may click this link : https://tradingview.com. If you don't have account with them, you will need to create a free account. Then, after that, click on the the menu which contains the features of the trading view at the left hand side of the homepage. Locate the chart feature and click on it.
- Upon clicking on the chart, you will be taken to a page containing chart, select the pair you want to add the the linear regression indicator to at the top of the chart. Then after that, locate the "fx Indicator". Click on it.

Screenshot from Trading view | SOURCE
- Then, upon clicking on the "fx indicator," you will be taken to a page where you can search whatever indicator you are looking for. In the box provided for search, type "regression line formula" and allow it to bring the result. Once you see it, click on I just once. The Indicator window be added to the chart.

Screenshot from Trading view | SOURCE
You will see the indicator appear on the chart once you click on it or tap on it once. If you tap twice the indicator will be added two times. So just tap on it just once. Although you can remove one if you mistakenly tap more than once.
To configure the indicator, click on the indicator at the top left side of the chart. You will see linear regression. Or you can also tap it directly on the price chart. Now, you will see some icons upon clicking on it, look for setting like icon, click on it to configure the indicator.

Screenshot from Trading view | SOURCE
Once you click on this icon, you will see a small page appear on the chart. There are three sections you will see. The input, style, and visibility. For the input, you can change the length of the indicator here. 14 length is considered as the standard value, but you can adjust this to your liking.

Screenshot from Trading view | SOURCE
On the style, you can change the color of the indicator. Some people prefer a different color to their color of candlesticks. This means, you can choose a red color so far as you don't have red in the color of your candlesticks. However, you can choose color of your choice. Also, you can increase the thickness of this line, by clicking on the line and change it.

Screenshot from Trading view | SOURCE
You can leave the visibility like that. Then, after setting everything to your taste or liking, click on ok. The setting will be added to the linear regression. As you can see in the screenshot below, I habe already added the linear regression testing to the chart and show how it's being configured.

Screenshot from Trading view | SOURCE
Is it advisable to change its default settings
Well, the question that is it advisable to change its default settings depend on the individual liking. However, we must know that the creator of any Indicator must have seen one or the other before recommending the data that will work well for the indicator. For example, the standard value for the length is 14. This means, the linear regression will take into consideration 14 days before the price changes.
Further, when other traders tried to use different length and period, they found out that length or period one chooses depend on the length of trend you are following. Some people prefer 66 length because of how effective they claim it is in predicting the market.
In all, I think the most important thing I to know which setting works well for you. If the default settings works well for you, you may decide not to change the default settings. However, if you try to use different length and you find out that one period is more accurate that the default settings, then it's not a crime to change it. So far it won't affect you trading strategy and you are cool with it, then you can change it.
3. How does this indicator allow us to highlight the direction of a trend and identify any signs of a change in the trend itself? (Screenshot required)
In this part of the task, I am going to be explaining how to use the Indicator to get the direction of trend and point of reversal in the market.
Knowing Direction of Trend Using Line of Linear Regression
The linear regression indicator is a great indicator which shows us the trend which the market is at a particular moment in time. When the price of an asset is above the line of regression, the trend is said to be bullish. This means at that particular time, the bulls overpower the bears and the line of regression will be beneath the price.
On the other hand, when the price is seen below the linear regression line, then the asset at that particular time is said to be in a bearish trend. This means that sellers are in control of the price and the line of regression will be following the price above.
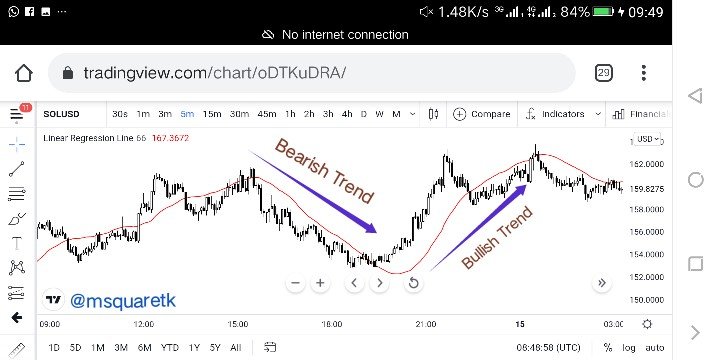
Screenshot from Trading view | SOURCE
In the screenshot above, we can see the chart of SOLUSD. Regression indicator is added to the chart with the 66 period being the length. Now, if you can see the bearish trend I marked, you will notice that he price was below the the line of regression. That means, the trend is downtrend at that moment. Also, you see the bullish trend, the price was above the line of regression during this period.
Identification of Trend Reversal
Linear Regression indicator can also be used to determine the point of reversal in the market. And this is one of the great advantages of this indicator. We know that when price is above the linear regression line, we are in bullish trend and when the price is below regression line, we are in bearish trend. Now, when a bullish trend wants to change to a bearish trend, the line of regression should change slope. When it begins to change slope, then we can decide to exit the market and be ready for a new trend in the market.
As soon as the line begin to change slope, the candlesticks, price will be crossing from below to above the line of regression. This will mean that a bearish trend wants to change to a bullish trend. And also, in a bullish trend, if the price reaches its peak area and the line of regression begins to change slope and price crosses from above down the line of regression, then that means the bullish trend is changing to bearish trend.

Screenshot from Trading view | SOURCE
If you look at that screenshot, you will notice that SOLUSD was in a bearish trend at a particular time and as the line of regression changed slope the price crossed from beneath to above the line and the trend reversed and changed to bullish trend.
4. Based on the use of price crossing strategy with the indicator, how can one predict whether the trend will be bullish or bearish (screenshot required)
Another way we can predict whether a trend will be bullish or bearish is through a method or strategy called cut. This means, we will look for where the candles or price cross the line of regression and predict, based on how it cross, whether upward cross or downward cross, the direction of price. Through this crossing, traders can place entry position and take advantage of the trend that's changing phase.
For bullish Trend
A bullish signal is generated when the candles or price action cuts the line of regression to the Upward. That's when we have candles goes from beneath to above the line of regression, we call that upward cut, and then the trend is said to be preparing for its bullish move. The candles must be close above the line of regression for a valid upward cut. Then, traders can open a buy order when the candle close above this because it is a bullish signal.

Screenshot from Trading view | SOURCE
In the screenshot above, we can see how the candles cut upward the line of regression. That cuts are bullish signal.
For Bearish Trend
A bearish signal is given when the candlestick cuts the line of regression downwards. This means, the price action that was above cross the line of regression to the down side. It should be noted that for the downward cuts to be valid, the candle must close below the line of regression. Traders can open a sell entry when the see that the downward cuts is calid and join the bearish trend.

Screenshot from Trading view | SOURCE
In the screenshot above, we can see how price or candle cuts the line of regression downward and that followed a rally to the downside. A cut to candle to downside gives bearish signal.
5. Explain how the moving average indicator helps strengthen the signals determined by the linear regression indicator. (screenshot required)
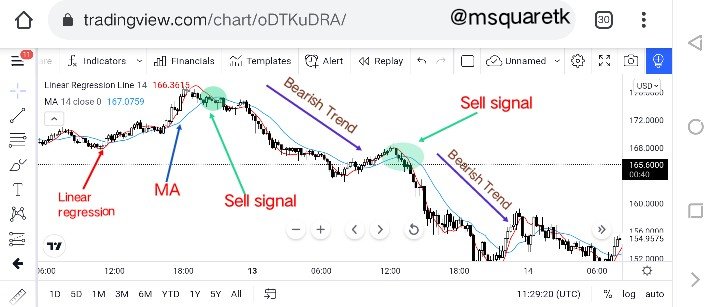
Like I said earlier, linear regression indicator is very similar to moving average. In fact, if you don't see the name on the chart, you may be confused that linear regression i added to the chart is a moving average. They look alike and almost move the same way, but some similarities exist between the two. Like of regression reacts faster with price changes than moving averages. This means that linear regression is more dynamic than moving average. Although, as it reacts faster, it also gives more false signals. And that's why you will see professionals advise newbie to not use one indicator as a standalone tool.
It's with this reason people combine linear regression with other indicators. One of the indicators that is mostly combined with linear regression is Moving average. Moving average is used to filter the false signals. This means, the entry will be taken in the market where there's signal from moving average and the linear regression at the same time. By this, the false signals given by the linear regression will be greatly reduced as there will be double signals, signal from linear regression and moving average.
The configuration of moving average and that of life regression depends on your trading strategy. If you are an intra day traders, you can use lower periods so as the indicator to react faster with the price changes.
A buy signal is generated when the price cuts the line of regression and moving average upward. Then, the moving average will be seen below the the price and line of regression. See the screenshot below.

Screenshot from Trading view | SOURCE
As it is seen in the screenshot above, the price moves from below the the line of regression and moving average goes above, then, a rally to the upside followed. We see that the price cuts both lines, we can actually place buy order when we see this scenario happen.
Also, a sell signal is generated when the price cuts the line of linear regression and moving average downward. The moving average will be seen above the line of regression and price. Thus, by this, we confirm that market is also in a bearish trend until the orientation changes. See the screenshot below.
Screenshot from Trading view | SOURCE
As it can be seen on screenshot attached above, we saw price cuts down the line of regression and moving average, that tells us that a sell signal has generated and what followed was a rally to the downside.
6. Do you see the effectiveness of using the linear regression indicator in the style of CFD trading? Show the main differences between this indicator and the TSF indicator (screenshot required)
Linear regression indicator is a great indicator which is also effective in the style of CFD trading. Now, to understand this better, I think there's need for.me to explain what CFD trading means. CFD (Contracts for difference) trading is an advanced trading style in which investors agree with the CFD broker so as to swap the value of financial products with a very short time of when the contracts opens and closes. This type of trading is for professionals.
So, in this type of trading, the investors look for short term profit and that's why they don't use any indicator which lags behind the price because they want indicator which follows price and can quickly identify price changes or differences. This, linear regression is also useful in this style of trading since it's a trend follower indicator. Meaning the indicator gives or shows the trend in which asset is, and because of its dynamic nature, it's very suitable in CFD trading.
Time series forecast (TSF) series Indicator is just like normal linear regression indicator but just that the former reacts even more faster than the later. Thus, TSF is most suitable for short term trading position, while the linear regression can be used for medium to long term. In the screenshot below, I have added the indicators, LRI and TSF into the chart of SOLUSD and timeframe of M15.

Screenshot from Trading view |SOURCE

Screenshot from Trading view |SOURCE
As we can see, that the indicators are very similar on the chart. You will notice I used 20 period for both indicators. The LRI is with red color and the TSF is red color.
Difference Between Linear Regression and TSF
Like i said, the major difference between TSF and linear regression is that, the former reacts faster. It's with the reason why TSF is considered more effective for short term trading. Whereas, linear regression is slower than TSF, and hence it's most useful and effective for medium or long term trading.
7. List the advantages and disadvantages of the linear regression indicator
In this part of the task, I am going to be listing the advantages and disadvantages of the linear regression indicator. Let's start with advantages.
Advantages
- Linear regression reacts faster to price changes due to his dynamic nature more than moving average. Thus, it gives more entries in the market.
- Linear regression is a trend follower. Thus, it gives or show the trend which an asset is.
- Through the cuts strategy, we can predict the bullish and bearish signal and can place entry.
- Unlike some indicators which are very difficult to read, linear regression indicator is very easy to read and understand.
Disadvantages
- As a result of its ability to detect and react fast to price changes, it gives more false signals.
- It's often used for cryptocurrency pairs that are not that volatile. Meaning, it is not that effective for high volatile pairs.
- It's not effective when used alone. Hence, to increase the success rate, one more indicators or tools should be combined with it.
Conclusion
Linear regression indicator is one of the Indicator which traders use to predict the direction of price. The indicator is derived by using price as the points and find the line of regression by measuring the distance of these points and square them. Just as it is Statistics, it's used to measure the correlation between two dimensions. In trading, linear regression takes price and time into it's calculation. The indicator, very similar to moving average, is a trend indicator and reacts very fast to price changes or differences.
Linear regression, though very fast in reacting with price differences, should not be used as a standalone tool. It should be combined with other indicator or tools so as to filter the false signals given. Moving average indicator can be used or combined with it. In this homework task, I have been able to demonstrate my understanding of linear regression indicator.
Thanks to Professor @kouba01 for bringing this course up. I have learnt one or two things. I look forward to seeing your next work.
Thank you all for visiting my post.
CC: @kouba01
Written by @msquaretk